Abstract
Antioxidants play a role in counteracting free radicals and reactive oxygen species and are thought to help prevent or slow the progression of many chronic diseases, such as cancer, diabetes mellitus, cardiovascular disease, and neurodegenerative diseases. Herein we report a simple way to make a colorimetric assay for measuring total antioxidant capacity (TAC) on craft paper-based analytical devices (cPADs) suitable for sub-μL volume blood samples. We incorporated a microfluidic separation mechanism for isolation of plasma from interfering blood cells. The whole diagnostic process, including cPAD construction, plasma sample preparation, assay, and image thresholding analysis, can be completed in fifteen minutes. We applied our approach toward the measurement of TAC in mice that model Huntington’s disease (HD), a fatal, neurodegenerative movement disorder. Results revealed that TAC was significantly elevated in R6/2 HD model mice compared to their age-matched wild-type (WT) controls. We expect that this method, carrying a simple, fast, and sensitive assay on low-cost and disposable paper, will meet the potential needs for point-of-care (POC) testing of TAC, as well as other disease biomarkers in blood and other types of bodily fluids where limited volumes of samples are obtainable.
Graphical Abstract
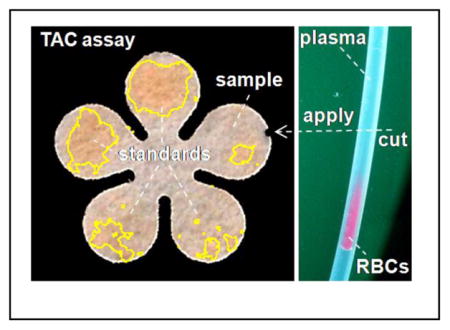
Measuring Total Antioxidant Capacity on papers using sub-μL plasma separated from red blood cells in a disposable tubing
Introduction
Mounting evidence has implicated excessive production of reactive oxygen species (ROS), and resulting cellular damage,1 as a key contributor to the development of many progressive neurological disorders, such as Huntington’s disease (HD),2 Amyotrophic Lateral Sclerosis (ALS, also known as Lou Gehrig’s disease),3 and Parkinson’s disease.4 Measuring total antioxidant capacity (TAC) is important because absolute antioxidant capacity can profoundly influence the ability of an organism to combat cellular oxidative stress and thereby maintain cell viability.5 Moreover, abnormally elevated levels of antioxidants could suppress ROS that are crucial for the protection of the immune system from the attack of pathogens.6 This latter consideration has come into play recently, given the large number of antioxidant dietary supplements now available in pharmacies.7 More importantly, because antioxidants are present in our daily foods and drinks, it is essential to establish a quick, low cost, sensitive, and personalized diagnostic method to monitor antioxidant capacity on a routine basis. Usually such tests require visits to a clinical site and waiting for the results obtained from a centralized lab; the feedback can be impractically slow.
The use of micro paper-based analytical devices (μPADs)8 have the potential to address many of these issues. They allow quick analysis times (a few minutes), are easy to use, are low cost, provide good limits of quantitation, and require small sample volumes. In light of the growing popularity of point-of-care (POC) diagnostics on paper-based test strips, μPADs have already been widely used for the rapid detection of various types of analytes in bodily fluids such as urine,9 saliva,10 and blood.11 One disadvantage of μPADs, however, is their relatively low selectivity and sensitivity for the tests that are performed on a rough paper surface, compared to the tests on conventional analytical devices. Both of these factors can be improved by removing interfering analytes in the sample preparation step.12 For example, blood tests often require the removal of red blood cells (RBCs) from plasma. Microfluidic tools are ideal for such preparation and separation because of their ability to handle μL-scale volumes of blood, compared to the consumption of mL-scale volumes of blood when using conventional centrifugation method. In one application, Wong et.al. reported a microfluidic centrifugation method to isolate plasma from RBCs for detection of cholesterol, requiring only ~100-μL blood, a small section of tubing, and a simple hand-operated egg-beater.13 More recently, integrated μPADs with plasma separation membranes or filters have been developed for blood tests11b–e in which roughly 15-μL, and as little as 7-μL, of blood was required for the collection of sufficient plasma for one test.11b,c Although this approach may preclude the need for the centrifugation for μL-volume samples, challenges remain when only a small volume of blood is accessible (e.g., only ~4-μL blood can be obtained through the heel stick of an infant11c).
Here, we describe an approach that combines a recently-developed strategy to isolate plasma from sub-μL blood14 with TAC testing on craft paper-based analytical devices (cPADs). Instead of forming a droplet-based assay in a microfluidic chip,14 the isolated plasma was directly deposited to a cPAD for the test, demonstrating the great simplicity and opportunity of this combination for POC testing of blood samples. The method for fabrication of cPADs was initially inspired by the wide selection of paper crafts with the possibility of making μPADs by using craft punchers. However, the basic concept of using craft punches to create useful shapes for analytical devices was first described by Ravgiala et al.15a Subsequently, a successful demonstration of a cPAD device to diagnose HCV (hepatitis C virus) infection15b was reported as an alternative to commercialized HCV test strips.16 In this work, we have developed a colorimetric assay to detect TAC on disposable paper diagnostic devices for the first time, aiming to address the potential need for rapid on-site test of TAC in sub-μL fluid samples. The image thresholding analysis method enables us to distinguish different antioxidant concentrations measured between samples and different incubation times. As proof of concept, our initial results in measuring TAC in transgenic HD model mice suggests that TAC is altered during the progression of the HD phenotype in transgenic R6/2 HD model mice. Collectively, this work shows that testing TAC in small volumes on paper devices can provide meaningful, prompt, and low-cost results, and can be used to characterize TAC in neurodegenerative disease as well as other conditions.
Experimental
Chemicals and Materials
The TAC assay kit adopted for TAC tests on cPADs was purchased from Cell Biolabs, Inc., USA. Food dye, a product of McCormick (USA), was diluted 20-fold with deionized water. A 60 mM uric acid (UA, Sigma-Aldrich, USA) stock solution was prepared freshly in 1 M NaOH and then serially diluted into 4, 2, 1, 0.5, 0.25 and 0.125 mM solutions with 18 MΩ DI water. Citrate concentrated solution (4% w/v, Sigma-Aldrich, USA) was mixed with whole blood at a volume ratio of 1:9 to prevent blood from coagulation. Mineral oil (Sigma-Aldrich, USA) was used as the carrier of the blood plug.
Whatman® Grade 1 Qualitative Filter Papers (GE Healthcare, UK) and Brand® Parafilm® M sealing film (Bemis Company, Inc., USA) were used to make cPADs. Craft punches are products of Fiskars Brands, Inc. (USA). A 10-cm long PTFE tubing (365-μm i.d., 800-μm o.d.) connected to a 500-μL syringe (Gastight 1750, Hamilton Company, USA) was taken for plasma separation. A syringe pump (11 Pico Plus Elite, Harvard Apparatus, USA) provided the driving force for the flow. A microplate reader (EnSpire 2300, PerkinElmer, USA) was used to measure TAC on a 96-well plate (BD Falcon, USA). cPADs images were captured by a scanner (HP C4480, USA) and analyzed with the ImageJ software package (NIH, USA).
Animals and Plasma Preparation
C57BL/6 mice and Wistar rats were obtained from Charles River (USA). R6/2 HD model mice [B6CBA-Tg(HDexon1)62Gpb] and wild-type (WT) control mice were purchased from Jackson Laboratory (USA); TAC was tested on both groups at an age of 12 weeks. Animals were housed at the University of Kansas Animal Care Unit prior to use and maintained on a 12-hour light-dark cycle. Food and water were provided ad libitum. All animal procedures were approved by the Institutional Animal Care and Use Committee.
Blood was collected by snipping ~1 cm of the tail immediately after the mouse was decapitated (brain tissue was harvested for other purposes). Blood was then withdrawn from the end of the tail and mixed with a sodium citrate anticoagulant solution at a ratio of 9:1 and then diluted by 1X reaction buffer at a ratio of 1:4, which resulted in a ~5.56-fold dilution of the whole blood. Plasma samples were separated from the interfering RBCs in two ways: i) RBCs sediment to the bottom of the PCR tube by gravity, which was simple but took more time; ii) RBCs aggregated at the end of a flowing plug in a ~10-cm section of tubing,14 which was faster but required microfluidic control of the flow.
TAC Assay and Protocol
We incorporated on this cPAD platform a colorimetric TAC assay kit designed for analysis of 20-μL undiluted samples using microplate reader on 96-well microplate. This assay is based on the reduction of Cu2+ to Cu1+ by the antioxidants present in a sample, followed by coupling of the reduced Cu1+ with a chromogenic reagent that will produce a color with a maximum absorbance at 490 nm. The major advantage of the TAC assay, compared to measuring a single antioxidant, is that it provides a measure of the overall ability of the organism to defend against oxidative insult.17 We applied this assay on cPADs with the intent of developing a POC testing strategy for TAC in the near future.
UA standards, with concentrations of 0.4, 0.2, 0.1, 0.5 and 0.025 mM, were prepared by further dilution of 2, 1, 0.5, 0.25 and 0.125 mM UA solutions with 1X reaction buffer. The coating reagent was mixed by 1X reaction buffer with 5X copper ion solution at a ratio of 4:1. All the solutions were freshly prepared before the tests.
The assay was performed by spotting 12.5-μL coating reagent to the center of a cPAD. Right after the reagent covered all petals on the cPAD, 0.5-μL sample and standard solutions were applied to each of the petals. The cPAD was then incubated at room temperature, allowing further reaction to occur before the image of the cPAD was scanned every two minutes at 300 dpi. Control experiments for plasma samples were conducted by spotting the isolated plasma to cPADs coated with PBS. The scanner surface was cleaned with isopropanol prior to each measurement.
cPAD Fabrication
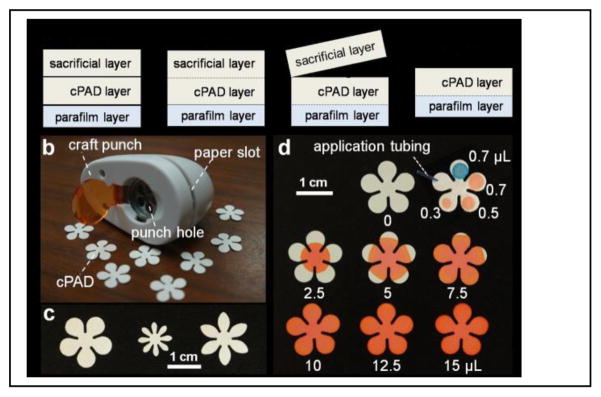
We selected a few structures with identical branches that can be potentially used for multiplexing tests, as shown in Figure 1 and Figure S1 in Supplementary Information. The fabrication process is schematically illustrated in Figure 1a. Our method is slightly different from the previous reported punch method15a,b in that we added one sacrificial and one protective layer sandwiching the μPAD layer. Two pieces of filter paper placed on top of a plastic sheet of Parafilm were first inserted into the paper slot of the paper punch. A shaped craft was made after a single press of the punch handler. The sacrificial paper layer on top was then peeled off from the bottom layers, which are naturally stacked into one piece due to the compression from punching. The purpose of the Parafilm is to protect the paper from contamination as it contacts with bottom support during the test.
Figure 1.
Fabrication and evaluation of craft paper-based analytical devices (cPADs). (a) Schematic illustration of the fabrication process. (b,c) cPADs made by a hand craft punch on an office desk. (d) Liquid capacities on cPADs showing red and blue dyes spotted to cPADs by pipette and application tubing.
Results and discussion
Flow Capacity on cPADs
We used a five-petal flower-shaped cPAD to demonstrate the ability of the particular device we constructed to transport reagent from center to branch petals, hold samples in individual petals, and mix samples with pre-coated reagent. First, in Figure 1d, 2.5, 5, 7.5, 10, 12.5 and 15-μL volumes of red dye, representing reagent, were spotted respectively to the center of the flower. The dye immediately spread to all petals under the capillary action until it reached the limit of its radius based on the volume of the load. We chose to spot 12.5-μL coating reagent onto the cPADs for later analysis to guarantee that all the areas were being covered. Second, the cPAD in the right top corner of Figure 1d shows incremental loads of samples applied on petals by a volume-adjustable pipette (red spots) and a PTFE application tube (blue spot). The volume in the tube was calculated by its diameter and length, which was applied to the cPAD under capillary action and identical with the volume applied by a pipette. To make sure all the sample spots confined within the petals of cPADs, we picked 0.5 μL as the sample volume for later studies.
Assay of UA Standards and Image Thresholding Analysis
As shown in the top row of the images in Figure 2a, the 0.4, 0.2, 0.1, 0.05 and 0.025 mM UA standards were deposited counterclockwise onto five pedals of a cPAD, and scanned every two minutes. The images were imported into ImageJ. A color threshold was applied to the images to get rid of background color and outline the color zones that were recognized by the program, as shown in the bottom images of Figure 2a. The identified color zones, which were also visible to the unaided eye, were then extracted from the images, and the average grayscale values were measured in the areas of the red dashed circles covering all the color that developed on the pedals (Figure 2b). Both the color intensity and color zone on the cPAD increased with the concentration of UA as well as the extension of incubation time (see Figure 2a and Figure 2c). For example, at the lowest concentration of UA (0.025 mM), the color was initially invisible and then became evident at 7 minutes. Thus we picked 7 min as the detection time for all standards and samples as a compromise between achieving a low limit of detection and the need for rapid diagnosis.
Figure 2.
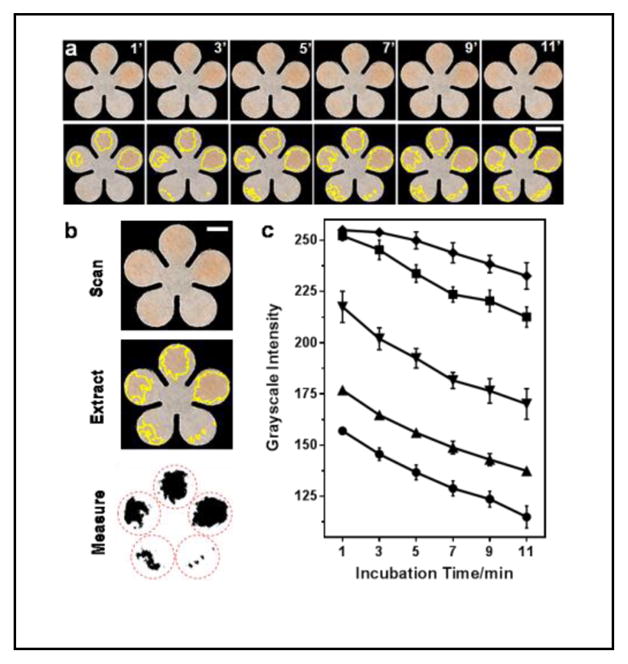
Colorimetric detection of total antioxidant capacity (TAC) on cPADs. (a) Colorimetric assay of 0.4, 0.2, 0.1, 0.05 and 0.025-mM uric acid (UA) standards, counterclockwise deposited to a cPAD from 2 o’clock position, and imaged every two minutes. The yellow outline on each pedal indicates the color zones recognized by ImageJ. Scale bar is 5 mm. (b) Procedures for image thresholding analysis of the TAC assay after a 7-min incubation period. Scale bar is 3 mm. (c) The grayscale values measured by ImageJ in detection areas on cPADs, showing the color intensities increased with UA concentration and incubation time: 0.025–0.4 mM from top to bottom (n = 5). The darker the color, the lower the grayscale intensity.
There are two main advantages of determining average grayscale intensity within the whole area where the color develops on the paper. First, the accuracy of measurements will not be impacted by the uneven distribution of sample fluid within the measurement area. Second, it will collect all the signals that are produced by the reactions, helping to detect lower sample concentrations. The gradual change of the developed color in top series of images in Figure 2a may not be noticeable to the unaided eye, but the image thresholding analysis method based on measuring the whole color areas allowed us to improve the level of image contrast, enabling us to distinguish both the color and grayscale changes with incubation time.
The standard curve was then obtained by measuring 0.025 to 0.4 mM UA standards at 7 min, as shown in Figure 3a. The relative standard deviation (RSD) from individual measurements of each concentration was less than 5%. The grayscale values were found to linearly decrease with increase of UA concentrations from 0.025 to 0.1 mM: y = −880.43x + 273.43 (r2 = 0.9798), presented as black dots and a best-fit line in Figure 3c. The limit of detection and limit of quantitation, based on three and ten times of the residual standard deviation versus the slope of the calibration curve, were roughly 0.01 and 0.04 mM, respectively. With further extension of the incubation time, it was possible to detect lower concentrations; however, we elected to accept a higher, but acceptable, LOD in order to achieve faster diagnostics.
Figure 3.
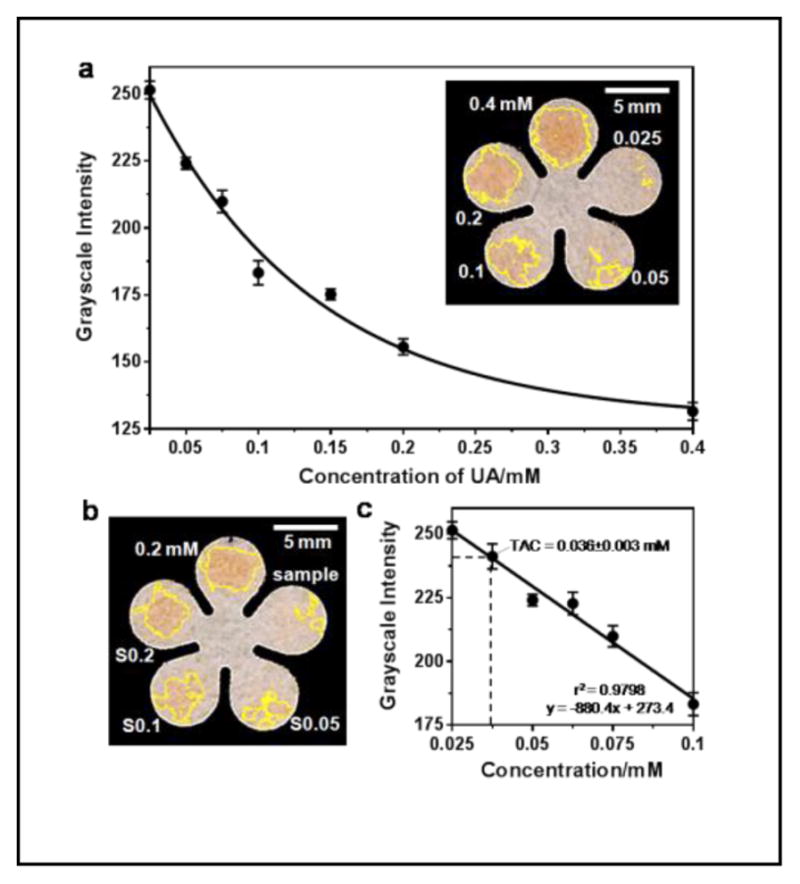
Quantitation of TAC in mouse plasma on cPADs. (a) Standard curve of UA ranged from 0.025 to 0.4 mM (n = 7). The inset image shows an example of an assay in which 0.5-μL of a standard solution of 0.4, 0.2, 0.1, 0.05 and 0.025 mM UA was applied to the cPAD. (b) Test of TAC in a plasma sample isolated from diluted C57BL/6 male mouse blood. The accuracy of the TAC measurement was verified by spiking UA standard in three different concentrations: S0.05, S0.1 and S0.2 represent mixtures of plasma samples with 0.05, 0.1, and 0.2 mM UA at a volume ratio of 1:2 respectively. “0.2 mM” indicates the concentration of a UA standard. (c) Calibration curve in linear range of (a) indicating the measured TAC in mouse plasma (n = 6 samples).
Testing of TAC in Mouse Plasma Samples
To verify the ability of this assay to test blood samples, we measured TAC in mouse plasma on cPADs. Mice make up one of the most intensively studied animal models in scientific and clinical research, largely due to the expansive selection of commercially-available transgenic mouse models. In the tests, we first took 1.35-μL blood from the tail of a euthanized C57BL/6 male mouse and diluted it to a total volume of 7.5 μL with sodium citrate anticoagulant solution and reaction buffer.
The diluted blood sample was collected and capped in a 200-μL PCR tube and kept at 4 °C for an hour, allowing the blood cells to settle to the bottom of the tube by gravity while leaving ~7 μL of plasma supernatant ready for the subsequent tests.
The results of measuring TAC in the supernatant plasma samples are shown in Figure 3b. By plugging in the mean value of grayscale to the linear regression equation, we found the TAC in diluted plasma of the C57BL/6 male mouse was 0.036±0.003 mM. We ran two sets of experiments to check the accuracy of the measurements. First, we spiked 0.05, 0.1 and 0.2 mM UA standards separately to aliquots of the plasma sample at a volume ratio of 2:1. These additions were expected to increase the TAC (S0.05, S0.1 and S0.2 as indicated in Figure 3b) to 0.045, 0.079 and 0.145 mM. The first two concentrations fell into the linear range and were comparable to the measured values of TAC (i.e. 0.056 and 0.082 mM, n=3). Another volume of 0.1-mM UA standard was equally added right after the blood was collected. After plasma separation, the raw sample and the spiked sample were measured as 0.035±0.001 and 0.061±0.005 mM, respectively (n=3). The expected and the measured values were close from both experiments, confirming that the measurements of TAC on cPADs were accurate. Therefore, after multiplying this measured value by the dilution factor (5.56), we obtained a TAC of 0.201 mM in mouse plasma. In additional experiments, six measurements obtained sequentially over a period of 1.5 h from both a UA standard and a plasma sample capped in PCR tubes remained unchanged (Figure S2). Therefore, the assay was stable over period that was sufficient for plasma preparation and for running multiple tests on-site.
Assay Validation Using Rat Plasma Samples
The limited volume of blood available from a mouse tail precluded us from comparing our result with that obtained using the standard method on a microwell plate, which would require a minimum 40 μL of blood for a single test; therefore, we obtained about 0.5 mL of whole blood from a rat and measured the TAC using both the cPAD technique and a 96-well microplate. The TAC determined from the rat plasma was 0.302±0.029 mM (n=4) using cPADs and 0.251±0.001 mM (n=3) using the 96-well plate method. Figures 4a and 4b show an example of a TAC test on a cPAD and the analyzed result from the measured and averaged grayscale values. For the TAC test on a microplate, 400-μL of blood was mixed with 100-μL anticoagulant solution and plasma was obtained by centrifugation for 15 min at 4 °C and 2000 g. The standard curve and the measurement of TAC in the plasma on the microplate are shown in Figure 4c. Comparisons of consumption, cost and performance of these two methods are summarized in Table 1. The traditional method of testing TAC on a 96-well plate is more sensitive and precise but requires larger volumes of blood and reagent. In addition to the cost of purchasing equipment and consumables, the expense of running a TAC test on paper can be significantly reduced.
Figure 4.
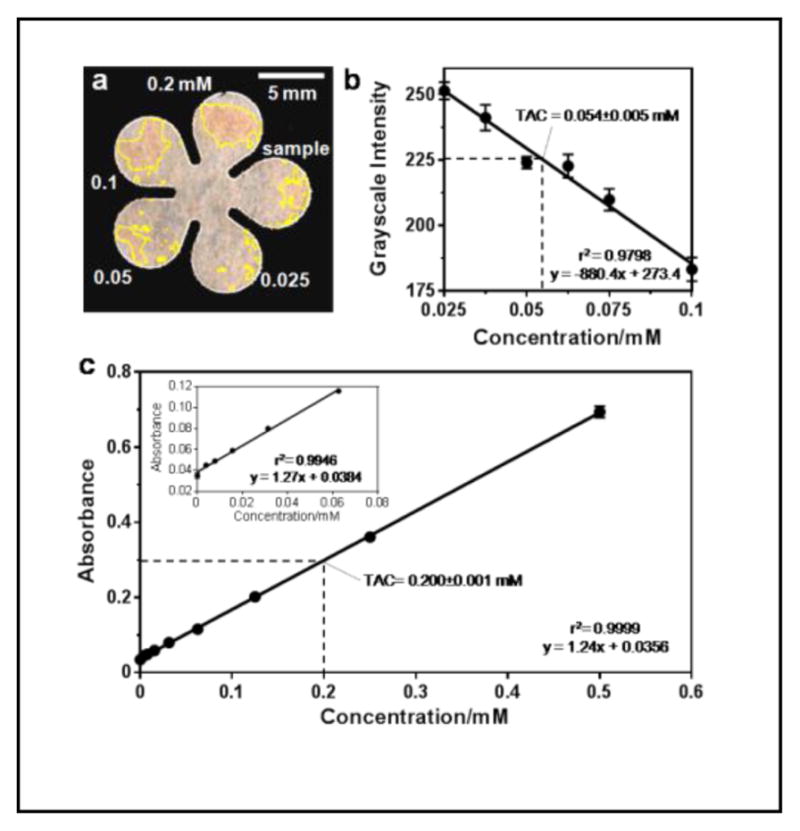
Test of TAC in rat plasma samples. (a) TAC test on a cPAD. Plasma preparation follows the steps described earlier in the text. (b) Calibration curve with the measured TAC in rat plasma (n = 4 samples). The measured value multiplied the dilution factor (5.56) resulting in a TAC of 0.276 mM. (c) TAC test on a 96-well microplate. The measured value multiplied the dilution factor (1.25) resulting in a TAC of 0.251 mM.
Table 1.
Comparison of TAC tests on cPAD and microplate.
| Microplate | cPAD | Ratio (Plate/cPAD) | |
|---|---|---|---|
| Reagent | 230 μL | 12.5 μL | 18.4 |
| Blood | >40 μL | <1 μL | 40 |
| Plasma | 20 μL | 0.5 μL | 40 |
| LOD | 0.0039 mM | 0.013 mM | 0.3 |
| RSD | < 1% | ~10% | 0.1 |
| Incubation | 5 min | 7 min | 0.7 |
| Consumable | Microwell plate ($4) | Paper ($0.02) | 200 |
| Equipment | Microplate reader ($30,000*) | Camera/Scanner ($100*) | 300 |
Estimated values from averaged prices of the products.
Microfluidic Plasma Separation
The primary factor that affects the overall analysis time of this assay was the separation of RBCs from the plasma. Cell self-sedimentation carried out on μL-scale blood samples took about an hour. To enhance the speed of the assay, we switched from this sedimentation procedure to a microfluidic mechanism reported earlier to isolate plasma from RBCs in a flowing blood plug, where the moving plug carries the plasma forward and sweeps and collects the sedimented cells at rear.14 We used larger-diameter tubing (365 μm versus 203 μm) and found that an identical portion of plasma can be separated at a higher flow rate, which was most likely due to the decreased flow resistance for the cells. Therefore, this technique, coupled with cPADs, decreased the time required for POC testing of molecules in blood. Figure 5a shows a representative plasma separation from the interfering cells of a C57BL/6 mouse after 5-min flow at 1 μL/min in a 1-μL blood plug. An approximately 60% volume fraction of plasma can be obtained in the front of the plug. Then, the plastic disposable tubing can be cut with a razor and the front portion of the plasma can be applied to a cPAD under capillary action. The time for preparation of the plasma samples for the tests was, therefore, significantly decreased from ~60 min to ~6 min. The total assay including blood collection and cPAD construction can be completed in 15 min. Although here we used a syringe pump to carry the flow, it is possible to use portable and less precise devices to drive the separation, owing to the wide range of flow rates (from 0.1 to 4 μL/min) that will effectively isolate the plasma.
Figure 5.
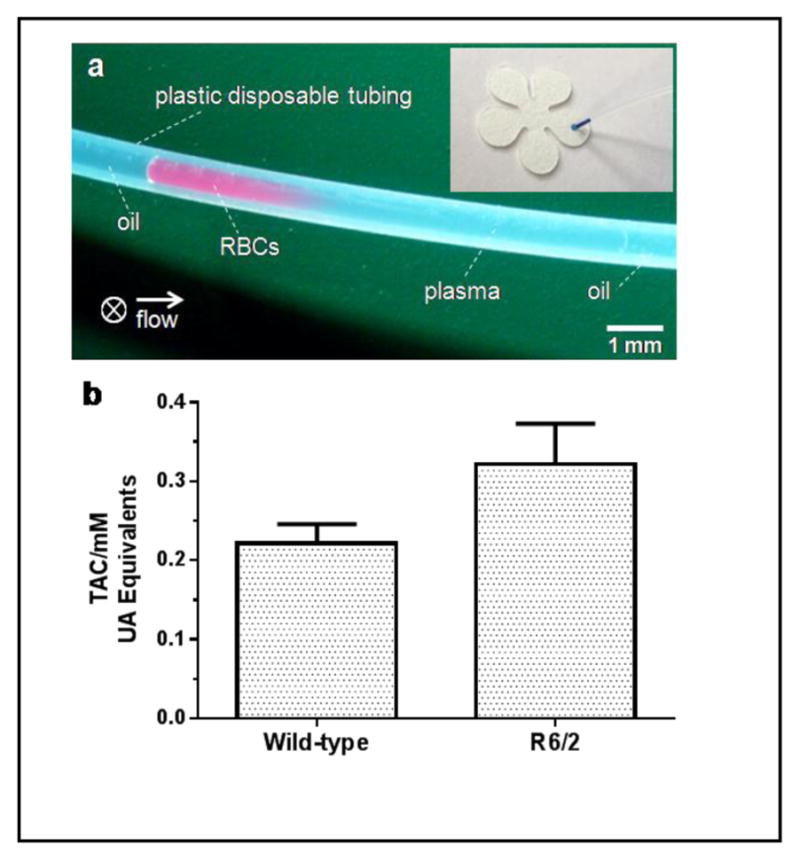
Rapid test of TAC in plasma of R6/2 Huntington’s disease (HD) model mice and their age-matched wild-type (WT) littermates. (a) Isolation of plasma in a flowing plug: picture shows the isolated plasma (right) from RBCs (left) in a 1-μL diluted blood plug after 5-min flowing at 1 μL/min. Approximately 60% plasma can be obtained. The arrow indicates flow direction and ⊗ indicates gravity of cells toward the back of the picture. The inset shows a sample application of 0.5-μL blue dye from the tubing to a cPAD. (b) Comparison of TAC in plasma of R6/2 mice and WT littermates (n = 7 samples from 3 animals of each group). There is a significant difference in TAC between these two groups of mice (p < 0.05, unpaired t test).
Microfluidic technologies specialized in handling microliter-scale fluid volumes are ideal for testing sample collections from an infant, or a single small laboratory animal, where the volumes of bodily fluids (e.g. blood, tears, or urine) are often limited. In the assay here that we adapted to cPADs, only 0.5-μL of diluted sample is needed for a single test of TAC, which is more than a 100-fold reduction compared to the testing on traditional microwell plates. Additionally, this assay is also amenable and sensitive enough for testing TAC in human blood obtained by a finger prick. To our knowledge, the use of paper microfluidic devices to measure TAC in blood samples has not been published in the literature.
TAC in HD Mice
We applied this simple separation technique and the above-established assay on cPADs to obtain TAC measurements from 12-week-old R6/2 HD model mice and age-matched WT control mice. Our laboratory has previously used the R6 line of mice to investigate the role of neurotransmitter release and uptake in HD.18 It was also reported that the selective neuronal death in HD could be partially caused by oxidative stress,2 which reflects the disturbance of the balance between ROS and antioxidants. In the experiment, blood samples, 0.9 μL in volume, were obtained from the tails of freshly euthanized mice and then diluted to a total volume of 5 μL. An aliquot of 1.5-μL diluted blood was then withdrawn into the tubing, prefilled with mineral oil, at 10 μL/min followed by further oil aspiration at a lower flow rate of 1 μL/min for plasma separation. After a 5-minute separation, the tubing was cut at a point 5-mm away from the plasma-oil interface and the 0.5-μL of remaining plasma was then applied to a cPAD. As shown in Figure 5b, our results indicated that the TAC in R6/2 mice was about 1.5 times higher than their age-matched WT littermates (0.322±0.051 mM versus 0.222±0.026 mM). This measurement is consistent with an ability of R6/2 mice to produce an enhanced capacity to deal with increased oxidative stress. Interestingly, a similar increase of TAC has also been discovered in Alzheimer’s disease model mice.19 To our knowledge, the application of TAC assay on HD patients or animal models has not been reported in the literature; however, the enhanced levels of individual antioxidants, such as creatine, glutathione, ascorbate, taurine, and myo-inositol have been reported.20 These enhanced levels may contribute to the elevation of TAC in HD patients and animal models.
Comparing two protocols for plasma sample preparation, the unchanged levels of TAC indicated that both the oil and prolonged period for cell self-sedimentation did not interfere with the accuracy of this assay. The application of plasma samples to the control cPADs resulted in no color changes (Figure S3), indicating that both of the protocols for isolating plasma are efficient enough for TAC testing.
Conclusions
In summary, we have developed a colorimetric assay on paper-based diagnostic devices to measure antioxidant capacity in sub-μL blood samples. The paper device can be simply made on an office desk in a few seconds without the need of sophisticated equipment or harmful chemicals. We have also incorporated a microfluidic separation technique to isolate plasma from interfering blood cells, thus reducing the total diagnostic time to ~15 minutes. The coupling of this rapid plasma preparation protocol to μPADs should broaden the application of POC testing in analysis of biomolecules in blood samples. The disposable parts including the tubing and cPAD cost less than $0.1 for one test, which is about ½ price of blood separation membranes. A more detailed study of the TAC level expressed during the progression of HD is planned in our laboratory. We also expect that, in future studies, this method could accommodate more assays for rapid diagnosis of biomarkers of neurodegenerative diseases in blood, or other types of bodily fluids in which only small sample sizes may be available, e.g. cerebral spinal fluid and tear.
Supplementary Material
Acknowledgments
This research was supported by an Institutional Development Award (IDeA) from the National Institute of General Medical Sciences of the National Institutes of Health under Award Number P20GM103638-02 (MAJ) and by an Exploratory/Developmental Research Grant under award number R21NS077485 (MAJ) from the National Institute of Neurological Disorders and Stroke of the National Institutes of Health.
Footnotes
Electronic Supplementary Information (ESI) available: supplementary figures as indicated in the main text. See DOI: 10.1039/x0xx00000x
Notes and references
- 1.a) Uday B, Dipak D, Ranajit BK. Curr Sci. 1990;77:658–666. [Google Scholar]; b) Barnham KJ, Masters CL, Bush AI. Nat Rev Drug Discov. 2004;3:205–214. doi: 10.1038/nrd1330. [DOI] [PubMed] [Google Scholar]; c) Lin MT, Beal MF. Nature. 2006;443:787–795. doi: 10.1038/nature05292. [DOI] [PubMed] [Google Scholar]; d) Sena LA, Chandel NS. Molecular Cell. 2012;48:158–167. doi: 10.1016/j.molcel.2012.09.025. [DOI] [PMC free article] [PubMed] [Google Scholar]
- 2.Browne SE, Ferrante RJ, Beal MF. Brain Pathol. 1999;9:147–163. doi: 10.1111/j.1750-3639.1999.tb00216.x. [DOI] [PMC free article] [PubMed] [Google Scholar]
- 3.Barber SC, Mead RJ, Shaw PJ. BBA-Mol Basis Dis. 2006;1762:1051–1067. doi: 10.1016/j.bbadis.2006.03.008. [DOI] [PubMed] [Google Scholar]
- 4.Jenner P, Olanow CW. Neurology. 1996;47:161S–170S. doi: 10.1212/wnl.47.6_suppl_3.161s. [DOI] [PubMed] [Google Scholar]
- 5.a) Uttara B, Singh AV, Zamboni P, Mahajan RT. Curr Neuropharmacol. 2009;7:65–74. doi: 10.2174/157015909787602823. [DOI] [PMC free article] [PubMed] [Google Scholar]; b) Delanty N, Dichter MA. Arch Neurol. 2000;57:1265–1270. doi: 10.1001/archneur.57.9.1265. [DOI] [PubMed] [Google Scholar]
- 6.Segal AW. Annu Rev Immunol. 2005;23:197–223. doi: 10.1146/annurev.immunol.23.021704.115653. [DOI] [PMC free article] [PubMed] [Google Scholar]
- 7.Poljsak B, Šuput D, Milisav I. Oxid Med Cell Longev. 2013;2013:e956792. doi: 10.1155/2013/956792. [DOI] [PMC free article] [PubMed] [Google Scholar]
- 8.a) Martinez AW, Phillips ST, Whitesides GM, Carrilho E. Anal Chem. 2010;82:3–10. doi: 10.1021/ac9013989. [DOI] [PubMed] [Google Scholar]; b) Yetisen AK, Akram MS, Lowe CR. Lab Chip. 2013;13:2210–2251. doi: 10.1039/c3lc50169h. [DOI] [PubMed] [Google Scholar]; c) Hu J, Wang S, Wang L, Li F, Pingguan-Murphy B, Lu TJ, Xu F. Biosens Bioelectron. 2014;54:585–597. doi: 10.1016/j.bios.2013.10.075. [DOI] [PubMed] [Google Scholar]
- 9.Sechi D, Greer B, Johnson J, Hashemi N. Anal Chem. 2013;85:10733–10737. doi: 10.1021/ac4014868. [DOI] [PubMed] [Google Scholar]
- 10.Klasner SA, Price AK, Hoeman KW, Wilson RS, Bell KJ, Culbertson CT. Anal Bioanal Chem. 2010;397:1821–1829. doi: 10.1007/s00216-010-3718-4. [DOI] [PubMed] [Google Scholar]
- 11.a) Khan MS, Thouas G, Shen W, Whyte G, Garnier G. Anal Chem. 2010;82:4158–4164. doi: 10.1021/ac100341n. [DOI] [PubMed] [Google Scholar]; b) Yang X, Forouzan O, Brown TP, Shevkoplyas SS. Lab Chip. 2011;12:274–280. doi: 10.1039/c1lc20803a. [DOI] [PubMed] [Google Scholar]; c) Vella SJ, Beattie P, Cademartiri R, Laromaine A, Martinez AW, Phillips ST, Mirica KA, Whitesides GM. Anal Chem. 2012;84:2883–2891. doi: 10.1021/ac203434x. [DOI] [PMC free article] [PubMed] [Google Scholar]; d) Songjaroen T, Dungchai W, Chailapakul O, Henry CS, Laiwattanapaisal W. Lab Chip. 2012;12:3392–3398. doi: 10.1039/c2lc21299d. [DOI] [PubMed] [Google Scholar]; e) Li H, Han D, Pauletti GM, Steckl AJ. Lab Chip. 2014;14:4035–4041. doi: 10.1039/c4lc00716f. [DOI] [PubMed] [Google Scholar]; f) Novell M, Guinovart T, Blondeau P, Rius FX, Andrade FJ. Lab Chip. 2014;14:1308–1314. doi: 10.1039/c3lc51098k. [DOI] [PubMed] [Google Scholar]
- 12.a) Govindarajan AV, Ramachandran S, Vigil GD, Yager P, Böhringer KF. Lab Chip. 2011;12:174–181. doi: 10.1039/c1lc20622b. [DOI] [PubMed] [Google Scholar]; b) Moghadam BY, Connelly KT, Posner JD. Anal Chem. 2014;86:5829–5837. doi: 10.1021/ac500780w. [DOI] [PubMed] [Google Scholar]; c) Fronczek CF, Park TS, Harshman DK, Nicolini AM, Yoon JY. RSC Adv. 2014;4:11103–11110. [Google Scholar]
- 13.Wong AP, Gupta M, Shevkoplyas SS, Whitesides GM. Lab Chip. 2008;8:2032–2037. doi: 10.1039/b809830c. [DOI] [PubMed] [Google Scholar]
- 14.Sun M, Khan ZS, Vanapalli SA. Lab Chip. 2012;12:5225–5230. doi: 10.1039/c2lc40544j. [DOI] [PubMed] [Google Scholar]
- 15.a) Ravgiala RR, Weisburd S, Sleeper R, Martinez A, Rozkiewicz D, Whitesides GM, Hollar KA. J Chem Educ. 2013;91:107–111. [Google Scholar]; b) Mu X, Zhang L, Chang S, Cui W, Zheng Z. Anal Chem. 2014;86:5338–5344. doi: 10.1021/ac500247f. [DOI] [PubMed] [Google Scholar]
- 16.a) OraQuick® HCV Rapid Antibody Test. OraSure Technologies, Inc; USA: [Google Scholar]; b) HCV Strips. Fortress Diagnostics Limited; UK: [Google Scholar]
- 17.Miller NJ, Rice-Evans C, Davies MJ, Gopinathan V, Milner A. Clin Sci. 1993;84:407–412. doi: 10.1042/cs0840407. [DOI] [PubMed] [Google Scholar]
- 18.a) Ortiz AN, Kurth BJ, Osterhaus GL, Johnson MA. J Neurochem. 2010;112:755–761. doi: 10.1111/j.1471-4159.2009.06501.x. [DOI] [PMC free article] [PubMed] [Google Scholar]; b) Ortiz AN, Kurth BJ, Osterhaus GL, Johnson MA. Neurosci Lett. 2011;492:11–14. doi: 10.1016/j.neulet.2011.01.036. [DOI] [PMC free article] [PubMed] [Google Scholar]
- 19.Shea TB, Rogers E, Ashline D, Ortiz D, Sheu M-S. J Neurosci Meth. 2003;125:55–58. doi: 10.1016/s0165-0270(03)00028-1. [DOI] [PubMed] [Google Scholar]
- 20.a) Choo YS, Mao Z, Johnson GVW, Lesort M. Neurosci Lett. 2005;386:63–68. doi: 10.1016/j.neulet.2005.05.065. [DOI] [PubMed] [Google Scholar]; b) Tkac I, Dubinsky JM, Keene CD, Gruetter R, Low WC. J Neurochem. 2007;100:1397–1406. doi: 10.1111/j.1471-4159.2006.04323.x. [DOI] [PMC free article] [PubMed] [Google Scholar]
Associated Data
This section collects any data citations, data availability statements, or supplementary materials included in this article.


