

Abstract
Astrocytes can both sense and shape the evolution of neuronal network activity and are known to possess unique ion regulatory mechanisms. Here we explore the relationship between astrocytic intracellular pH dynamics and the synchronous network activity that occurs during seizure-like activity. By combining confocal and two-photon imaging of genetically encoded pH reporters with simultaneous electrophysiological recordings, we perform pH measurements in defined cell populations and relate these to ongoing network activity. This approach reveals marked differences in the intracellular pH dynamics between hippocampal astrocytes and neighboring pyramidal neurons in rodent in vitro models of epilepsy. With three different genetically encoded pH reporters, astrocytes are observed to alkalinize during epileptiform activity, whereas neurons are observed to acidify. In addition to the direction of pH change, the kinetics of epileptiform-associated intracellular pH transients are found to differ between the two cell types, with astrocytes displaying significantly more rapid changes in pH. The astrocytic alkalinization is shown to be highly correlated with astrocytic membrane potential changes during seizure-like events and mediated by an electrogenic Na+/HCO3− cotransporter. Finally, comparisons across different cell-pair combinations reveal that astrocytic pH dynamics are more closely related to network activity than are neuronal pH dynamics. This work demonstrates that astrocytes exhibit distinct pH dynamics during periods of epileptiform activity, which has relevance to multiple processes including neurometabolic coupling and the control of network excitability.
SIGNIFICANCE STATEMENT Dynamic changes in intracellular ion concentrations are central to the initiation and progression of epileptic seizures. However, it is not known how changes in intracellular H+ concentration (ie, pH) differ between different cell types during seizures. Using recently developed pH-sensitive proteins, we demonstrate that astrocytes undergo rapid alkalinization during periods of seizure-like activity, which is in stark contrast to the acidification that occurs in neighboring neurons. Rapid astrocytic pH changes are highly temporally correlated with seizure activity, are mediated by an electrogenic Na+/HCO3− cotransporter, and are more tightly coupled to network activity than are neuronal pH changes. As pH has profound effects on signaling in the nervous system, this work has implications for our understanding of seizure dynamics.
Keywords: astrocytes, epileptiform activity, intracellular pH, seizures
Introduction
Astrocytes are deeply interwoven into the fabric of neuronal circuits, where they play active roles in modulating the function and computation of networks (Araque et al., 1999). One of the primary mechanisms that astrocytes contribute to is ion homeostasis, which is essential for chemical and electrical signaling in the brain (Walz, 2000). In addition, astrocytes are known to continually regulate the delivery of energy substrates to neurons (Pellerin and Magistretti, 1994; Bittner et al., 2011; Choi et al., 2012). These processes become particularly important during periods of intense neural activity, such as occur in epileptic seizures. Seizure activity represents a significant challenge to ion homeostasis and can result in pronounced changes in intracellular and extracellular ion concentrations, which are also associated with an increase in the tissue's metabolic demands (Dreier and Heinemann, 1991; Howarth et al., 2012; Raimondo et al., 2015). The central involvement of astrocytes in these processes is highlighted by evidence that altered potassium handling by astrocytes can be pro-epileptic (Hinterkeuser et al., 2000; Wallraff et al., 2006; Bedner et al., 2015) and that calcium elevations in astrocytes sustain seizure-like activity (Gómez-Gonzalo et al., 2010).
Changes in pH, the negative logarithm of H+ ion concentration, have also been associated with seizure activity. Neurons for instance, have been shown to experience intracellular acidification (Xiong et al., 2000; Raimondo et al., 2012), which is likely to feedback into ongoing seizure activity because neuronal excitability, synaptic transmission and the availability of energy substrates are all known to exhibit pH sensitivity (Traynelis and Cull-Candy, 1990; Taira et al., 1993; Erecińska et al., 1995). Meanwhile, although astrocytic pH dynamics during seizure activity have received less attention, it is well established that pH regulation mechanisms differ in glial cells. In response to sustained membrane depolarization for example, astrocytes exhibit intracellular alkalinization as opposed to acidification (Ahmed and Connor, 1980; Boyarsky et al., 1988a; Chesler and Kraig, 1989; Deitmer and Szatkowski, 1990). This is consistent with evidence that astrocytes exhibit distinct pH regulatory mechanisms compared with neurons, including electrogenic transport mechanisms that provide a direct link between membrane depolarization and bicarbonate/proton fluxes, particularly via the action of the electrogenic sodium-bicarbonate cotransporter NBCe1 (Boyarsky et al., 1993; Brookes and Turner, 1994; Pappas and Ransom, 1994; Bevensee et al., 1997; Ruminot et al., 2011; Theparambil et al., 2014).
A prediction therefore is that astrocytes experience alkaline shifts during epileptiform activity and that the kinetics of the pH dynamics in astrocytes may be different to those in neurons. Previous work has used ion-sensitive electrodes and dyes to monitor pH dynamics in astrocytes (Chesler and Kraig, 1989; Theparambil et al., 2014). The recent development of genetically encoded reporters now provides a series of different pH-sensitive proteins that can be delivered to cell types within intact brain preparations. These tools make it possible to monitor pH in distinct cell types, either by using molecular, morphological, and/or functional features to classify individual cells at the time of recording (Benediktsson et al., 2005; Bizzarri et al., 2009). In this study, we combine genetically encoded pH reporters with simultaneous whole-cell patch-clamp recordings to observe cell-type-specific pH responses during seizure-like events (SLEs) in vitro. By measuring pH dynamics in astrocytes across different models of epilepsy, we demonstrate that astrocytes exhibit pronounced intracellular alkaline pH shifts during epileptiform activity. Furthermore, we show that the kinetics of the pH dynamics differ significantly across cell types and that astrocytic pH changes are actually more tightly coupled to the network activity than are the pH changes in neurons.
Materials and Methods
Slice preparation and DNA transfection.
Rat organotypic hippocampal slice cultures were prepared using a method similar to that described by Stoppini et al. (1991). Briefly, 7-d-old male Wistar rats were killed in accordance with the UK Animals Scientific Procedures Act 1986. The brains were extracted and placed in cold (4°C) Geys balanced salt solution (GBSS), supplemented with d-glucose (34.7 mm). All reagents were purchased from Sigma-Aldrich, unless stated otherwise. The hemispheres were separated and individual hippocampi were removed and immediately sectioned into 350-μm-thick slices on a McIlwain tissue chopper. Slices were rinsed in cold dissection medium, placed onto Millicell-CM membranes and maintained in culture medium containing 25% EBSS, 50% MEM, 25% heat-inactivated horse serum, glucose, and B27 (Invitrogen). Slices were incubated at 36°C in a 5% CO2 humidified incubator before transfection. Neurons were biolistically transfected after 4–7 d in vitro using a Helios Gene Gun (120 psi; Bio-Rad). The target DNA was either E2GFP as part of pcDNA3-ClopHensor (generously provided by Daniele Arosio, University of Trento, Trento, Italy; Addgene, plasmid 25938) or ClopHensorN (Raimondo et al., 2013; Addgene, plasmid 50758), deGFP4 in pEGFP-N1 (generously provided by Jim Remington, University of Oregon, Eugene, OR), or Cl-sensor in pEGFP-C1 (generously provided by Piotr Bregestovski, INMED, Marseille, France). Fifty micrograms of target DNA was precipitated onto 25 mg of 1.6 μm diameter gold microcarriers and bullets generated in accordance with the manufacturer's instructions (Bio-Rad). This resulted in sparse transfection rates (typically <10 cells per slice) and recordings were performed 2–7 d post-transfection. At the time of recording therefore, transfected cells were comparable to postnatal days 13–21.
Electrophysiological recordings and activity-dependent manipulations.
Organotypic hippocampal slices were transferred to a recording chamber and continuously superfused with 95% O2/5% CO2 oxygenated ACSF, warmed to 32–35°C. The composition of the “standard” ACSF was as follows (in mm): 120 NaCl, 3 KCl, 2 MgCl2, 2 CaCl2, 1.2 NaH2PO4, 23 NaHCO3, and 11 d-glucose. The pH was adjusted to be between 7.35 and 7.40 using NaOH. SLEs occurred following the exchange of normal ACSF to nominally Mg2+-free ACSF (Anderson et al., 1986; Mg2+ omitted from standard ACSF) or nominally Cl−-free ACSF (Yamamoto and Kawai, 1967; NaCl, MgCl2, and CaCl2 of standard ACSF replaced with 120 mm sodium d-gluconate, 1 mm MgSO4 and 3 mm calcium d-gluconate, respectively). In some experiments, HCO3− was removed from the Cl−-free ACSF by substituting NaHCO3 with an equimolar concentration of HEPES, and oxygenating with 100% O2. As it is difficult to completely remove HCO3−, due to the fact that CO2 is continuously generated and rapidly converted to HCO3− by carbonic anhydrases, we refer to this as a low HCO3− ACSF. Brain slices were maintained in the relevant SLE-inducing ACSF (ie, 0 Mg2+ or 0 Cl−) before pH imaging began. Patch pipettes of 3–5 MΩ tip resistance were pulled from filamental borosilicate glass capillaries (1.2 mm outer diameter, 0.69 mm inner diameter; Harvard Apparatus), using a horizontal puller (Sutter P-97 or P-1000). For whole-cell recordings, pipettes were filled with an internal solution containing the following (in mm):126 K-gluconate, 4 Na2ATP, 0.3 NaGTP, 10 Na2-phosphocreatine, 4 KCl, and 10 HEPES. The osmolarity of internal solutions was adjusted to 290 mOsM and the pH was adjusted to 7.38 with KOH. Pyramidal neurons or astrocytes within the CA1 and CA3 regions were visualized under 40× or 60× water-immersion objectives (Leica or Olympus) and targeted for recording. Patch-clamp recordings were made using Axopatch 1D, Axopatch 200B, or Axoclamp 2B amplifiers (Molecular Devices). Data were acquired with WinWCP Strathclyde Whole Cell Analysis software (v3.9.7; University of Strathclyde) or PulseQ running on IGOR (Funetics), before being exported to the MATLAB environment (MathWorks) for further analysis using customized scripts.
Imaging and calibrating intracellular pH measurements.
Concurrent with electrophysiological recordings, the intracellular pH of a transfected CA1/CA3 pyramidal neuron and/or astrocyte was measured using the following imaging techniques. For E2GFP-expressing cells, imaging was performed using an upright Leica SP2 AOBS laser scanning confocal microscope equipped with a 40× water-immersion objective (NA 0.8). Sequential excitation of E2GFP at 458 and 488 nm was achieved with a multiline argon laser. Emitted fluorescence was detected between 500 and 550 nm using a single photomultiplier tube (PMT) at a constant voltage. To compensate for fluctuations in laser intensity, a custom built laser power sensor (sample rate 10 kHz) was used to record laser power output during imaging (Zucker and Price, 2001; Arosio et al., 2010) and the resulting data were used to correct fluorescence ratios offline. For deGFP4 and Cl-sensor-expressing neurons, imaging was performed using an Olympus FV300 confocal microscope (Olympus), custom-converted for two-photon imaging and equipped with a MaiTai-HP Ti:sapphire femtosecond pulsed laser (Newport Spectra-Physics). Images were acquired on a PC using Fluoview software (v5.0, Olympus). The two-photon system was mounted on an Olympus BX51 upright microscope equipped with a 40× water-immersion objective (NA 0.80). Fluorescence was detected using two externally mounted PMTs (R3896, Hamamatsu). An excitation wavelength of 810 or 850 nm was used for deGFP4 or Cl-sensor, respectively. Emitted fluorescence from deGFP4 was separated using a dichroic mirror at 495 nm and filtered for detection by the two PMTs at 450–490 nm and 500–550 nm. Emitted fluorescence from Cl-sensor was separated using a dichroic mirror at 510 nm before being filtered for detection at 460–500 nm and 520–550 nm. Images were exported to the MATLAB environment where background was subtracted and fluorescence measurements were made from regions of interest selected over the soma of individual cells. Excitation or emission fluorescence ratios (RpH) were converted to pH according to calibration curves collected for each construct.
For the calibration, intracellular pH was controlled by equilibrating extra- and intracellular ion concentrations using the K+/H+ exchanger nigericin (10 μm) and the Cl−/OH− exchanger tributyltinchloride in a high K+ ACSF containing the following (in mm): 123 potassium d-gluconate, 23 HEPES, 11 d-glucose, 1.2 NaH2PO4, 2 MgSO4, and 2 calcium d-gluconate (Boyarsky et al., 1988a). pH was adjusted with small aliquots of NaOH and, to avoid CO2-dependent pH buffering, ACSF was bubbled with 100% O2. For each indicator, either an excitation (E2GFP) or emission (deGFP4, Cl-sensor) fluorescence ratio (R) was measured at different intracellular pHs:
 |
Where SN and SD were the numerator and denominator of the calculated fluorescence ratio, respectively. The formation of a 1:1 analyte–sensor complex results in an equilibrium described by the Grynkiewicz equation (Grynkiewicz et al., 1985; Arosio et al., 2010), which can be written as follows:
 |
RA and RB are the values of R for the ratiometric indicator in its most acidic and basic forms, respectively. Likewise, SD,A and SD,B reflect SD in its acidic and basic form. pKa is the acid dissociation constant of the indicator. Calibration data were fitted using the following rearranged version of the above equation:
 |
This allowed the pKa of each construct to be determined and intracellular pH to be calculated from measured fluorescence ratios (R) during subsequent experiments. Calibration curves were constructed from fluorescence measurements that were averaged over a population of “pH-clamped” cells. As with other ratiometric reporters, this means that there is an inherent variance when pH values are assigned to individual cells, but that relative changes in pH (ie, within-cell changes) are not affected by this source of variance. Some of the data generated for the calibration of the genetic reporters was used in a previous study (Raimondo et al., 2012).
For pH imaging, astrocytes were identified by their morphology and location (within stratum radiatum). Two broad morphological groups were observed, the first included cells with small somata and multiple fine processes (protoplasmic astrocytes). The second group included multipolar cells with irregularly shaped, elongated somata, with more than two large processes emanating in different directions (fibrous astrocytes). These two groups are consistent with a detailed description of the morphologies observed for GFAP-positive astrocytes in the hippocampus (Benediktsson et al., 2005). To further confirm the accuracy of the identification of astrocytes using morphological criteria, a subset of our cells were targeted for whole-cell patch recording. In all cases (n = 9 of 9 cells), a low resting membrane potential (−75 ± 8.6 mV), low membrane resistance (32.5 ± 1.9 MΩ) and the inability to fire action potentials was confirmed, consistent with previous data (O'Connor et al., 1994; McKhann et al., 1997). These electrophysiological properties were consistent with our morphological classification of the cells as astrocytes.
Data analysis and statistics.
All data are presented as means ± SEM. Statistical tests were either performed using the Statistics toolbox in MATLAB or GraphPad Prism v5.0 (GraphPad Software; *p < 0.05, **p < 0.01, ***p < 0.0001). Data were tested for normality using a Kolmogorov–Smirnov test and the appropriate statistical tests were applied. To assess the degree of correlation between current-clamp recordings and pH imaging traces, the membrane potential recordings were resampled to match the sampling rate of the pH imaging.
Results
Astrocytes experience rapid intracellular alkalinization during SLEs
To compare pH dynamics in astrocytes and neurons during epileptiform network activity we delivered the genetically encoded pH sensor, E2GFP, to the different cell types within the same hippocampal slice (Fig. 1a,b). Using biolistic transfection methods we were able to sparsely transfect cells within organotypic hippocampal slice cultures. This meant that E2GFP-exressing CA1/CA3 pyramidal neurons and astrocytes could be easily distinguished by their distinctive morphology and location (Benediktsson et al., 2005; see Materials and Methods). To confirm the accuracy of the identification of astrocytes from morphological criteria, a subset of cells were also targeted for whole-cell patch-clamp recordings and characterized electrophysiologically. In all cases (n = 9 of 9 cells), a low resting membrane potential (−75 ± 8.6 mV), low membrane resistance (32.5 ± 1.9 MΩ) and inability to fire action potentials was confirmed (Fig. 1c). Concurrent with pH imaging, SLEs elicited by Mg2+ free ACSF were monitored via whole-cell patch-clamp recordings from CA1/CA3 pyramidal neurons. These electrophysiological measurements were made from a nearby pyramidal neuron (somata within 200 μm) so as to avoid disrupting pH regulatory mechanisms in the imaged cell (Fig. 1a,b). Interestingly, the pHi before the onset of SLEs was found to be significantly different between neurons and astrocytes. The pre-SLE pHi in neurons was relatively more alkaline at 7.69 ± 0.30 (n = 23), whereas the pre-SLE pHi was relatively more acidic in astrocytes at 7.28 ± 0.32 (n = 22; p < 0.0001, t test; Fig. 1d). The two cell types also differed substantially in their pH dynamics during epileptiform activity. SLEs resulted in a highly significant intracellular acidic shift in neurons (p < 0.0001, t test, n = 101 events from 23 neurons; Fig. 1a). In stark contrast to neurons, astrocytes exhibited strong and rapid intracellular alkalinization during periods of epileptiform activity (p < 0.0001, t test, n = 112 events from 24 astrocytes; Fig. 1b,c,e). Even short synchronous network events caused detectable shifts in intracellular pH (Fig. 1a,b,e). For instance, events lasting 1–3 s caused a peak decrease of 0.016 ± 0.01 pH units in neurons (p = 0.0002, t test) and a peak increase of 0.047 ± 0.04 pH units in astrocytes (p = 0.0012, t test). Furthermore, the magnitude of intracellular pH changes was well correlated with the length of the recorded SLE (r = −0.67 for neurons and r = 0.58 for astrocytes, p < 0.0001, Pearson Correlation; Fig. 1e). The slope of the linear fit for peak change in intracellular pH in neurons revealed a decrease of 0.007 pH units per second of epileptiform activity. For astrocytes, the peak change in intracellular pH as a function of SLE duration was best fit by a single phase exponential with a plateau of 0.18 pH units and a time constant 14.7 s (Fig. 1e).
Figure 1.
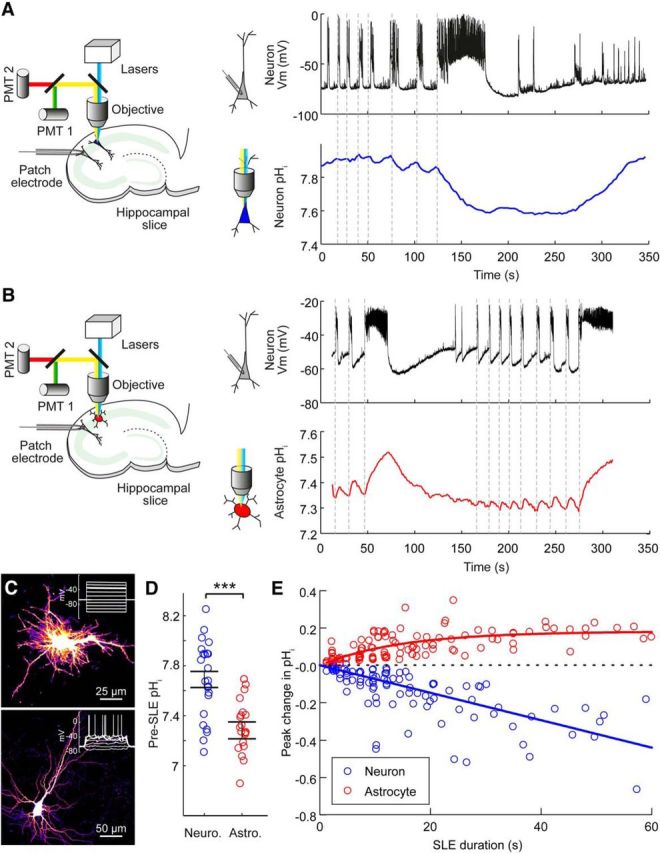
Astrocytes experience rapid intracellular alkalinization during epileptiform activity. A, Schematic (left) showing the experimental setup in which a hippocampal pyramidal neuron expressing a genetically encoded pH reporter was imaged, while a simultaneous patch-clamp recording was performed from a neighboring neuron. Dynamic intracellular pH measurements from a representative CA3 pyramidal neuron expressing E2GFP (right, blue trace) and current-clamp recording from a neighboring pyramidal neuron (black trace; somata <200 μm apart), which provided a readout of the epileptiform activity in Mg2+-free ACSF. Acidic intracellular pH shifts were closely associated with SLEs (onset indicated by vertical dashed lines). B, Schematic (left) showing a similar setup as in A for the measurement of pH dynamics in hippocampal astrocytes during SLEs. Intracellular pH measurements made from a representative astrocyte expressing E2GFP (right, red trace, same astrocyte as in C) and current-clamp recording from a neighboring pyramidal neuron (black trace), which provided a readout of the epileptiform activity in Mg2+-free ACSF. Individual SLEs of different durations are closely associated with rapid intracellular alkaline transients in the astrocyte. C, Confocal image (top) of an astrocyte expressing E2GFP. After performing pH imaging (shown in B), this astrocyte was targeted for whole-cell patch-clamp recording and confirmed to exhibit a low membrane resistance (Rm = 20.5 MΩ) and lack voltage-gated conductances in response to current injection (inset). Confocal image (bottom) of a neuron expressing E2GFP, which exhibited action potentials in response to current injection (inset). D, Population data demonstrating a significant difference in pre-SLE intracellular pH between hippocampal neurons and astrocytes. ***p < 0.0001, t test. E, Population data showing the peak shift in intracellular pH as a function of the duration of the epileptiform activity (data from 23 neurons, blue, and 24 astrocytes, red). For neurons, the peak change in pH was negatively correlated with the duration of the SLE (r = −0.6719, p < 0.0001, Pearson correlation). For astrocytes, the peak pH shift was positively correlated with the length of the SLE (r = 0.5766, p < 0.0001, Pearson correlation).
Different genetically encoded pH sensors confirm astrocytic alkalinization during different models of epileptic seizures
To confirm our observation of epileptiform activity-induced alkaline transients in astrocytes, we used three different genetically encoded pH-sensitive probes and two separate in vitro models of epileptic seizures (Figs. 2, 3). The reporters E2GFP, deGFP4 and Cl-sensor were calibrated by systematically varying extracellular pH in the presence of a proton-permeable ionophore to achieve known intracellular pH values (see Materials and Methods). E2GFP was used as a ratiometric pH indicator by excitation, whereas deGFP4 and Cl-sensor were used as ratiometric pH indicators by emission (see Materials and Methods). The fluorescence ratios were shown to depend on intracellular pH with a pKa of 7.6 for E2GFP, 7.4 for deGFP4 and 7.7 for Cl-sensor (Fig. 2a–c). Both E2GFP and deGFP4 demonstrated reliable astrocytic alkaline transients in response to 0 Mg2+-induced SLEs (Figs. 1b, 2d). In addition, epileptiform activity could also be elicited by removing Cl− from the ACSF, which has been established as a model of epileptic seizures (Yamamoto, 1972). Removal of Cl− from the ACSF has the added advantage of preventing potential Cl− fluxes that would complicate pH measurements from the pH and Cl−-sensitive genetic reporter Cl-sensor (Markova et al., 2008; Raimondo et al., 2012). Intracellular pH measurements made using both E2GFP and Cl-sensor in nominally Cl− free ACSF also revealed alkalinization in response to SLEs (Fig. 2e,f).
Figure 2.

Multiple genetically encoded pH sensors reveal astrocytic alkalinization during epileptiform activity. A, Calibration curve relating the fluorescence ratio of DeGFP4-expressing cells to their intracellular pH. This revealed the reporter to have a pKa of 7.4. Similarly, calibration of E2GFP (B) and Cl-sensor (C) revealed a pKa of 7.5 and 7.7 for these genetically encoded pH sensors, respectively. D, An astrocyte expressing the pH sensor DeGFP4 was imaged for pH (red trace), while 0 Mg2+ induced epileptiform activity was monitored via a simultaneous current-clamp recording from a nearby pyramidal neuron (black trace). Epileptiform activity was associated with a pronounced increase in the astrocyte's pH. E, pH imaging from an astrocyte expressing the pH sensor E2GFP revealed intracellular alkalinization (red trace) during periods of epileptiform activity induced with 0 Cl− ACSF (black trace). F, pH imaging from an astrocyte expressing the pH-sensitive Cl-sensor also reveals intracellular alkalinization (red trace) during periods of epileptiform activity induced with 0 Cl− ACSF (black trace).
Figure 3.
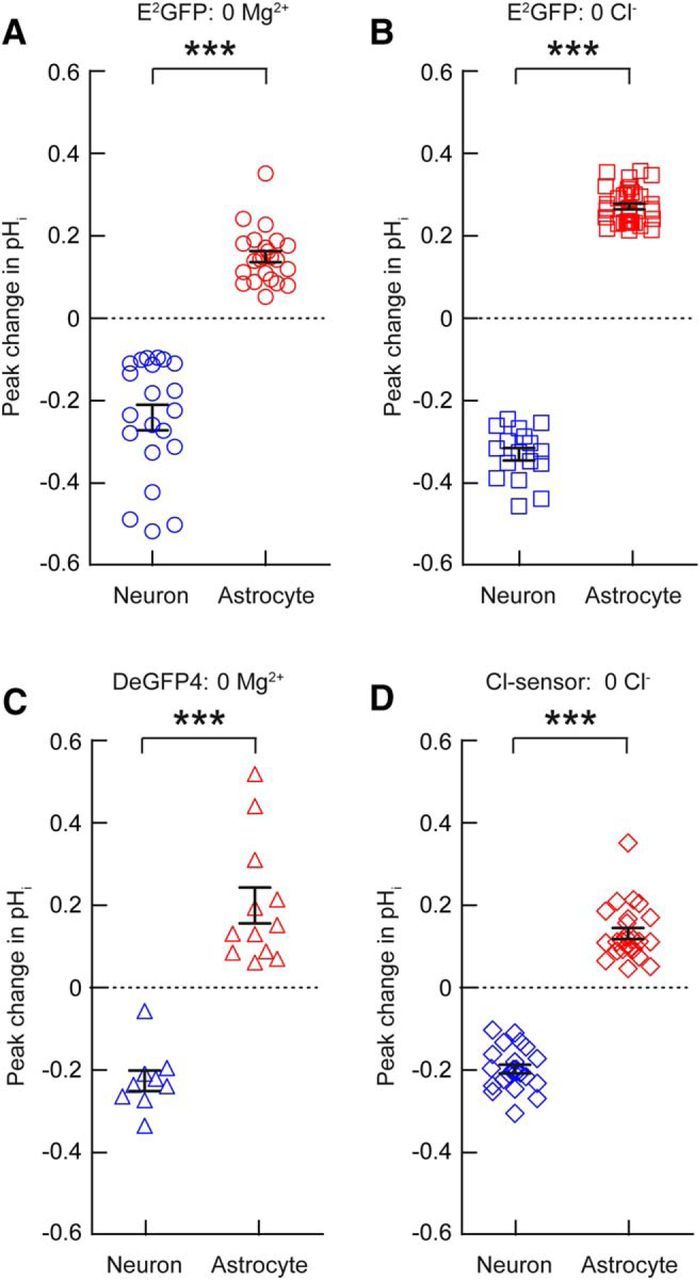
Cell-type-specific changes in pH during epileptiform activity. A, Astrocytes (red) and neurons (blue) imaged with the pH sensor E2GFP, showed opposing pH transients during 0 Mg2+ induced SLEs (20–40 s duration). Neurons exhibited transient acidic shifts, whereas astrocytes exhibited transient alkaline shifts during periods of epileptiform activity. Similar differences were observed when intracellular pH was imaged with E2GFP during 0 Cl−-induced SLEs (B), or DeGFP4 during 0 Mg2+-induced SLEs (C), or Cl-sensor during 0 Cl−-induced SLEs (D). ***p < 0.0001, t test.
At a population level, when we compared peak changes in intracellular pH during SLEs (20–40 s in duration), we observed a highly significant difference between neurons and astrocytes for each pH reporter or seizure model (E2GFP 0 Mg2+: −0.24 ± 0.03 pH unit shift in neurons vs 0.15 ± 0.01 pH unit shift in astrocytes, p < 0.0001, E2GFP 0 Cl−: −0.33 ± 0.02 vs 0.27 ± 0.01 pH units, p < 0.0001, DeGFP4 0 Mg2+: −0.23 ± 0.03 vs 0.20 ± 0.04 pH units, p < 0.0001, Cl-sensor 0 Cl−: −0.19 ± 0.01 vs 0.13 ± 0.01 pH units, p < 0.0001, t test; Fig. 3a–d). These experiments confirm that genetically encoded pH reporters are able to detect robust intracellular acidification of hippocampal neurons and intracellular alkalinization of hippocampal astrocytes during epileptiform activity.
Epileptiform activity-induced alkaline transients in astrocytes are mediated by depolarization and the sodium-bicarbonate cotransporter NBCe1
Given the presence of markedly different activity-dependent pH dynamics in astrocytes compared with neurons, we sought to explore in further detail how SLEs relate to the observed pH transients in astrocytes. First, we performed dual whole-cell current-clamp recordings to confirm that 0 Mg2+ ACSF elicits SLEs that constitute synchronous, highly correlated periods of activity between principal hippocampal neurons. Consistent with previous findings (Ellender et al., 2014), we observed a high mean linear correlation in the membrane potential of pairs of pyramidal neurons during SLEs (r = 0.91 ± 0.01, n = 20 SLEs from seven pairs of neurons, Pearson correlation; Fig. 4a,c). Next, we examined how the membrane potential of astrocytes relates to the epileptiform network activity. To do this we performed simultaneous current-clamp recordings from a pyramidal neuron and a nearby astrocyte (somata within 200 μm). The identity of the astrocyte was again confirmed by their hyperpolarized resting membrane potential (−77.4 ± 1.5 mV), low-input resistance (80.9 ± 42.7 MΩ) and lack of voltage-gated conductances, consistent with previous reports (O'Connor et al., 1994; McKhann et al., 1997). In comparison, recorded neurons were able to generate action potentials and had a resting membrane potential of −60.3 ± 2.1 mV and an input resistance of 201.7 ± 39.8 MΩ. During epileptiform activity we observed that although the range of membrane potential values was narrower for the astrocyte, the seizure-associated membrane depolarizations occurred synchronously in astrocytes and pyramidal neurons (Fig. 4b). As a result, the astrocytic membrane potential was also observed to be highly correlated with the pyramidal neuron membrane potential during SLEs (r = 0.80 ± 0.02, n = 14 SLEs from 9 pairs of cells, Pearson correlation; Fig. 4c).
Figure 4.

Alkaline transients in astrocytes during epileptiform activity are mediated by depolarization and the sodium-bicarbonate cotransporter NBCe1. A, Dual whole-cell current-clamp recording from a pair of CA3 pyramidal neurons (somata <200 μm apart) during 0 Mg2+-induced epileptiform activity. Dashed line indicates onset of a SLE. The membrane potential of the two neurons was highly synchronous, as indicated by the tight correlation in the cells' membrane potentials (r = 0.92, Pearson correlation). Action potential generation in response to somatic current injection (insets) confirmed both cells were neuronal. B, Dual whole-cell current-clamp recording from a pyramidal neuron (black trace) and a nearby astrocyte (red trace; somata <200 μm apart). Note that the astrocytic membrane potential depolarization during the SLE is tightly correlated with neuronal membrane potential (r = 0.82, Pearson correlation). Response to somatic current injection confirmed the identity of the cells (insets). C, Population data revealed a high correlation in the membrane potential between pyramidal neurons (r = 0.91 ± 0.01, Pearson correlation), and between pyramidal neurons and astrocytes (r = 0.80 ± 0.02, Pearson correlation) during SLEs. D, Under control conditions intracellular pH imaging with E2GFP (red trace) revealed transient alkalinizations that were associated with 0 Mg2+-induced epileptiform activity, as monitored from a nearby pyramidal neuron (black trace). E, Bath application of the selective Na+/HCO3− cotransporter blocker S0859 (50 μm) to the same cells as in D, resulted in a marked attenuation of the astrocytic alkalinizations. F, Population data demonstrate that S0859 blocks the astrocytic alkalinizations and eliminates the correlation between SLE duration and the size of the alkaline shift (r = 0.4289, p = 0.08 vs r = 0.69, p < 0.0001, Pearson correlation). G, For SLEs of comparable duration (<35 s duration), S0859 significantly reduced the peak change in astrocytic pHi associated with 0 Mg2+-induced SLEs (left) and 0 Cl−-induced SLEs (center). Low HCO3− ACSF also reduced SLE-associated astrocytic alkaline shifts in 0 Cl− ACSF (right). *p < 0.05, **p < 0.01, ***p < 0.0001, t test.
These epileptiform-induced depolarizations of the astrocyte membrane potential would be predicted to generate alkalinization via the electrogenic sodium-bicarbonate cotransporter NBCe1, and could therefore account for the alkaline shifts observed with our pH reporters (Bevensee et al., 1997; Majumdar and Bevensee, 2010). To test this, we examined whether astrocytic alkalinization during SLEs was sensitive to S0859, an N-cyanosulphonamide inhibitor of sodium-bicarbonate cotransport (Ch'en et al., 2008; Ruminot et al., 2011). Bath application of 50 μm S0859 did not affect the intracellular pH of astrocytes measured before SLE onset. The pre-SLE pH was 7.29 ± 0.034 in control astrocytes and the pre-SLE was 7.30 ± 0.04 in S0859-treated astrocytes (p = 0.79, t test). However, S0859 markedly reduced SLE-associated alkaline transients in astrocytes (Fig. 4d,e). In S0859-treated astrocytes, 0 Mg2+-induced SLEs resulted in an alkaline transient of just 0.02 ± 0.01 pH units, which was significantly smaller than the alkaline transient observed in control astrocytes of 0.13 ± 0.01 pH units (p < 0.0001, t test). Interestingly, S0859 was associated with a reduction in SLE duration (Fig. 4f), but the effect of S0859 on astrocytic alkalinization was still evident when we accounted for SLE duration. When SLEs of matched duration were compared (ie, SLEs of <35 s duration), S0859 significantly reduced astrocytic alkalinization from 0.11 ± 0.01 pH units under control conditions, to 0.02 ± 0.01 pH units in the presence of S0859 (p < 0.0001, t test; Fig. 4g). Similarly, S0859 significantly reduced astrocytic alkalinization for 0 Cl−-induced SLEs from 0.13 ± 0.01 pH units under control conditions, to 0.05 ± 0.03 pH units in the presence of S0859 (p < 0.01, t test; Fig. 4g). Finally, consistent with a bicarbonate-dependent process, the use of a low HCO3− ACSF also significantly reduced astrocytic alkalinization during SLEs from 0.13 ± 0.01 pH units in control ACSF, to 0.08 ± 0.02 pH units in reduced HCO3− ACSF (p < 0.05, t test; Fig. 4g). Together, these data support the conclusion that sodium-bicarbonate cotransport plays a central role in the generation of epileptiform activity-induced alkalinization in hippocampal astrocytes.
The kinetics of pH transients in astrocytes and neurons differ during epileptiform activity
Having established that astrocytes and neurons exhibit opposing pH changes during epileptiform activity, we were keen to examine whether the dynamics of these pH changes were comparable between the two cells types. To do this we performed simultaneous or sequential pH-imaging from neurons and astrocytes within the same hippocampal brain slice. In addition, we analyzed individually recorded intracellular pH dynamics from both cell types at a population level (Fig. 5). Simultaneous pH readout from these two cell types during the same SLEs was attained by rapid imaging of an astrocyte and the apical dendrite of a nearby pyramidal neuron (Fig. 5a,b). The examples in Figure 5c and Figure 5d depict sequential imaging of intracellular pH dynamics in both cell types in response to similar SLEs within the same hippocampal slice preparation. During epileptiform activity astrocytes were observed to alkalinize, while the neurons acidified (Fig. 5b–d). This was true for SLEs generated in 0 Mg2+ (Fig. 5c) or 0 Cl− (Fig. 5d). Importantly, these recordings allowed us to observe differences in the intracellular pH kinetics between the two cell types. Astrocytes were observed to reach their peak pH change significantly more quickly than neurons (Fig. 5b–d). During 0 Mg2+ SLEs, the peak pH shifts in astrocytes occurred at 71.3 ± 5.2% of SLE duration (n = 25), as compared with 134.5 ± 7.7% of SLE duration in neurons (n = 30; Fig. 5e; p < 0.0001, t test). This difference was similar in 0 Cl− events where astrocytic pH had shifted maximally by 62.4 ± 2.7% (n = 63) of SLE duration, compared with 111.4 ± 3.2% of SLE duration (n = 85) in neurons (Fig. 5e; p < 0.0001, t test). In summary, whereas astrocytes reach maximal alkalinity approximately halfway during the SLE, neurons continue to experience increases in pH and reach their most acidic values at, or shortly after, the cessation of the SLE.
Figure 5.
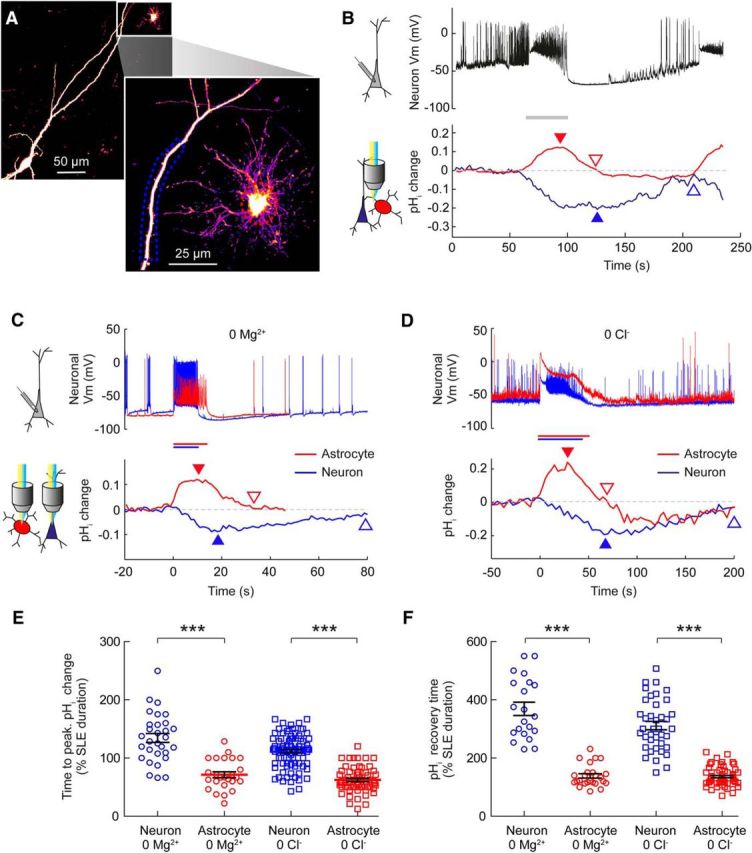
The kinetics of pH transients differ between astrocytes and neurons during epileptiform activity. A, A confocal image of a CA3 pyramidal neuron and neighboring astrocyte both expressing E2GFP. The expanded region shows a magnified view of the astrocyte and adjacent apical dendrite of the pyramidal neuron. Dashed boxes indicate regions of interest used for pH measurements. B, Current-clamp recording of a nearby neuron (somata <200 μm apart) provides a readout of 0 Mg2+-induced epileptiform activity (black trace). Simultaneous pH imaging from the regions of interest indicated by the dashed lines in A. The astrocyte (red) exhibited a transient increase in pH that was closely aligned with the SLE (gray bar), while the neuron (blue) exhibited a more prolonged decrease in pH. The arrowheads indicate the point of maximal pH shift (filled arrowheads) and the point at which pH recovered to baseline (empty arrowheads). C, Representative changes in intracellular pH during 0 Mg2+-induced epileptiform activity in an astrocyte (red traces) and a CA3 pyramidal neuron (blue traces) within the same hippocampal slice. The astrocyte exhibited a more rapid alkalinization, which peaked and then recovered more quickly than the more sustained acidification of the neuron. D, Similar differences in the kinetics of cell-specific pH shifts were observed when epileptiform activity was induced with 0 Cl− ACSF. E, Population data show that astrocytes reached their peak pH shift significantly faster than neurons in both 0 Mg2+ and 0 Cl−-induced epileptiform activity. F, The time for pH to recover to baseline was also significantly faster in astrocytes than neurons in both 0 Mg2+ and 0 Cl−-induced epileptiform activity. ***p < 0.0001, t test.
The kinetics of pH recovery following SLEs was also found to be more rapid in astrocytes (Fig. 5b–d). Astrocytes returned to baseline shortly after the end of a SLE (138.8 ± 7.5% of SLE duration in 0 Mg2+, n = 25; and 136.1 ± 4.0% of SLE duration in 0 Cl−, n = 62). In contrast, the intracellular pH of neurons took markedly longer to recover (369.0 ± 23.0% of SLE duration in 0 Mg2+, n = 21; and 311.5 ± 14.1% of SLE duration in 0 Cl−, n = 39). This difference was highly statistically significant for both of the seizure models (p < 0.0001, t test; Fig. 5e). Together, these data demonstrate that the kinetics of SLE-associated intracellular pH transients are very different between astrocytes and pyramidal neurons: epileptiform pH kinetics are faster in astrocytes and slower in neurons.
Activity-dependent astrocytic pH dynamics are most tightly coupled to epileptiform activity
These data suggest that pH dynamics in astrocytes are more closely aligned with epileptiform network activity than are pH dynamics in neurons. To address this directly we performed simultaneous electrophysiological recordings and intracellular pH measurements from different combinations of cell types (Fig. 6). This enabled us to quantify the correlation between the pH and the membrane potential of different cell types during epileptiform activity (Fig. 7a). Consistent with our observation that astrocytic alkalinization is mediated by the electrogenic cotransporter NBCe1 (Fig. 4), we observed a very high correlation between astrocytic pH and astrocytic membrane potential (r = 0.71 ± 0.02, n = 28; Figs. 6a, 7a). In fact, we observed that the correlation between astrocytic pH and neuronal membrane potential (r = 0.43 ± 0.04, n = 40) was significantly greater than the correlation between neuronal −pH and neuronal membrane potential (r = 0.15 ± 0.05, n = 44; p < 0.0001, t test; Figs. 6b,c, 7a).
Figure 6.
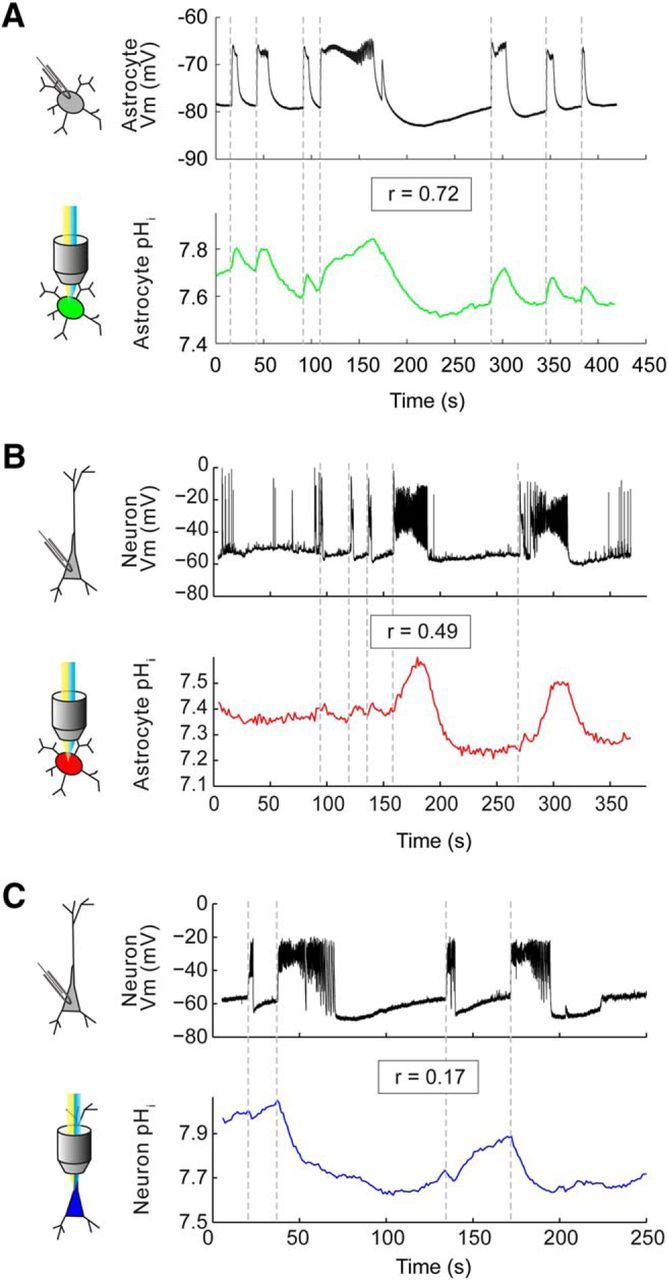
Simultaneous recordings from different cell-pair combinations reveal that astrocytic pH dynamics closely reflect both astrocytic and neuronal membrane potential dynamics. A, Paired pH imaging (green trace) and whole-cell patch-clamp recording (black trace) from a pair of astrocytes in stratum radiatum of CA3 revealed a close correlation between changes in astrocytic pH and changes in astrocytic membrane potential during epileptiform activity (r = 0.72, Pearson correlation). B, A similar experiment on an astrocyte–neuron pair also revealed a high degree of correlation between changes in astrocytic pH and neuronal membrane potential (r = 0.49, Pearson correlation). C, In contrast, a similar experiment on a neuron–neuron pair revealed a much lower correlation between the change in neuronal pH and the change in neuronal membrane potential (r = 0.17, Pearson correlation).
Figure 7.
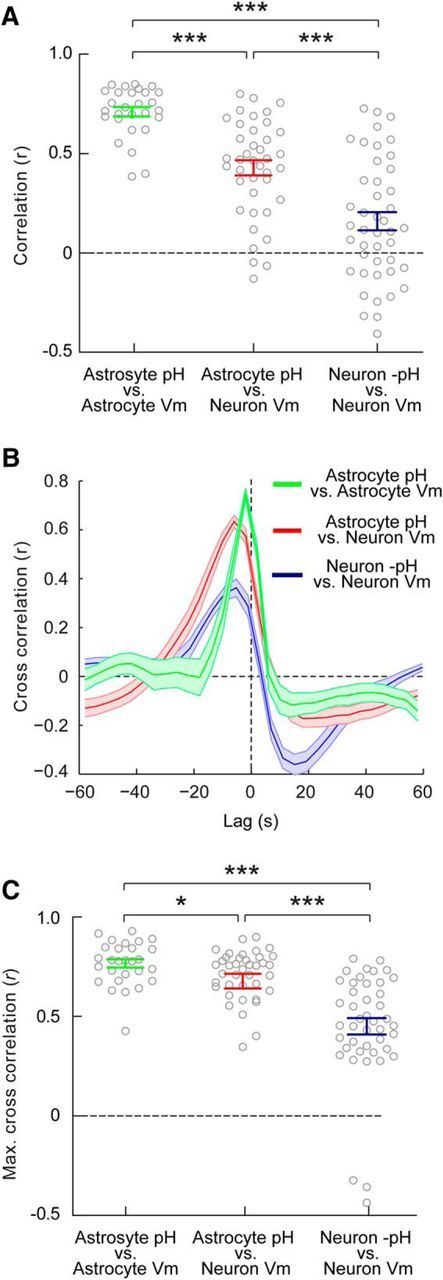
Astrocytic pH dynamics are more strongly coupled to network activity than neuronal pH dynamics. A, The absolute correlation between astrocytic pH and astrocytic membrane potential was highest (r = 0.71 ± 0.02), followed by the correlation between astrocytic pH and neuronal membrane potential (r = 0.43 ± 0.04), and the weakest correlation was observed between neuronal −pH and neuronal membrane potential (r = 0.15 ± 0.05). B, Cross-correlation analysis demonstrated that the maximum correlation between traces was observed when pH measurements were shifted with a negative lag, consistent with pH changes occurring in response to network activity. Shaded regions depict SEM. C, The highest cross-correlation values (calculated after shifting pH relative to membrane potential, as in B) were observed between astrocytic pH and astrocytic membrane potential (r = 0.77 ± 0.02). The next highest cross-correlation values were observed between astrocytic pH and neuronal membrane potential (r = 0.68 ± 0.02). These correlation values were both significantly greater than the cross-correlation values observed between neuronal −pH and neuronal membrane potential (r = 0.45 ± 0.04). *p < 0.05, ***p < 0.0001, t test.
This indicates that astrocytic pH is more tightly coupled to epileptiform activity, although it remained a possibility that neuronal −pH was actually more highly correlated, but was offset in time with respect to network activity. To test this, we calculated the cross-correlation between the different signals by shifting the pH recording in time, relative to the membrane potential recording (Fig. 7b). Consistent with the pH changes occurring in response to network activity, the maximum cross-correlations were observed when pH measurements were shifted with a negative lag. Again, we found that the maximum cross-correlation coefficient was the highest between astrocytic pH and astrocytic membrane potential (r = 0.77 ± 0.02, n = 28; Fig. 7c). Furthermore, the maximum cross-correlation between astrocyte pH and neuronal membrane potential (r = 0.68 ± 0.02, n = 40; Fig. 7c) was significantly greater than the maximum cross-correlation between neuronal −pH and neuronal membrane potential (r = 0.45 ± 0.04, n = 44; p < 0.0001, t test; Fig. 7c). Together, these data show that the pH changes in astrocytes are more tightly coupled to the epileptiform network dynamics, than are pH changes in neurons.
Discussion
Here we have used genetically encoded pH indicators in conjunction with confocal and two-photon microscopy to measure intracellular pH dynamics during epileptiform activity in rat organotypic hippocampal slice cultures. This approach has enabled us to confirm that cell-specific differences in pH regulatory mechanisms result in marked differences in intracellular pH dynamics between hippocampal astrocytes and hippocampal pyramidal neurons. In two in vitro models of seizure activity, and with three different genetically encoded pH reporters, astrocytes were observed to alkalinize during SLEs, while neurons were observed to acidify. In addition to the direction of pH change, the kinetics of epileptiform-associated intracellular pH transients were found to differ between the two cell types, with astrocytes displaying significantly more rapid changes in pH. The astrocytic alkalinization during epileptiform activity was shown to be mediated by an electrogenic Na+/HCO3− cotransporter and the kinetics of intracellular pH changes meant that the astrocytic pH tracked ongoing network activity more closely than the neuronal pH.
Our use of genetic reporters to measure intracellular pH compliments earlier studies using ion-sensitive pH electrodes and pH-sensitive dyes, which have provided important information regarding pH regulation in the nervous system (Ahmed and Connor, 1980; Boyarsky et al., 1988b, 1993; Chesler and Kraig, 1989; Deitmer and Szatkowski, 1990; Pappas and Ransom, 1994; Rose and Deitmer, 1995). Genetic reporters of pH offer potential advantages including the opportunity to be targeted to specific cell populations, sparse labeling that can facilitate the visualization of cell morphologies and stable imaging over extended time periods. Our quantification of cell-specific differences in the direction and kinetics of activity-associated pH dynamics were strengthened by the fact that we observed comparable results with three different genetically encoded pH reporters (E2GFP, DeGFP4 and Cl-sensor). Each of these reporters was able to detect pH shifts accompanying short network events on the order of 1–3 s and all three reporters revealed differences in the pH responses of astrocytes and neurons over this timescale. Consistent with previous work (Raimondo et al., 2012), we found that E2GFP provided the best signal-to-noise characteristics, although the optimal use of this reporter required correction for potential fluctuations in laser output (see Materials and Methods). DeGFP4 may offer greater utility for imaging in thick tissue, as it can be used with two-photon excitation. Meanwhile, our use of Cl-sensor proved an excellent pH reporter within the context of a 0 Cl− model of epilepsy, but this reporter's dual sensitivity to Cl− and pH means that it is likely to have limited use beyond this particular seizure model.
Our use of organotypic hippocampal slice cultures allowed us to transfect low numbers of cells with genetically encoded reporters and afforded good optical access for pH imaging from morphologically identifiable cell types. Although many aspects of organotypic hippocampal slice cultures have been shown to resemble the in vivo state (De Simoni et al., 2003), excitatory neurons in this experimental system are known to exhibit increased axonal sprouting, which is likely to facilitate epileptiform activity (Dyhrfjeld-Johnsen et al., 2010). The use of organotypic slices also meant that the astrocyte population consisted of both protoplasmic astrocytes and reactive astrocytes, which is likely to be related to the trauma associated with the slicing procedure (Benediktsson et al., 2005). Importantly, we observed intracellular alkalinization in all astrocytic morphologies during SLEs, suggesting that the alkalinization is a general feature of astrocytes. Future work could consider using morphological criteria to subclassify astrocytes and explore whether there are more subtle differences in pH dynamics.
Previous work has shown that membrane depolarization or electrical stimulation results in the intracellular acidification of neurons (Ahmed and Connor, 1980; Trapp et al., 1996; Zhan et al., 1998). The underlying mechanisms for this acidification are thought to include the action of Ca2+/H+ ATPases located in the plasma membrane and endoplasmic reticulum (Schwiening et al., 1993; Makani and Chesler, 2010), the production of metabolic acids (Wang et al., 1994), and HCO3− efflux via activated GABAARs (Pasternack et al., 1993; Trapp et al., 1996). Meanwhile, previous research has shown that membrane depolarization in astrocytes results in intracellular alkalinization (Boyarsky et al., 1988b, 1993; Chesler and Kraig, 1989) via the action of the electrogenic Na+ coupled HCO3− transporter (NBCe1; Boyarsky et al., 1993; Brookes and Turner, 1994; Bevensee et al., 1997). Here we have extended these observations by confirming the prediction that astrocytes exhibit opposing pH shifts to neurons during epileptiform activity. We demonstrate that electrogenic Na+/HCO3− cotransport likely underlies SLE-associated astrocytic alkalinization, which is consistent with our observation that astrocytic alkalinization correlates closely with astrocytic membrane potential changes. This is consistent with evidence that NBCe1 is more highly expressed in astrocytes than neurons (Giffard et al., 2000; Schmitt et al., 2000; Theparambil et al., 2014), including recent work showing that RNA for SLC4a4 (the gene encoding NBCe1) is >20 times more highly transcribed in astrocytes (Zhang et al., 2014). Nevertheless, we cannot exclude the possibility that, in addition to the Na+/HCO3− cotransporter, other mechanisms contribute to the intracellular pH dynamics in astrocytes during seizures.
A key point from our study is that during epileptiform activity, astrocytic pH remains tightly coupled to cellular activity (both astrocytic and neuronal) at the population level. Indeed, astrocytic pH dynamics are more closely related to network activity than are neuronal pH dynamics. This tight coupling could enable astrocytes to rapidly respond to the ionic and metabolic demands of the network. For example, the coupling of astrocytic alkalinization to epileptiform activity would be predicted to enhance gap junction coupling between astrocytes (Spray et al., 1981), which in turn would improve the spatial buffering of extracellular K+ that accumulates during seizures (Dreier and Heinemann, 1991; Wallraff et al., 2006). With regards to neurometabolic coupling, Ruminot et al. (2011) have demonstrated that alkaline transients in astrocytes are sufficient to accelerate glycolysis and lactate production (Bittner et al., 2011), which is subsequently transported via the lactate shuttle to neurons. In conjunction with our observations, this would suggest that rapid, activity-dependent alkaline intracellular pH transients could provide a dynamic mechanism for astrocytes to anticipate neuronal demand for metabolic substrates in the face of enhanced network activity (Barros, 2013). This may be particularly relevant in the context of epileptic seizures where neuronal metabolic demand is markedly increased. Indeed, it is possible that such a mechanism could enable astrocytes to help maintain epileptiform activity by ensuring that the energy demands of nearby neurons remain met (Gómez-Gonzalo et al., 2010).
More generally, our results support the view that the CNS exhibits compartment-specific changes in pH during seizure activity. Intracellular pH changes are largely the result of H+ equivalents moving across the cell membrane, which will therefore manifest as pH changes in the extracellular space. Our observations of different seizure-associated pH response kinetics in the two major intracellular compartments, astrocytes and neurons, is consistent with reports of complex pH transients in the extracellular space (Caspers and Speckmann, 1972; Urbanics et al., 1978; Xiong and Stringer, 2000). Rapid astrocytic alkalinization during seizure activity would be predicted to result in an early extracellular acidification, which would precede or reduce the extracellular alkalosis generated by intraneuronal acidification. Indeed, previous work has observed such an effect in the hippocampus and in a manner that correlates with the maturation of astrocytes (Xiong and Stringer, 2000). Astrocytic acidification of the extracellular space has long been postulated as a mechanism for modulating network excitability (Deitmer and Rose, 1996; Ransom, 2000; Chesler, 2003), perhaps through pH-dependent effects on synaptic transmission and/or voltage-gated channels (Tang et al., 1990; Barnes and Bui, 1991; Pasternack et al., 1996). How more complex extracellular pH transients might modulate synaptic transmission and evolving seizure activity remains an important question for the future.
In summary, our findings support the idea that astrocytes are uniquely positioned to regulate network activity under physiological and pathophysiological conditions. Differences in cell-specific pH regulatory mechanisms mean that during epileptiform activity, astrocytes experience pH changes that are highly distinct from nearby neurons, both in terms of their direction and temporal kinetics. This work adds further impetus to examine the role of astrocytes in controlling the spread of epileptiform activity (Gómez-Gonzalo et al., 2010; Bedner et al., 2015).
Footnotes
This work was supported by a grant from the Medical Research Council (G0601503), the Oxford Stem Cell Institute and the Blue Brain Project; the European Research Council under the European Community's Seventh Framework Programme (FP7/2007-2013), ERC Grant 243273 and 617670; and by equipment from the École Polytechnique Fédérale de Lausanne, Switzerland. J.V.R was supported by a Rhodes Scholarship, a NRF Innovation Postdoctoral Fellowship, a UCT URC Postdoctoral Fellowship and a Royal Society Newton Advanced Fellowship.
The authors declare no competing financial interests.
References
- Ahmed Z, Connor JA. Intracellular pH changes induced by calcium influx during electrical activity in molluscan neurons. J Gen Physiol. 1980;75:403–426. doi: 10.1085/jgp.75.4.403. [DOI] [PMC free article] [PubMed] [Google Scholar]
- Anderson WW, Lewis DV, Swartzwelder HS, Wilson WA. Magnesium-free medium activates seizure-like events in the rat hippocampal slice. Brain Res. 1986;398:215–219. doi: 10.1016/0006-8993(86)91274-6. [DOI] [PubMed] [Google Scholar]
- Araque A, Parpura V, Sanzgiri RP, Haydon PG. Tripartite synapses: glia, the unacknowledged partner. Trends Neurosci. 1999;22:208–215. doi: 10.1016/S0166-2236(98)01349-6. [DOI] [PubMed] [Google Scholar]
- Arosio D, Ricci F, Marchetti L, Gualdani R, Albertazzi L, Beltram F. Simultaneous intracellular chloride and pH measurements using a GFP-based sensor. Nat Methods. 2010;7:516–518. doi: 10.1038/nmeth.1471. [DOI] [PubMed] [Google Scholar]
- Barnes S, Bui Q. Modulation of calcium-activated chloride current via pH-induced changes of calcium channel properties in cone photoreceptors. J Neurosci. 1991;11:4015–4023. doi: 10.1523/JNEUROSCI.11-12-04015.1991. [DOI] [PMC free article] [PubMed] [Google Scholar]
- Barros LF. Metabolic signaling by lactate in the brain. Trends Neurosci. 2013;36:396–404. doi: 10.1016/j.tins.2013.04.002. [DOI] [PubMed] [Google Scholar]
- Bedner P, Dupper A, Hüttmann K, Müller J, Herde MK, Dublin P, Deshpande T, Schramm J, Häussler U, Haas CA, Henneberger C, Theis M, Steinhäuser C. Astrocyte uncoupling as a cause of human temporal lobe epilepsy. Brain. 2015;138:1208–1222. doi: 10.1093/brain/awv067. [DOI] [PMC free article] [PubMed] [Google Scholar]
- Benediktsson AM, Schachtele SJ, Green SH, Dailey ME. Ballistic labeling and dynamic imaging of astrocytes in organotypic hippocampal slice cultures. J Neurosci Methods. 2005;141:41–53. doi: 10.1016/j.jneumeth.2004.05.013. [DOI] [PubMed] [Google Scholar]
- Bevensee MO, Weed RA, Boron WF. Intracellular pH regulation in cultured astrocytes from rat hippocampus: I. Role of HCO3−. J Gen Physiol. 1997;110:453–465. doi: 10.1085/jgp.110.4.453. [DOI] [PMC free article] [PubMed] [Google Scholar]
- Bittner CX, Valdebenito R, Ruminot I, Loaiza A, Larenas V, Sotelo-Hitschfeld T, Moldenhauer H, San Martín A, Gutiérrez R, Zambrano M, Barros LF. Fast and reversible stimulation of astrocytic glycolysis by K+ and a delayed and persistent effect of glutamate. J Neurosci. 2011;31:4709–4713. doi: 10.1523/JNEUROSCI.5311-10.2011. [DOI] [PMC free article] [PubMed] [Google Scholar]
- Bizzarri R, Serresi M, Luin S, Beltram F. Green fluorescent protein based pH indicators for in vivo use: a review. Anal Bioanal Chem. 2009;393:1107–1122. doi: 10.1007/s00216-008-2515-9. [DOI] [PubMed] [Google Scholar]
- Boyarsky G, Ganz MB, Sterzel RB, Boron WF. pH regulation in single glomerular mesangial cells: I. Acid extrusion in absence and presence of HCO3−. Am J Physiol. 1988a;255:C844–C856. doi: 10.1152/ajpcell.1988.255.6.C844. [DOI] [PubMed] [Google Scholar]
- Boyarsky G, Ransom B, Carlini W, Boron W. Intracellular pH regulation in cultured mammalian astrocytes. Soc Neurosci Abstr. 1988b;14:1057. [Google Scholar]
- Boyarsky G, Ransom B, Schlue WR, Davis MB, Boron WF. Intracellular pH regulation in single cultured astrocytes from rat forebrain. Glia. 1993;8:241–248. doi: 10.1002/glia.440080404. [DOI] [PubMed] [Google Scholar]
- Brookes N, Turner RJ. K(+)-induced alkalinization in mouse cerebral astrocytes mediated by reversal of electrogenic Na(+)-HCO3- cotransport. Am J Physiol. 1994;267:C1633–40. doi: 10.1152/ajpcell.1994.267.6.C1633. [DOI] [PubMed] [Google Scholar]
- Caspers H, Speckmann E. Cerebral pO2, pCO2 and pH: changes during convulsive activity and their significance for spontaneous arrest of seizures. Epilepsia. 1972;13:699–725. doi: 10.1111/j.1528-1157.1972.tb04403.x. [DOI] [PubMed] [Google Scholar]
- Ch'en FF, Villafuerte FC, Swietach P, Cobden PM, Vaughan-Jones RD. S0859, an N-cyanosulphonamide inhibitor of sodium-bicarbonate cotransport in the heart. Br J Pharmacol. 2008;153:972–982. doi: 10.1038/sj.bjp.0707667. [DOI] [PMC free article] [PubMed] [Google Scholar]
- Chesler M. Regulation and modulation of pH in the brain. Physiol Rev. 2003;83:1183–1221. doi: 10.1152/physrev.00010.2003. [DOI] [PubMed] [Google Scholar]
- Chesler M, Kraig RP. Intracellular pH transients of mammalian astrocytes. J Neurosci. 1989;9:2011–2019. doi: 10.1523/JNEUROSCI.09-06-02011.1989. [DOI] [PMC free article] [PubMed] [Google Scholar]
- Choi HB, Gordon GR, Zhou N, Tai C, Rungta RL, Martinez J, Milner TA, Ryu JK, McLarnon JG, Tresguerres M, Levin LR, Buck J, MacVicar BA. Metabolic communication between astrocytes and neurons via bicarbonate-responsive soluble adenylyl cyclase. Neuron. 2012;75:1094–1104. doi: 10.1016/j.neuron.2012.08.032. [DOI] [PMC free article] [PubMed] [Google Scholar]
- De Simoni A, Griesinger CB, Edwards FA. Development of rat CA1 neurones in acute versus organotypic slices: role of experience in synaptic morphology and activity. J Physiol. 2003;550:135–147. doi: 10.1113/jphysiol.2003.039099. [DOI] [PMC free article] [PubMed] [Google Scholar]
- Deitmer JW, Szatkowski M. Membrane potential dependence of intracellular pH regulation by identified glial cells in the leech central nervous system. J Physiol. 1990;421:617–631. doi: 10.1113/jphysiol.1990.sp017965. [DOI] [PMC free article] [PubMed] [Google Scholar]
- Deitmer JW, Rose CR. pH regulation and proton signalling by glial cells. Prog Neurobiol. 1996;48:73–103. doi: 10.1016/0301-0082(95)00039-9. [DOI] [PubMed] [Google Scholar]
- Dreier JP, Heinemann U. Regional and time dependent variations of low Mg2+ induced epileptiform activity in rat temporal cortex slices. Exp Brain Res. 1991;87:581–596. doi: 10.1007/BF00227083. [DOI] [PubMed] [Google Scholar]
- Dyhrfjeld-Johnsen J, Berdichevsky Y, Swiercz W, Sabolek H, Staley KJ. Interictal spikes precede ictal discharges in an organotypic hippocampal slice culture model of epileptogenesis. J Clin Neurophysiol. 2010;27:418–424. doi: 10.1097/WNP.0b013e3181fe0709. [DOI] [PMC free article] [PubMed] [Google Scholar]
- Ellender TJ, Raimondo JV, Irkle A, Lamsa KP, Akerman CJ. Excitatory effects of parvalbumin-expressing interneurons maintain hippocampal epileptiform activity via synchronous afterdischarges. J Neurosci. 2014;34:15208–15222. doi: 10.1523/JNEUROSCI.1747-14.2014. [DOI] [PMC free article] [PubMed] [Google Scholar]
- Erecińska M, Deas J, Silver IA. The effect of pH on glycolysis and phosphofructokinase activity in cultured cells and synaptosomes. J Neurochem. 1995;65:2765–2772. doi: 10.1046/j.1471-4159.1995.65062765.x. [DOI] [PubMed] [Google Scholar]
- Giffard RG, Papadopoulos MC, van Hooft JA, Xu L, Giuffrida R, Monyer H. The electrogenic sodium bicarbonate cotransporter: developmental expression in rat brain and possible role in acid vulnerability. J Neurosci. 2000;20:1001–1008. doi: 10.1523/JNEUROSCI.20-03-01001.2000. [DOI] [PMC free article] [PubMed] [Google Scholar]
- Gómez-Gonzalo M, Losi G, Chiavegato A, Zonta M, Cammarota M, Brondi M, Vetri F, Uva L, Pozzan T, de Curtis M, Ratto GM, Carmignoto G. An excitatory loop with astrocytes contributes to drive neurons to seizure threshold. PLoS Biol. 2010;8:e1000352. doi: 10.1371/journal.pbio.1000352. [DOI] [PMC free article] [PubMed] [Google Scholar]
- Grynkiewicz G, Poenie M, Tsien RY. A new generation of Ca2+ indicators with greatly improved fluorescence properties. J Biol Chem. 1985;260:3440–3450. [PubMed] [Google Scholar]
- Hinterkeuser S, Schröder W, Hager G, Seifert G, Blümcke I, Elger CE, Schramm J, Steinhäuser C. Astrocytes in the hippocampus of patients with temporal lobe epilepsy display changes in potassium conductances. Eur J Neurosci. 2000;12:2087–2096. doi: 10.1046/j.1460-9568.2000.00104.x. [DOI] [PubMed] [Google Scholar]
- Howarth C, Gleeson P, Attwell D. Updated energy budgets for neural computation in the neocortex and cerebellum. J Cereb Blood Flow Metab. 2012;32:1222–1232. doi: 10.1038/jcbfm.2012.35. [DOI] [PMC free article] [PubMed] [Google Scholar]
- Majumdar D, Bevensee MO. Na-coupled bicarbonate transporters of the solute carrier 4 family in the nervous system: function, localization, and relevance to neurologic function. Neuroscience. 2010;171:951–972. doi: 10.1016/j.neuroscience.2010.09.037. [DOI] [PMC free article] [PubMed] [Google Scholar]
- Makani S, Chesler M. Rapid rise of extracellular pH evoked by neural activity is generated by the plasma membrane calcium ATPase. J Neurophysiol. 2010;103:667–676. doi: 10.1152/jn.00948.2009. [DOI] [PMC free article] [PubMed] [Google Scholar]
- Markova O, Mukhtarov M, Real E, Jacob Y, Bregestovski P. Genetically encoded chloride indicator with improved sensitivity. J Neurosci Methods. 2008;170:67–76. doi: 10.1016/j.jneumeth.2007.12.016. [DOI] [PubMed] [Google Scholar]
- McKhann GM, 2nd, D'Ambrosio R, Janigro D. Heterogeneity of astrocyte resting membrane potentials and intercellular coupling revealed by whole-cell and gramicidin-perforated patch recordings from cultured neocortical and hippocampal slice astrocytes. J Neurosci. 1997;17:6850–6863. doi: 10.1523/JNEUROSCI.17-18-06850.1997. [DOI] [PMC free article] [PubMed] [Google Scholar]
- O'Connor E, Sontheimer H, Ransom BR. Rat hippocampal astrocytes exhibit electrogenic sodium-bicarbonate co-transport. J Neurophysiol. 1994;72:2580–2589. doi: 10.1152/jn.1994.72.6.2580. [DOI] [PubMed] [Google Scholar]
- Pappas CA, Ransom BR. Depolarization-induced alkalinization (DIA) in rat hippocampal astrocytes. J Neurophysiol. 1994;72:2816–2826. doi: 10.1152/jn.1994.72.6.2816. [DOI] [PubMed] [Google Scholar]
- Pasternack M, Voipio J, Kaila K. Intracellular carbonic anhydrase activity and its role in GABA-induced acidosis in isolated rat hippocampal pyramidal neurones. Acta Physiol Scand. 1993;148:229–231. doi: 10.1111/j.1748-1716.1993.tb09553.x. [DOI] [PubMed] [Google Scholar]
- Pasternack M, Smirnov S, Kaila K. Proton modulation of functionally distinct GABAA receptors in acutely isolated pyramidal neurons of rat hippocampus. Neuropharmacology. 1996;35:1279–1288. doi: 10.1016/S0028-3908(96)00075-5. [DOI] [PubMed] [Google Scholar]
- Pellerin L, Magistretti PJ. Glutamate uptake into astrocytes stimulates aerobic glycolysis: a mechanism coupling neuronal activity to glucose utilization. Proc Natl Acad Sci U S A. 1994;91:10625–10629. doi: 10.1073/pnas.91.22.10625. [DOI] [PMC free article] [PubMed] [Google Scholar]
- Raimondo JV, Irkle A, Wefelmeyer W, Newey SE, Akerman CJ. Genetically encoded proton sensors reveal activity-dependent pH changes in neurons. Front Mol Neurosci. 2012;5:68. doi: 10.3389/fnmol.2012.00068. [DOI] [PMC free article] [PubMed] [Google Scholar]
- Raimondo JV, Joyce B, Kay L, Schlagheck T, Newey SE, Srinivas S, Akerman CJ. A genetically encoded chloride and pH sensor for dissociating ion dynamics in the nervous system. Front Cell Neurosci. 2013;7:202. doi: 10.3389/fncel.2013.00202. [DOI] [PMC free article] [PubMed] [Google Scholar]
- Raimondo JV, Burman RJ, Katz AA, Akerman CJ. Ion dynamics during seizures. Front Cell Neurosci. 2015;9:419. doi: 10.3389/fncel.2015.00419. [DOI] [PMC free article] [PubMed] [Google Scholar]
- Ransom BR. Glial modulation of neural excitability mediated by extracellular pH: a hypothesis revisited. Prog Brain Res. 2000;125:217–228. doi: 10.1016/S0079-6123(00)25012-7. [DOI] [PubMed] [Google Scholar]
- Rose CR, Deitmer JW. Stimulus-evoked changes of extra- and intracellular pH in the leech central nervous system: II. Mechanisms and maintenance of pH homeostasis. J Neurophysiol. 1995;73:132–140. doi: 10.1152/jn.1995.73.1.132. [DOI] [PubMed] [Google Scholar]
- Ruminot I, Gutiérrez R, Peña-Münzenmayer G, Añazco C, Sotelo-Hitschfeld T, Lerchundi R, Niemeyer MI, Shull GE, Barros LF. NBCe1 mediates the acute stimulation of astrocytic glycolysis by extracellular K+ J Neurosci. 2011a;31:14264–14271. doi: 10.1523/JNEUROSCI.2310-11.2011. [DOI] [PMC free article] [PubMed] [Google Scholar]
- Schmitt BM, Berger UV, Douglas RM, Bevensee MO, Hediger MA, Haddad GG, Boron WF. Na/HCO3 cotransporters in rat brain: expression in glia, neurons, and choroid plexus. J Neurosci. 2000;20:6839–6848. doi: 10.1523/JNEUROSCI.20-18-06839.2000. [DOI] [PMC free article] [PubMed] [Google Scholar]
- Schwiening CJ, Kennedy HJ, Thomas RC. Calcium-hydrogen exchange by the plasma membrane Ca-ATPase of voltage-clamped snail neurons. Proc Biol Sci. 1993;253:285–289. doi: 10.1098/rspb.1993.0115. [DOI] [PubMed] [Google Scholar]
- Spray DC, Harris AL, Bennett MV. Gap junctional conductance is a simple and sensitive function of intracellular pH. Science. 1981;211:712–715. doi: 10.1126/science.6779379. [DOI] [PubMed] [Google Scholar]
- Stoppini L, Buchs PA, Muller D. A simple method for organotypic cultures of nervous tissue. J Neurosci Methods. 1991;37:173–182. doi: 10.1016/0165-0270(91)90128-m. [DOI] [PubMed] [Google Scholar]
- Taira T, Smirnov S, Voipio J, Kaila K. Intrinsic proton modulation of excitatory transmission in rat hippocampal slices. Neuroreport. 1993;4:93–96. doi: 10.1097/00001756-199301000-00024. [DOI] [PubMed] [Google Scholar]
- Tang CM, Dichter M, Morad M. Modulation of the N-methyl-d-aspartate channel by extracellular H+ Proc Natl Acad Sci U S A. 1990;87:6445–6449. doi: 10.1073/pnas.87.16.6445. [DOI] [PMC free article] [PubMed] [Google Scholar]
- Theparambil SM, Ruminot I, Schneider HP, Shull GE, Deitmer JW. The electrogenic sodium bicarbonate cotransporter NBCe1 is a high-affinity bicarbonate carrier in cortical astrocytes. J Neurosci. 2014;34:1148–1157. doi: 10.1523/JNEUROSCI.2377-13.2014. [DOI] [PMC free article] [PubMed] [Google Scholar]
- Trapp S, Lückermann M, Brooks PA, Ballanyi K. Acidosis of rat dorsal vagal neurons in situ during spontaneous and evoked activity. J Physiol. 1996;496:695–710. doi: 10.1113/jphysiol.1996.sp021720. [DOI] [PMC free article] [PubMed] [Google Scholar]
- Traynelis SF, Cull-Candy SG. Proton inhibition of N-methyl-d-aspartate receptors in cerebellar neurons. Nature. 1990;345:347–350. doi: 10.1038/345347a0. [DOI] [PubMed] [Google Scholar]
- Urbanics R, Leniger-Follert E, Lübbers DW. Time course of changes of extracellular H+ and K+ activities during and after direct electrical stimulation of the brain cortex. Pflugers Arch. 1978;378:47–53. doi: 10.1007/BF00581957. [DOI] [PubMed] [Google Scholar]
- Wallraff A, Köhling R, Heinemann U, Theis M, Willecke K, Steinhäuser C. The impact of astrocytic gap junctional coupling on potassium buffering in the hippocampus. J Neurosci. 2006;26:5438–5447. doi: 10.1523/JNEUROSCI.0037-06.2006. [DOI] [PMC free article] [PubMed] [Google Scholar]
- Walz W. Role of astrocytes in the clearance of excess extracellular potassium. Neurochem Int. 2000;36:291–300. doi: 10.1016/S0197-0186(99)00137-0. [DOI] [PubMed] [Google Scholar]
- Wang GJ, Randall RD, Thayer SA. Glutamate-induced intracellular acidification of cultured hippocampal neurons demonstrates altered energy metabolism resulting from Ca2+ loads. J Neurophysiol. 1994;72:2563–2569. doi: 10.1152/jn.1994.72.6.2563. [DOI] [PubMed] [Google Scholar]
- Xiong ZQ, Stringer JL. Regulation of extracellular pH in the developing hippocampus. Brain Res Dev Brain Res. 2000;122:113–117. doi: 10.1016/S0165-3806(00)00057-2. [DOI] [PubMed] [Google Scholar]
- Xiong ZQ, Saggau P, Stringer JL. Activity-dependent intracellular acidification correlates with the duration of seizure activity. J Neurosci. 2000;20:1290–1296. doi: 10.1523/JNEUROSCI.20-04-01290.2000. [DOI] [PMC free article] [PubMed] [Google Scholar]
- Yamamoto C. Intracellular study of seizure-like afterdischarges elicited in thin hippocampal sections in vitro. Exp Neurol. 1972;35:154–164. doi: 10.1016/0014-4886(72)90066-0. [DOI] [PubMed] [Google Scholar]
- Yamamoto C, Kawai N. Seizure discharges evoked in vitro in thin section from guinea pig hippocampus. Science. 1967;155:341–342. doi: 10.1126/science.155.3760.341. [DOI] [PubMed] [Google Scholar]
- Zhang Y, Chen K, Sloan SA, Bennett ML, Scholze AR, O'Keeffe S, Phatnani HP, Guarnieri P, Caneda C, Ruderisch N, Deng S, Liddelow SA, Zhang C, Daneman R, Maniatis T, Barres BA, Wu JQ. An RNA-sequencing transcriptome and splicing database of glia, neurons, and vascular cells of the cerebral cortex. J Neurosci. 2014;34:11929–11947. doi: 10.1523/JNEUROSCI.1860-14.2014. [DOI] [PMC free article] [PubMed] [Google Scholar]
- Zhan RZ, Fujiwara N, Tanaka E, Shimoji K. Intracellular acidification induced by membrane depolarization in rat hippocampal slices: roles of intracellular Ca2+ and glycolysis. Brain Res. 1998;780:86–94. doi: 10.1016/S0006-8993(97)01149-9. [DOI] [PubMed] [Google Scholar]
- Zucker RM, Price O. Evaluation of confocal microscopy system performance. Cytometry. 2001;44:273–294. doi: 10.1002/1097-0320(20010801)44:4<273::AID-CYTO1120>3.0.CO%2-N. [DOI] [PubMed] [Google Scholar]