Abstract
The ability of aqueous biphasic systems (ABS) composed of polyethylene glycols of different molecular weights (PEG 400, 600 and 1000) and buffered aqueous solutions of potassium citrate/citric acid (pH = 5.0 - 8.0) to selectively extract ovalbumin from egg white was here investigated. Phase diagrams, tie-lines and tie-line lengths were determined at 25ºC and the partitioning of ovalbumin in these systems was then evaluated. Aiming at optimizing the selective extraction of ovalbumin in the studied ABS, factors such as pH, PEG molecular weight and amount of the phase-forming components were initially investigated with pure commercial ovalbumin. In almost all ABS, it was observed a preferential partitioning of ovalbumin to the polymer-rich phase, with extraction efficiencies higher than 90%. The best ABS were then applied in the purification of ovalbumin from the real egg white matrix. In order to ascertain on the ovalbumin purity and yield, sodium dodecyl sulphate polyacrylamide gel electrophoresis (SDS-PAGE) and size exclusion high performance liquid chromatography (SE-HPLC) analyses were conducted, confirming that the isolation/purification of ovalbumin from egg white was completely achieved in a single-step with a recovery yield of 65%. The results obtained show that polymer-salt-based ABS allow the selective extraction of ovalbumin from egg white with a simpler approach and better performance than previously reported. Finally, it is shown that ovalbumin can be completely recovered from the PEG-rich phase by an induced precipitation using an inexpensive and sustainable separation platform which can be easily applied on an industrial scale.
Keywords: Ovalbumin, Protein Recovery, Separation, Aqueous Two Phase, Downstream Processing, Egg White
Introduction
Egg white is an aqueous-rich medium mainly composed of proteins, circa 10-12%, such as ovalbumin, ovotransferrin, lysozyme and ovomucin [1]. In addition to their nutritional importance, egg white proteins display multiple functional properties, such as foaming, emulsification and heat-setting. As a result, egg white plays a major role in the food industry [2]. Furthermore, new applications involving egg white proteins are increasingly being found due to their antimicrobial and antioxidant properties [3], which have contributed for the production of health- and pharmaceutical-related products. Ovalbumin is the main protein of egg white, being responsible for most of its functional properties, and represents about 54% of the total protein content [4]. Ovalbumin is a glycoprotein consisting of 385 amino acids (45 kDa) with an isoelectric point of 4.5 [5]. Because of the remarkable applications involving egg white proteins of high purity level [6–9], the development of novel cost-effective purification techniques is in great demand.
Ovalbumin was one of the first proteins isolated from egg white [10]. For that purpose, Hopkins [10] developed a method using high amounts of ammonium sulfate for ovalbumin precipitation. Nevertheless, the high amount of salt used can lead to the proteins irreversible unfolding. Nowadays, proteins from egg white are typically separated by electrophoresis, ion-exchange chromatography, size exclusion liquid chromatography, ultrafiltration, adsorption, among others [11–18]. However, some of these methods currently employed are multi-stage and with high equipment and operating costs. In the context of the development of alternative processes for the purification of proteins, a large interest has been devoted to aqueous biphasic systems (ABS) in the past decades [13]. ABS are a liquid-liquid extraction/purification technique which provides a highly biocompatible media since they are mainly composed of water [19]. Nevertheless, the extraction and purification of proteins from a complex matrix, such as egg white, is a difficult task due to some similarities between the proteins present in the raw material.
Most works in the literature have been focused on the evaluation of the extraction and recovery ability of ABS employing commercial and pure egg white proteins. For instance, Saravan et al. [20] studied the partitioning behavior of ovalbumin in poly(ethyleneglycol) (PEG)–poly(acrylic acid) ABS, achieving an extraction yield of 87.4%. Nerli et al. [21] investigated the thermodynamic forces involved in the partitioning of ovalbumin in various aqueous two-phase polymer systems (constituted by PEGs of different molecular weights and dextran). The authors [21] demonstrated that the ovalbumin transfer to the top phase is exothermic, which suggests an electrostatic interaction between the hydroxyl groups of PEG and the hydrophilic side chain of the protein. Dallora et al. [22] investigated the partition coefficients of trypsin and lysozyme, and demonstrated that they can range between 1.0 and 2.4 for trypsin and from 2.3 to 9.0 for lysozyme, depending on the polymer chain size and on the tie-line length. The analysis of the separation factor, defined as the ratio of partition coefficients of two proteins, shows that high degrees of separation could be achieved [22]. In addition to these studies employing pure proteins, Coen et al. [23] investigated the purification of egg white proteins using ammonium-sulfate precipitation and found some difficulties in the separation of lysozyme and ovalbumin. The extraction of lysozyme from egg white was also attempted using an ABS composed of PEG 600 and a sulfate-based salt at 25ºC and pH = 10 [24]. The authors reported an extraction of 70% of lysozyme from egg white with no loss in the enzymatic activity. Yang and co-workers [25] demonstrated the application of PEG 4000/potassium citrate ABS to extract lysozyme from egg white. Diederich et al. [26] showed the selective separation of avidin from the remaining proteins from egg white using an ABS composed of PEG 600 + potassium phosphate + 3 wt% NaCl, with a purity level higher than 60% and recovery yields > 90% (for avidin). In an attempt to reach higher purification levels, multi-stage ABS separations, by means of liquid-liquid chromatography, have been also investigated. Shibusawa et al. [27–28] fractionated chicken egg white proteins by high-speed counter-current chromatography (HSCCC) using an ABS composed of PEG 1000 and potassium phosphate salts at different pH values. After the optimization of several operational conditions, the authors [27–28] demonstrated to be able to purify the proteins present in the crude sample solution prepared from fresh egg white using CCC. Zhi et al. [29] also employed ABS coupled to HSCCC aiming at purifying the major protein components in hen egg white, including ovaltransferrin, ovalbumin and lysozyme. Ovalbumin was successfully purified (up to 95%) from the hen egg white sample with a PEG 1000 + potassium phosphate ABS [29]. Other approaches have been described for the purification of egg white proteins, namely by the use of ion exchange columns followed by precipitations steps [30–31]. It should be however highlighted that most works reporting higher purification levels of egg white proteins comprise several stages of equilibrium and require specialized equipment, such as those using HSCCC [27–29].
This work is focused on the development of an one-step extraction/purification process of ovalbumin from egg white using ABS constituted by polyethylene glycol of different molecular weights (PEG 400, PEG 600 and PEG 1000) and a citrate-buffered medium (pH = 5, 6, 7 and 8 according to different K3C6H5O7:C6H8O7 mole fraction ratios). Initially, the phase diagrams of each ternary system, i.e., the description of the binodal curves which separate the monophasic from the biphasic regimes, were determined at 25ºC. The respective tie-lines and tie-line lengths were also determined. These biphasic systems were then optimized regarding their extraction performance for commercial ovalbumin and finally employed to separate ovalbumin from egg white.
Experimental Section
Materials
The ABS studied in this work are composed of a buffer aqueous solution constituted by potassium citrate monohydrate, K3C6H5O7·H2O, ≥ 99 wt% pure from Sigma–Aldrich, and citric acid monohydrate, C6H8O7·H2O, 100 wt% pure from Fisher Scientific. Polyethylene glycol of different molecular weights, namely 400 g.mol-1 (PEG 400), 600 g.mol-1 (PEG 600), and 1000 g.mol-1 (PEG 1000), and ovalbumin from hen egg white, were acquired from Fluka. All compounds were used as received. Fresh eggs were bought in a local supermarket.
Phase diagrams, tie-lines and tie-line lengths
Aqueous solutions of polyethylene glycol (PEG 400, PEG 600 and PEG 1000) at 90 wt% and aqueous solutions of the buffer K3C6H5O7/C6H8O7 (pH = 5, 6, 7 and 8 according to different K3C6H5O7:C6H8O7 mole fraction ratios) at ≈ 50 wt% were prepared and used for the determination of the binodal curves. The phase diagrams were determined through the cloud point titration method [32–33] at 25ºC and atmospheric pressure. The system compositions were determined by the weight quantification of all components added within ± 10-4 g.
The tie-lines (TLs) were determined by a gravimetric method originally proposed by Merchuk et al. [34]. A mixture point in the biphasic region of the phase diagram was prepared using small ampules (ca. 10 mL) especially designed for the purpose, vigorously stirred and allowed to reach equilibrium by the separation of the phases for at least 12 h at (25 ± 1)ºC. After separation of the two phases, both the top and bottom phases were weighted. Each individual TL was determined by application of the lever-arm rule to the relationship between the top phase weight and the overall system composition. The experimental binodal curves were correlated using Eq. (1) [34]:
| (1) |
The determination of the TLs was accomplished through the solution of the following system (Eqs. (2) to (5)) with four unknown values, namely [PEG]PEG, [PEG]salt, [salt]PEG and [salt]salt) [34]:
| (2) |
| (3) |
| (4) |
| (5) |
where the subscripts “PEG”, “salt” and “M” represent the polymer (top) and the salt (bottom) rich phases and the mixture composition, respectively. The parameter α is the ratio between the weight of the top phase and the weight of the total mixture.
The tie-line lengths (TLLs) were determined according to Equation 6,
| (6) |
Partitioning of commercial ovalbumin in PEG-salt ABS
Fixed mixture compositions in several ABS were selected and used to evaluate their performance for the extraction of ovalbumin. Initial optimization tests were carried out with pure commercial ovalbumin. Then, the best ABS was employed in the separation of ovalbumin from egg white. Commercial ovalbumin was diluted in water at a concentration of circa 0.5 g.L-1 while egg white was diluted in water at 1:10 (v:v). These aqueous solutions were then used in the formation of each ABS (plus PEG and K3C6H5O7/C6H8O7) at given concentrations. Each mixture was vigorously stirred and left to equilibrate for 12 h at (25 ± 1)ºC. Finally, the two liquid phases were separated and weighted followed by the determination of the concentration of ovalbumin in each phase. The protein amount was quantified through UV-spectroscopy, using a SHIMADZU UV-1700, Pharma-Spec Spectrometer, at a wavelength of 280 nm, and using a calibration curve previously established.
The partition coefficient of ovalbumin, KOva, was determined according to Equation 7:
| (7) |
where [Ova]PEG and [Ova]salt are the concentration of protein in the PEG-rich and in the salt-rich aqueous phases, respectively.
The percentage extraction efficiencies of ovalbumin, EEOva%, are defined as the percentage ratio between the amount (total weight) of ovalbumin in the PEG-rich aqueous phase and that in the total mixture, according to Equation 8:
| (8) |
where and are the total weight of protein in the PEG-rich and in the salt-rich aqueous phases, respectively. Control or “blank” solutions at the same mixture compositions used in the extraction/separation studies (with no protein added) were always used to reduce possible interferences of the phase-forming components through the ovalbumin quantification.
Partitioning of ovalbumin directly extracted from egg white in PEG-salt ABS
After the initial optimization tests carried out with commercial ovalbumin, a fixed mixture composition (25 wt% of PEG + 25 wt% of K3C6H5O7/C6H8O7 (pH 7) + 50 wt% of an aqueous solution containing egg white at 1:10 (v:v)) was used to evaluate the performance of the studied ABS for the extraction and further purification of ovalbumin from egg white. Each mixture was vigorously stirred and left to equilibrate for 12 h at (25 ± 1)ºC. The two liquid phases were separated and weighted followed by the determination of the concentration of ovalbumin and total proteins in each phase. The total protein amount was quantified through UV-spectroscopy, using a SHIMADZU UV-1700, Pharma-Spec Spectrometer, at a wavelength of 280 nm, and using a calibration curve previously established. The quantification of ovalbumin, purification efficiency and identification of all proteins in each phase were carried out by SDS-PAGE and SE-HPLC. At least three independent ABS were prepared and 3 samples of each phase were quantified.
The percentage recovery yield of ovalbumin, RYOva%, is the percentage ratio between the amount of protein in the PEG-rich aqueous phase to that in the initial egg white solution, and is defined according to Eq. (9):
| (9) |
where and are the total weight of ovalbumin in the egg white solution and in the PEG-rich phase, respectively.
The purification efficiency was calculated dividing the HPLC peak area corresponding to ovalbumin by the total area of the peaks corresponding to all proteins in the PEG-rich phase (taking into account all the dilution factors applied to each solution) according to Eq. (10):
| (10) |
where and are the peak areas corresponding to ovalbumin and the total area of the peaks corresponding to all proteins present in the PEG-rich phase, respectively.
Recovery of ovalbumin from the PEG-rich phase
After the optimization of the extraction/purification conditions using ABS, the isolation of ovalbumin from the PEG-rich phase was carried out. For this purpose the following ABS was used as a proof of concept: 25 wt% of PEG 400 + 25 wt% of K3C6H5O7/C6H8O7 (pH = 7) + 50 wt% of an aqueous solution containing egg white at 1:10 (v:v). The PEG-rich phase containing ovalbumin from egg white was separated and further centrifuged at (4.0 ± 0.5) ºC during 20 minutes at 5000 rpm. This procedure was adapted from the literature [35] and allows the precipitation of proteins as a result of their low solubility in PEG aqueous solutions at low temperatures. The pellet obtained was then resuspend in a phosphate buffer solution (50 mM and pH 7.4). This solution containing ovalbumin was further evaluated by FT-IR and SE-HPLC. After the induced precipitation step, the PEG-rich phase was also analyzed by SE-HPLC in order to ensure that all proteins were precipitated.
Sodium dodecyl sulphate polyacrylamide gel electrophoresis (SDS-PAGE)
Taking into account the UV-spectroscopy quantification of the total amount of proteins in each phase, all samples were diluted so that the amount of total protein in each gel lane in the SDS-PAGE was circa 0.5 µg. Samples of the aqueous phases of each ABS containing ovalbumin were diluted at 2:1 (v:v) in a dissociation buffer consisting of 2.5 mL of 0.5 M Tris-HCl pH 6.8, 4.0 mL of 10 % (w/v) SDS solution, 2.0 mL of glycerol, 2.0 mg of bromophenol blue and 310 mg of dithiothreitol (DTT). This overall solution was heated at 95ºC for 5 min to denature the proteins by reducing disulfide linkages, and thus overcoming some forms of the tertiary protein folding and breaking up the quaternary protein structure. Electrophoresis was run on polyacrylamide gels (stacking: 4 % and resolving: 20 %) with a running buffer constituted by 250 mM Tris-HCl, 1.92 M glycine, and 1 % SDS. The proteins were stained with Coomassie Brilliant Blue G-250 0.1 % (w/v), methanol 50 % (v/v), acetic acid 7 % (v/v) and water 42.9 % (v/v). All gels were placed in an orbital shaker at a moderate speed during 2-3 h at room temperature. The gels were further distained in a solution containing acetic acid at 7 % (v/v), methanol at 20 % (v/v) and water at 73 % (v/v) in an orbital shaker at a moderate speed during 3-4 h at room temperature. SDS-PAGE Molecular Weight Standards, namely marker molecular weight full-range from VWR, were used as protein standards. All gels were analyzed using the Image Lab 3.0 (BIO-RAD) analysis tool.
Size Exclusion High-Performance Liquid Chromatography (SE-HPLC)
A mixture composed of 25 wt% of PEG 400 + 25 wt% of K3C6H5O7/C6H8O7 (pH = 7) + 50 wt% of an aqueous solution containing egg white at 1:10 (v:v) was studied to evaluate the yield and purity of ovalbumin. After 12h at 25ºC to attain the equilibrium, a careful separation of the phases was performed and the amount of ovalbumin and remaining proteins in each phase was quantified by SE-HPLC (Size Exclusion High-Performance Liquid Chromatography). The phases were diluted at a 1:10 (v:v) ratio in a phosphate buffer saline solution before injection. A Chromaster HPLC (VWR, Hitachi) coupled to a DAD detector was used. SE-HPLC was performed with an analytical column (25 cm × 2 mm i.d., 25 μm), Lichrospher 100 RP-18, from Merck. A 100 mM phosphate buffer in MiliQ water (mobile phase) was run isocratically with a flow rate of 1 mL·min-1. The temperature of the column and auto-sampler was kept constant at 25°C. The injection volume was of 25 µL. The wavelength was set at 280 nm whereas the retention time of ovalbumin was found to be circa 18 min within an analysis time of 30 min. The quantification of ovalbumin in each phase was carried out by an external standard calibration method in the range of 0.01 to 1.0 g.L-1 of protein.
Fourier transform infrared spectroscopy (FT-IR)
FT-IR spectra were recorded using a Perkin Elmer Spectrum Bx spectrophotometer with a resolution of 4 cm−1. Several aqueous solutions containing ovalbumin at a fixed concentration (1.0 g.L−1) and PEGs at different concentrations were used to perform the FT-IR analysis. The spectra were obtained in the wavelength range from 1800 to 1400 cm−1.
Results and Discussion
Phase diagrams and tie-lines
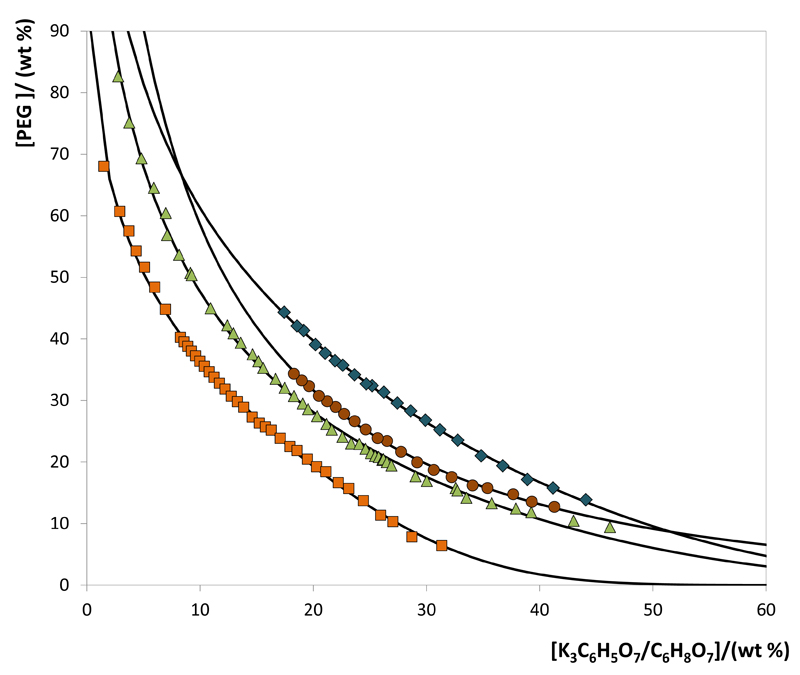
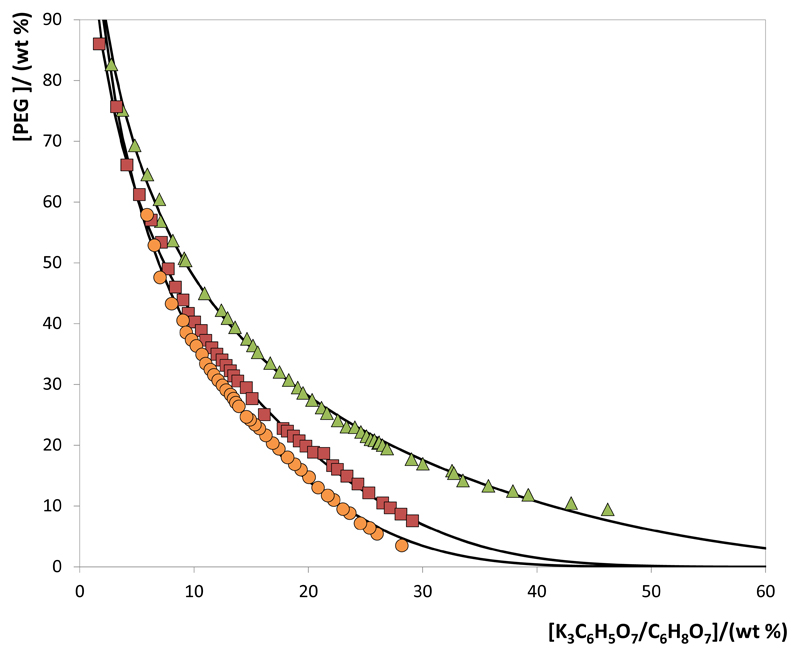
All phase diagrams (PEG + water + K3C6H5O7/C6H8O7) were determined at 25ºC and at atmospheric pressure. The binodal curves depicted in Fig. 1 illustrate the impact of pH (pH = 5, 6, 7 and 8) on the behavior of PEG-400-based phase diagrams. The effect of the molecular weight of the polymer (PEG 400, PEG 600 and PEG 1000) is shown in Fig. 2. The detailed experimental weight fraction data are reported in the Supporting Information. In all studied ABS, the top phase corresponds to the PEG-rich aqueous phase while the bottom phase is mainly composed of the K3C6H5O7/C6H8O7 aqueous buffer. In all calculations, the water amount in the original salt was considered in the total amount of water.
Fig. 1.
Phase diagrams for the systems composed of PEG 400 + K3C6H5O7/C6H8O7 + H2O at 25ºC: pH 5 (◆); pH 6 (●); pH 7 (▲); pH 8 (■). Adjusted binodal data using Equation 1 (—).
Fig. 2.
Phase diagrams for the systems composed of PEG + K3C6H5O7/C6H8O7 + H2O at 25ºC and pH 7.0: PEG 400 (▲); PEG 600 (■); PEG 1000 (●). Adjusted binodal data using Equation 1 (—).
Fig. 1 shows the binodal curves for ABS composed of PEG 400 at different pH values achieved by the use of different K3C6H5O7/C6H8O7 mole fractions. In general, the higher the pH of the aqueous solution the larger is the biphasic region, i.e., lower amounts of salt are required to form an ABS at a given concentration of PEG. In ABS composed of polymers and salts, the latter tends to be preferentially hydrated (Gibbs free energy of hydration of C6H5O73- (ΔhydG) = −2765 kJ.mol−1) [36], and to induce the salting-out of the more hydrophobic substance (PEG). Therefore, the variations on the binodal curves observed with the pH values are a direct consequence of the K3C6H5O7/C6H8O7 ratio and further speciation and relative abundance of the trivalent, divalent and monovalent citrate anions. Larger amounts of the trivalent citrate anion (C6H5O73-) exist at higher pH values, a stronger salting-out species when compared with C6H6O72- and C6H7O7- (according to the Hofmeister series [37]), and thus, lower amounts of the phase-forming components are required to undergo liquid-liquid demixing.
Fig. 2 depicts the phase diagrams for ABS formed by PEGs of different molecular weights and the citrate-based salt at a fixed pH value (pH = 7). PEG-based ABS reveal different abilities for phase separation induced by the length of their polymeric chains. The capacity for forming ABS according to the polymer molecular weight follows the order: PEG 1000 > PEG 600 > PEG 400. This effect was also observed with polymer/ionic liquid, polymer/salt and polymer/polymer combinations [38–40]. The increase of the polymer molecular weight leads to an increased hydrophobicity of these molecules, reducing their affinity for water. Therefore, the formation of ABS by a salting-out phenomenon induced by the citrate-based salt is more favorable for polymers of higher molecular weight.
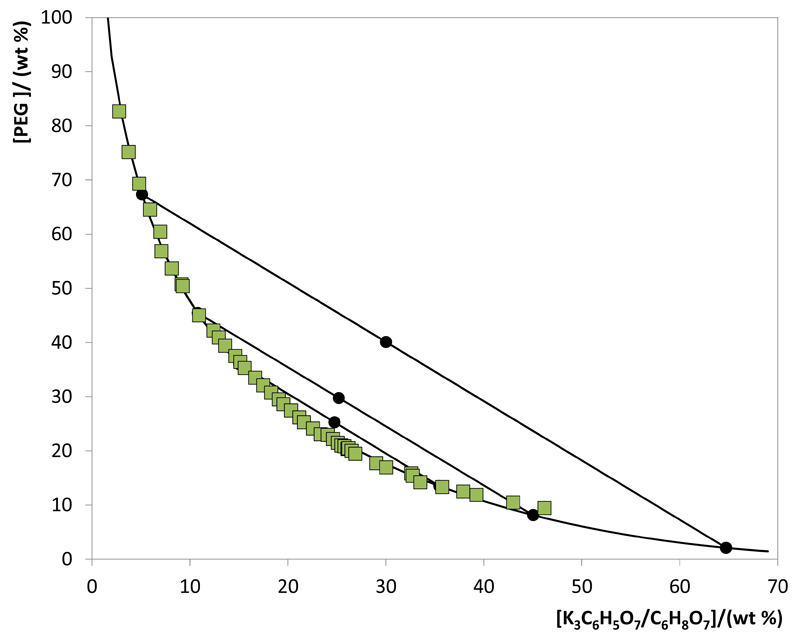
The experimental data corresponding to the binodal curves were fitted using Eq. (1). The regression parameters estimated by a least-squares regression method, standard deviations (σ) and correlation coefficients (R2) are displayed in Table 1. Eq. (1) is able to correlate the experimental binodal curves with high accuracy as shown by the correlation coefficients obtained (R2 > 0.9961). The experimental TLs in each ABS, along with their respective length, and at the compositions for which the extraction studies of ovalbumin were determined are reported in Table 2. An example of the TLs obtained is depicted in Fig. 3.
Table 1.
Correlation parameters used to describe the experimental binodal data by Equation 1.
| PEG | pH | A ± σ | B ± σ | 105 (C ± σ) | R2 |
|---|---|---|---|---|---|
| PEG + K3C6H5O7/C6H8O7 + water | |||||
| 400 | 5.0 | 160.0 ± 7.4 | -0.302 ± 0.010 | 0.54 ± 0.04 | 0.9998 |
| 6.0 | 257.8 ± 6.0 | -0.469 ± 0.018 | 0.01 ± 0.07 | 0.9991 | |
| 7.0 | 158.3 ± 2.0 | -0.378 ± 0.045 | 0.47 ± 0.06 | 0.9980 | |
| 8.0 | 103.4 ± 1.3 | -0.317 ± 0.005 | 3.23 ± 0.16 | 0.9979 | |
| PEG + K3C6H5O7/C6H8O7 + water | |||||
| 600 | 7.0 | 149.8 ± 2.4 | -0.398 ± 0.006 | 3.3 ± 0.19 | 0.9975 |
| 1000 | 7.0 | 179.4 ± 8.4 | -0.480 ± 0.016 | 4.8 ± 0.41 | 0.9961 |
Table 2.
Experimental TLs (tie-lines) and TLLs (tie-lines length) of ABS composed of C6H5K3O7/C6H8O7 and PEG.
| Weight fraction composition / (wt %) | |||||||
|---|---|---|---|---|---|---|---|
| PEG 400 + K3C6H5O7/C6H8O7 + water | |||||||
| pH | [PEG]PEG | [salt]PEG | [PEG]M | [salt]M | [PEG]salt | [salt]salt | TLL |
| 5.0 | 41.56 | 18.86 | 30.01 | 29.99 | 9.93 | 49.38 | 43.96 |
| 54.60 | 12.43 | 35.00 | 29.99 | 6.70 | 55.36 | 64.33 | |
| 6.0 | 42.57 | 14.74 | 29.96 | 25.02 | 14.54 | 37.87 | 37.87 |
| 45.94 | 13.52 | 29.99 | 29.85 | 8.60 | 51.76 | 53.45 | |
| 7.0 | 38.35 | 13.82 | 29.72 | 19.92 | 21.39 | 25.80 | 20.76 |
| 45.44 | 10.79 | 29.75 | 25.20 | 8.13 | 45.03 | 50.63 | |
| 49.27 | 9.46 | 29.98 | 29.97 | 3.50 | 58.13 | 66.80 | |
| 36.00 | 15.02 | 25.28 | 24.75 | 13.50 | 35.45 | 30.38 | |
| 48.82 | 9.61 | 25.22 | 34.66 | 3.03 | 60.09 | 68.15 | |
| 67.33 | 5.10 | 40.08 | 30.01 | 2.09 | 64.73 | 88.38 | |
| 8.0 | 53.36 | 4.32 | 25.06 | 24.99 | 1.09 | 42.50 | 64.72 |
| 64.69 | 2.19 | 30.13 | 29.84 | 0.06 | 53.90 | 82.77 | |
| PEG + K3C6H5O7/C6H8O7 + water at pH 7.0 | |||||||
| PEG | [PEG]PEG | [salt]PEG | [PEG]M | [salt]M | [PEG]salt | [salt]salt | TLL |
| 600 | 73.68 | 3.16 | 30.17 | 25.92 | 1.19 | 41.08 | 81.81 |
| 74.70 | 3.04 | 30.13 | 30.33 | 0.21 | 48.66 | 87.35 | |
| 63.64 | 4.57 | 29.98 | 19.99 | 6.19 | 30.88 | 63.18 | |
| 60.27 | 5.15 | 25.01 | 25.02 | 2.14 | 37.89 | 66.71 | |
| 86.69 | 1.87 | 35.05 | 24.96 | 1.47 | 39.96 | 93.34 | |
| 1000 | 57.95 | 5.45 | 29.95 | 25.09 | 0.05 | 46.04 | 70.70 |
| 59.43 | 5.21 | 29.94 | 30.03 | 0.00 | 55.16 | 77.63 | |
| 46.49 | 7.64 | 29.97 | 20.06 | 0.04 | 46.87 | 60.80 | |
| 58.47 | 5.37 | 35.05 | 25.03 | 0.00 | 54.44 | 76.33 | |
| 41.72 | 8.79 | 25.04 | 25.00 | 0.01 | 49.29 | 58.13 | |
Fig. 3.
Phase diagram for the system composed of PEG 400 + K3C6H5O7/C6H8O7 + H2O at 25ºC and pH 7.0: binodal curve data (■); TL data (●); adjusted binodal data using Equation 1 (—).
Extraction of commercial ovalbumin
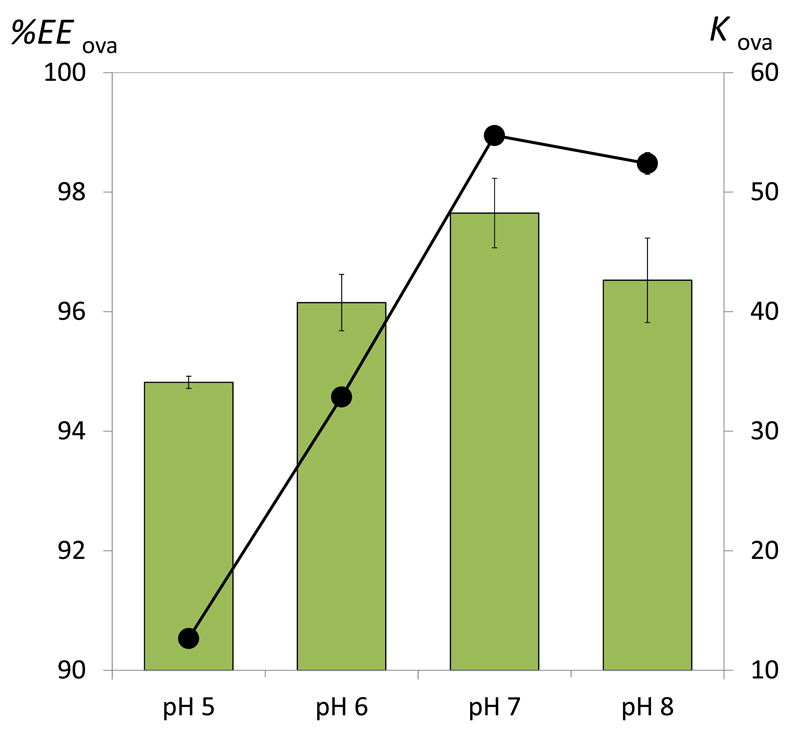
Fig. 4 shows the partitioning of commercial ovalbumin, expressed both in partition coefficient and in extraction efficiency, in an ABS composed of PEG 400 and C6H5K3O7/C6H8O7 at different pH values. All these experiments were carried out at a common mixture composition (30 wt% of PEG 400 + 30 wt% of C6H5K3O7/C6H8O7). For all investigated systems, ovalbumin preferentially migrates to the top phase (PEG-rich phase) with KOva > 1. The partition coefficients range between 12.67 and 54.74 and the extraction efficiencies between 94.8 and 97.7%. Amongst the pH values investigated, the higher partition coefficients and extraction efficiencies were obtained with the buffered systems at pH 7 and 8. Given that the isoelectric point of ovalbumin is 4.5 [5], in all systems evaluated the protein is negatively charged. In PEG–salt ABS it has been reported that proteins prefer the top or the bottom phase depending on the nature of the phase forming-components and their concentration [41–42]. At pH 7.0, ovalbumin is negatively charged (isoelectric point = 4.5 [5] and still prefers the phase of lower ionic strength (polymer-rich) in all systems evaluated. Based on the overall results, the salting-out effect exerted by the salt plays an important role since the higher extraction efficiencies for the polymer-rich phase were obtained at higher pH values – those in which the amount of the strongest salting-out species (C6H5O73-) is higher.
Fig. 4.
Influence of the pH in the extraction efficiency (EEOva%, bars) and partition coefficient (KOva, symbols) of ovalbumin in ABS composed of 30 wt% of PEG 400 + 30 wt% of K3C6H5O7/C6H8O7 ABS at 25ºC and different pH values.
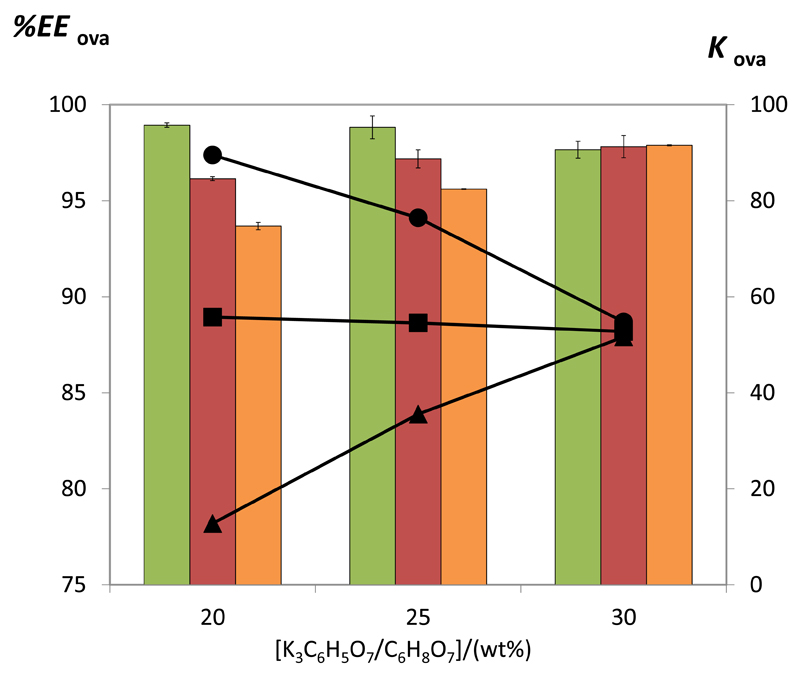
Given that the best results were obtained at pH 7-8 (which further imply a lower loss of the target protein for the opposite phase and higher recovery yields), further mixtures at pH 7 for various concentrations of PEG 400, 600 and 1000 (from 20 to 30 wt%) and K3C6H5O7/C6H8O7 (from 25 to 35 wt%) were investigated and their impact on the protein partition evaluated. Fig. 5 depicts the effect of the salt concentration. Interestingly, depending on the PEG employed, opposite trends are observed. An increase in the salt content leads to an increase in the partition coefficients and extraction efficiencies of ovalbumin for the polymer-rich phase in systems composed of PEG 1000 while the opposite effect is observed with PEG 400. With ABS constituted by PEG 600 there are no major differences on the partition coefficients and extraction efficiencies as a function of the salt concentration. Therefore, there is a combined effect of the forces acting on the protein migration in ABS composed of polymers of different molecular weight. For ABS composed of PEG of higher molecular weight, an increase in the salt content supports the salting-out of the protein (exerted by the citrate-based salt) favoring thus its migration for the polymer-rich phase. The volume exclusion effects derived from the high molecular weight polymers do not seem to play a significant role, whereas higher amounts of salt seem to exert a large effect on the protein preferential migration. On the other hand, for more hydrophilic polymers, i.e. those of lower molecular weight, an increase in the salt content is not favorable for the proteins migration for the phase of lower ionic strength. According to the TLs data given in Table 2, the amount of PEG 1000 in the salt-rich phase is almost negligible, supporting thus the salting-out mechanism exerted by the citrate-based salt and favorable protein-PEG hydrophobic interactions, while for PEG 400 an increase in the salt content leads to a decrease of the PEG amount at the salt-rich phase, with its concomitant increase at the polymer-rich phase, which seems to be not favorable for the preferential protein partitioning. Nevertheless, for an ABS constituted by 30 wt% of salt and 30 wt% of polymer there are no major differences in the partition coefficients and extraction efficiencies afforded by PEGs of different molecular weight. Even so, in all the evaluated situations, ovalbumin preferentially migrates to the most hydrophobic-(PEG)-rich phase confirming that protein-polymer interactions and salting-out effects play a significant role.
Fig. 5.
Extraction efficiency (EEOva%, bars) and partition coefficient (KOva, symbols) of ovalbumin in ABS composed of 30 wt% of PEG 400 (green bars and ● ), PEG 600 (red bars and ■), and PEG 1000 (orange bars and ▲) and different concentrations of K3C6H5O7/ C6H8O7 at 25ºC and pH = 7.0.
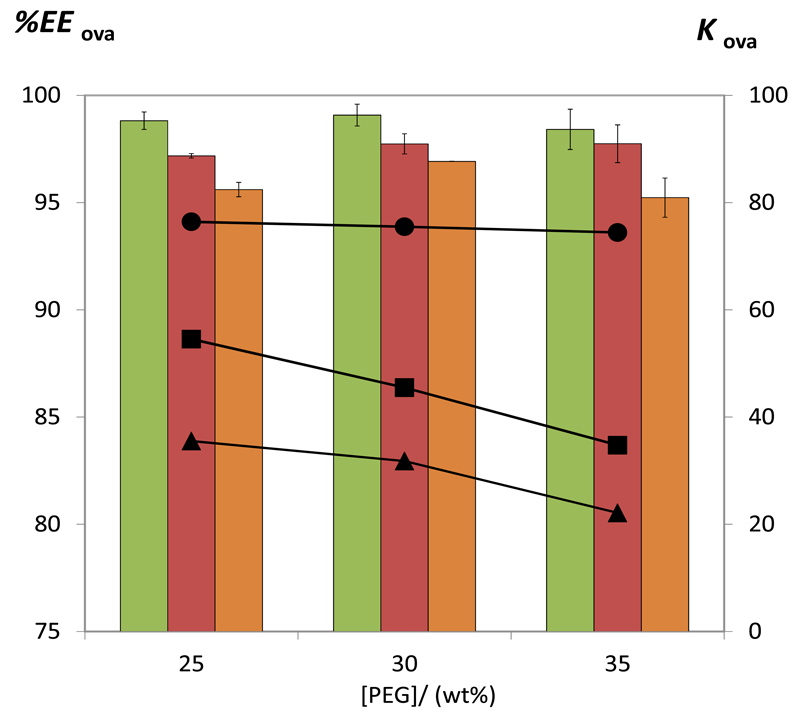
Fig. 6 shows the effect of the PEG concentration on the ovalbumin partitioning process. The ABS investigated are composed of 25 wt% of K3C6H5O7/C6H8O7 and PEG concentrations ranging from 25 to 35 wt%. At all concentrations, the partition coefficients decrease in the following order: PEG 400 > PEG 600 > PEG 1000 (based ABS). For PEG 600 and 1000, an increase in the PEG concentration leads to a decrease on both partition coefficients and extraction efficiencies of ovalbumin for the polymer-rich phase. At higher concentrations of PEG, ovalbumin starts to lose its affinity for the polymer-rich phase that is predominately less rich in water (cf. Table 2 with the TLs data). This effect is less notorious in systems composed of PEG 400 (the most hydrophilic polymer investigated), and therefore no major differences are observed amongst the partition coefficients and extraction efficiencies of ovalbumin at different concentrations of PEG 400.
Fig. 6.
Extraction efficiency (EEOva%, bars) and partition coefficient (KOva, symbols) of ovalbumin in ABS composed of 25 wt% of K3C6H5O7/C6H8O7 and different concentration of PEG 400 (green bars and ●), PEG 600 (red bars and ■), and PEG 1000 (orange bars and ▲) at 25ºC and pH = 7.0.
Extraction/separation of ovalbumin directly from egg white
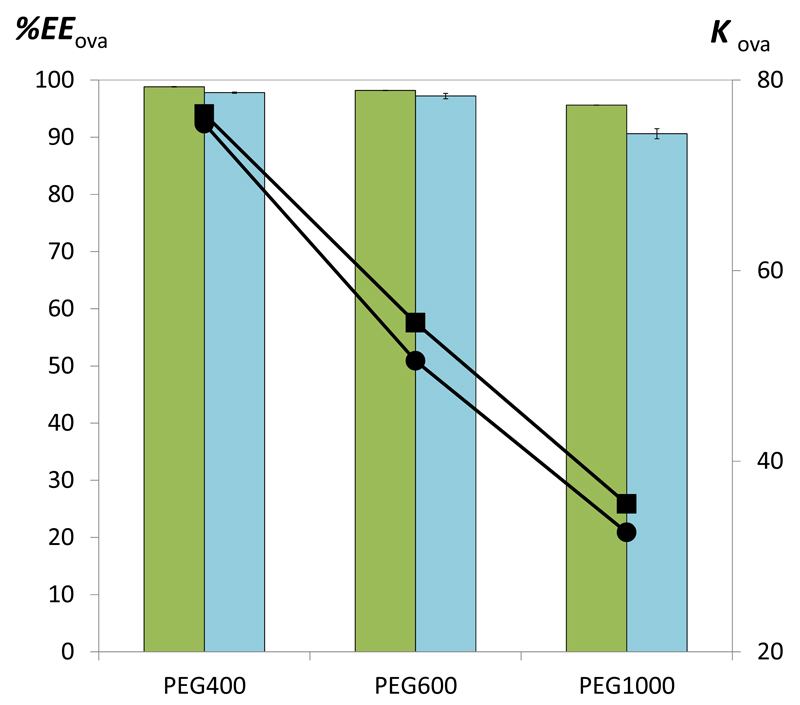
After optimizing the extraction/separation process with commercial ovalbumin, the ABS with better performance were then applied to extract and separate ovalbumin from a real matrix, egg white. A mixture composition (25 wt% of PEG + 25 wt% of K3C6H5O7/C6H8O7 (pH 7) + 50 wt% of an aqueous solution containing egg white at 1:10 (v:v)) was used and the effect of the molecular weight of PEG was evaluated. In all these experiments the pH was maintained at 7, since according to the previous optimization experiments carried out with commercial ovalbumin a lower loss of the target protein for the opposite phase was observed which imply higher recovery yields at pH 7. Several mixtures at pH 7 for various concentrations of PEG 400, 600 and 1000 (from 20 to 30 wt%) and K3C6H5O7/C6H8O7 (from 25 to 35 wt%) were investigated and their impact on the protein partition evaluated. The total amount of proteins in egg white, partition coefficients and extraction efficiency are provided in Supporting Information.. Fig. 7 depicts the partition coefficient and extraction efficiency values obtained for the total proteins extracted from egg white.
Fig. 7.
Extraction efficiency (EEOva%, bars) and partition coefficient (KOva, symbols) of commercial ovalbumin (green bars and ■) and proteins from egg white dissolved in water (1:10, v:v) (blue bars and ●) in ABS composed of 25 wt% of PEG + 25 wt% K3C6H5O7/C6H8O7 at 25ºC and pH = 7.0.
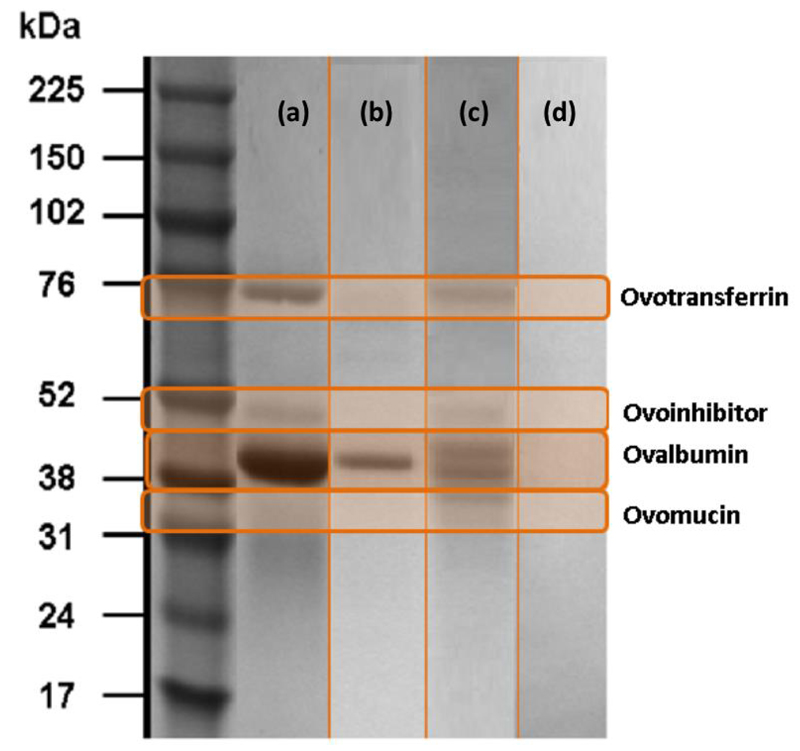
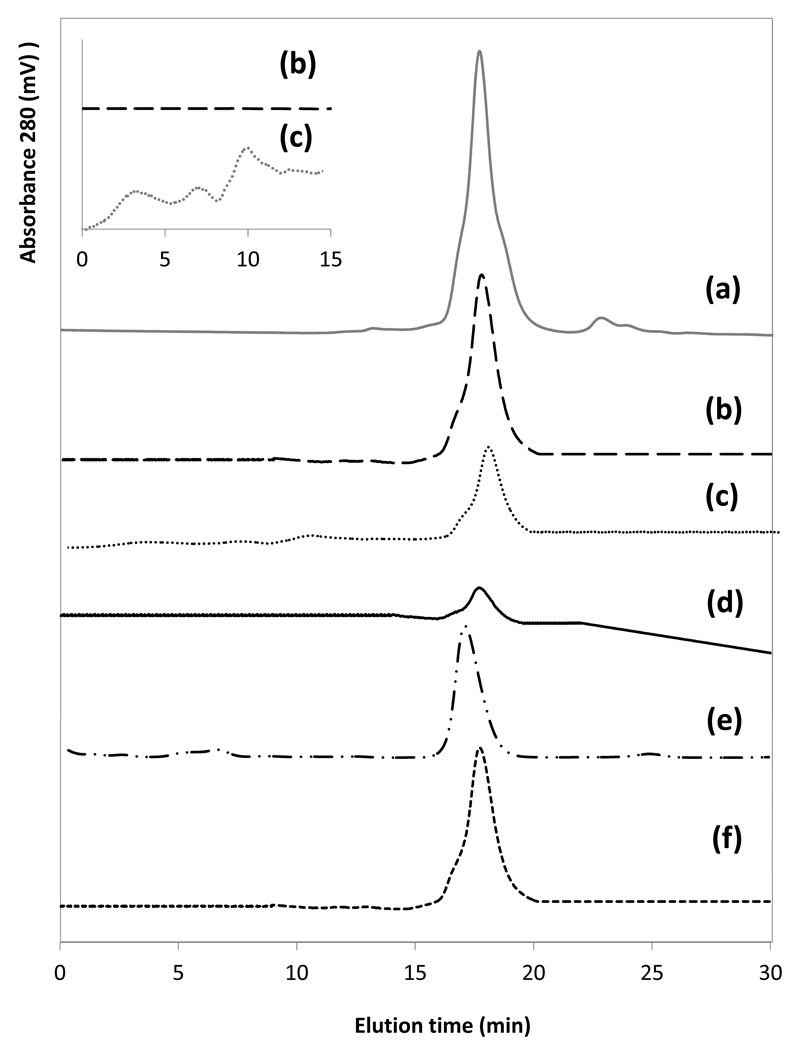
Although the partition coefficients and extraction efficiencies of commercial ovalbumin and the total protein extracted from egg white are similar, a large amount of precipitated proteins at the interface was observed when working with the water soluble fraction of proteins from egg white. Therefore, based on the UV spectroscopy quantification there are no guarantees that the protein extracted to the PEG-rich phase is preferentially ovalbumin. Therefore, all the coexisting phases and the precipitated proteins at the interface (after the respective recovery and re-suspension in a phosphate buffer solution) were analyzed by SDS-PAGE. It is visible from Fig. 8, that only ovalbumin is present in the PEG-rich phase whereas the contaminant proteins were precipitated at the interface. The precipitated proteins were identified according to molecular weight markers and are estimated to be ovotransferrin, ovoinhibitor, ovomucin and a smaller fraction of ovalbumin. Moreover, from the SE-HPLC chromatograms used for the proteins quantification, shown in Fig. 9, it can be concluded that only ovalbumin is present at the PEG-rich phase since no other peaks were identified (meaning that pure ovalbumin was obtained in the one-step ABS process). These SE-HPLC chromatograms also indicate that that there is no significant ovalbumin aggregation or fragmentation under the studied conditions since no other peaks where identified. Thus, and although polymers such as PEG are used in the precipitation and aggregation of proteins [43], the amount of water in the PEG-rich phase, as well as its low molecular weight, is favorable for maintaining a protein-friendly environment for ovalbumin. Previously, it was showed that chicken egg white lysozyme tends to cluster into aggregates in presence of PEG 1000 after incubation at 90 °C for 30 min [44–45]. At high temperatures, and due to the lower critical solution temperature behavior of PEG-water systems, there is a decrease on the hydration shell of the proteins [44–45]. In this work, the extractions were carried out at a low temperature, 25ºC, and using polymers of low molecular weight (from 400 to 1000 mol·kg-1).
Fig. 8.
SDS-PAGE of the (a) egg white in water (1:10 (v:v, egg white:buffer)), and (b) PEG–rich phase), (c) precipitated proteins re-dissolved in a buffer solution and (d) salt –rich phase of the ABS composed of 25 wt% of PEG 400 + 25 wt% of K3C6H5O7/C6H8O7 + 50 wt% of an egg white aqueous solution (1:10, v:v).
Fig. 9.
Size exclusion chromatograms of (a) egg white in water (1:10, v:v, egg white:buffer), (b) PEG–rich phase, (c) precipitated proteins re-dissolved in a buffer solution, (d) salt-rich phase of the ABS composed of 25 wt% of PEG 400 + 25 wt% of K3C6H5O7/C6H8O7 + 50 wt% of an egg white aqueous solution (1:10, v:v), (e) commercial ovalbumin; and (f) recovered ovalbumin after the purification and precipitation steps.
According to the quantification of ovalbumin in the coexisting phases of the system composed of 25 wt% of PEG 400 + 25 wt% of K3C6H5O7/C6H8O7 (pH 7) + 50 wt% of an aqueous solution containing egg white at 1:10 (v:v)) carried out by SE-HPLC, (32.6 ± 0.2)% of ovalbumin precipitates at the interface, whereas the remaining ovalbumin from egg white (64.8 ± 2.5)% is extracted and remains stable in the PEG-based ABS. Despite this loss in ovalbumin, no other proteins were detected by SE-HPLC at the PEG-rich phase, in agreement with the results obtained by SDS-PAGE. These results confirm that PEG-based ABS can be used for the extraction and purification of ovalbumin from egg white, with a recovery yield of 65%, supporting thus their viability for the extraction/purification of proteins from complex matrices. Moreover, it is shown that a simple and easily scalable single-step process can be used to purify ovalbumin from egg white without using sophisticated equipment, such as CCC or centrifugal partition chromatography (CPC) as previously attempted [27–29].
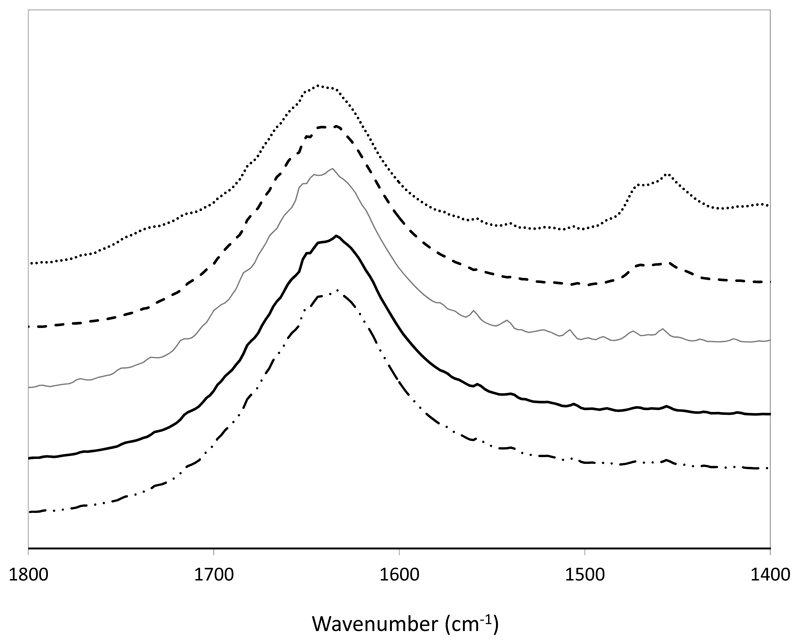
Fig. 10 display a FT-IR spectra of ovalbumin in water and in several aqueous solutions of PEG 400 at different concentrations (up to 50 wt%) in equilibrium for 12h. FT-IR spectroscopy provides information about the secondary structure of proteins based on energy absorption bands of their functional groups or chemical bonds. Most analyses are between 1690-1600 cm-1 (in the spectra range) for the specific investigation of the protein structure which corresponds to the vibration of the amide I group [46]. The results obtained show that aqueous solutions of PEG 400 do not change the absorbance peaks of amide I suggesting that the protein maintains its spatial structure in the PEG-rich phase.
Fig. 10.
FT-IR spectra of a standard aqueous solution containing ovalbumin (1 g.L-1) (──); ovalbumin in a 12.5 wt% PEG 400 aqueous solution (──); ovalbumin in a 25 wt% PEG 400 aqueous solution (-----); ovalbumin in a 50 wt% PEG 400 aqueous solution (⋅⋅–⋅⋅⋅–⋅⋅); and precipitated ovalbumin re-suspended in a buffer solution.
Recovery of ovalbumin from the PEG-rich phase
After the purification step, the ovalbumin recovery from the PEG-rich phase was achieved by an induced precipitation step, and separated by centrifugation at 4ºC. This procedure was adapted from literature and is based on the low solubility of proteins in polymers aqueous solutions at low temperatures. The pellet obtained was then resuspended in a phosphate buffer solution (50mM and pH 7.4). This “new” aqueous solution rich in ovalbumin was further evaluated by FT-IR and SE-HPLC. The PEG-rich phase was also analyzed by SE-HPLC confirming the complete precipitation of ovalbumin. According to the FT-IR results, shown in Fig. 10, there are no changes in the absorbance peaks of amide I suggesting that the recovered protein maintained its structure. Moreover, from the SE-HPLC results, depicted in Fig. 9, the recovered protein does not present the formation of aggregates or even complexation (monomers and dimers). A comparison between the chromatograms of commercial ovalbumin and the extracted, purified and isolated ovalbumin from egg yolk achieved in this work is also provided in Fig. 9. In summary, the obtained results confirm the viability of using the proposed ABS for the extraction of ovalbumin from egg white and a following precipitation step for its recovery from the PEG-rich phase. This “cleaning” step also allows the reuse of the coexisting phases of ABS for further purification stages.
Since ABS separations do not require a solid support matrix, adsorptive loss and denaturation of proteins are minimized, as previously confirmed by the stability studies of the recovered protein. According to the identification and quantification of ovalbumin and remaining proteins (by SDS-PAGE and SE-HPLC) in the coexisting phases of the optimized system, only ovalbumin is present at the PEG-rich phase while the remaining and contaminant proteins present in egg white precipitate at the interface. If only ovalbumin is identified at the PEG-rich phase it thus confirms the selective nature of the studied systems for albumin and their ability to act as purification routes, with a recovery yield of (64.8 ± 2.5)% of the total ovalbumin present in egg white.
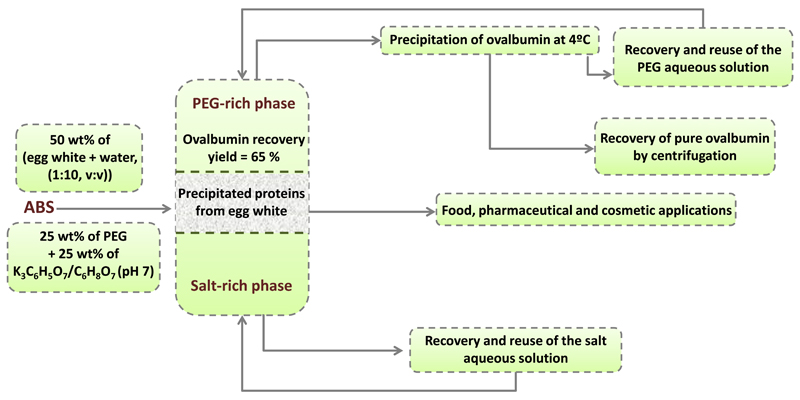
Only three works [27–29] were found in the literature with values of ovalbumin purity similar to those found in this work (indeed 100% pure ovalbumin by the use of ABS) while working with a real egg white matrix. Shibusawa et al. [27–28] separated the proteins present in chicken egg white by counter-current chromatography (CCC) and high-speed counter-current chromatography (HSCCC) using ABS composed of 16 wt% of PEG 1000 and 12.5% wt% of K2HPO4. The authors [27–28] separated ovotransferrin, ovalbumin, ovomucin and lysozyme by collecting different fractions at different times of elution and by applying reverse modes when required. Zhi et al. [29] successfully purified ovalbumin from hen egg white using an ABS formed by 16 wt% of PEG 1000 and 17 wt% of K3PO4 at pH 9.2 with HSCCC, using the PEG-rich phase as the stationary phase. CCC is essentially a form of liquid-liquid partition chromatography. Amongst other chromatographic, the method does not require the use of a solid support as the stationary phase; instead, one of the ABS phases acts as the stationary phase by being retained in the column by gravity or centrifugal force. In CPC (centrifugal partition chromatography) and CCC it is necessary first to equilibrate the ABS in a separatory funnel and then to separate the two phases for further use as mobile and stationary phases. Also, individual partition coefficients (in separated experiments) need to be determined first for each protein to optimize the chromatographic conditions. In this context, and according to our results, the major novelty of our work consists on the development of a simpler, cheaper and less time-consuming method that does not require the use of chromatographic equipment. In fact, in our work, only one stage of equilibrium is required to successfully separate ovalbumin from the remaining proteins in egg white. Contrarily to previous works [27–29], we also used a lower molecular weight polymer (PEG 400 instead of PEG 1000) and a biodegradable and less toxic salt (citrate-based instead of phosphate-based) which could justify the high performance obtained in a single-step ABS separation without requiring the multiple stages of equilibrium occurring in CPC and CCC. Finally, we were also able to demonstrate the recovery of ovalbumin from the PEG-rich phase and the viability of recovering and reusing the coexisting phases, which certainly decreases the cost of the process and increases its sustainable nature. In summary, in this work, it is shown that a simple and easily scalable and recyclable single-step process can be used to purify ovalbumin from egg white without requiring the use of sophisticated chromatographic equipment. The flowchart of the developed process for purifying ovalbumin directly from egg white is shown in Fig. 11. The developed process allows to purify ovalbumin from a crude sample solution prepared from fresh egg white, in an one-step operation and in a relatively short time.
Fig. 11.
Flow chart of the developed process for the purification of ovalbumin from egg white.
Conclusions
The extraction and purification of ovalbumin using a cost-effective method based on ABS formed by polymers and a salt, followed by a precipitation step for the protein recovery, is here proposed. The ABS phase diagrams were initially determined, at different pH values and with PEGs of different molecular weight, to ascertain on the biphasic/monophasic regimes. These two-phase systems where then employed in studies concerning the partition of commercial ovalbumin aiming at identifying the best ABS. In all model systems, ovalbumin preferentially migrates to the PEG-rich phase and the best results were obtained with PEGs of lower molecular weight and at pH 7. Extraction efficiencies of ovalbumin for the PEG-rich up to 98.9% were attained in a single-step. After the optimization study conducted with the model systems using a standard solution of ovalbumin, the enhanced ABS were then applied in the extraction and purification of ovalbumin from egg white. The extraction efficiency values obtained range between 90.6% and 97.8%. The separation of albumin was also confirmed by SDS-PAGE and SE-HPLC analysis in the extraction carried out with the ABS constituted by PEG 400. The systems investigated reveal to be a promising approach to extract ovalbumin from egg white since all contaminant proteins precipitate at the interface while ovalbumin selectively migrates tothe polymer-rich phase. The complete purification of ovalbumin from egg white with a recovery yield of 65% was achieved in one-step using an ABS composed of 25 wt% of PEG 400 + 25 wt% of K3C6H5O7/C6H8O7 + 50 wt% of an egg white aqueous solution (1:10, v:v). An induced precipitation step was also optimized to allow the recovery of the protein from the polymer-rich phase aiming at guarantying its further applicability while decreasing the cost of the overall process and enhancing its sustainable nature. The protein stability after the recovery step was confirmed by FT-IR and SE-HPLC. In summary, in this work, it was shown that a simple and easily scalable and recyclable single-step process can be used to purify ovalbumin from egg white without requiring the use of sophisticated chromatographic equipment.
Supplementary Material
Acknowledgements
This work was developed within the scope of the project CICECO-Aveiro Institute of Materials, POCI-01-0145-FEDER-007679 (FCT Ref. UID /CTM /50011/2013), financed by national funds through the FCT/MEC and when appropriate co-financed by FEDER under the PT2020 Partnership Agreement. The research leading to reported results has received funding from the European Research Council under the European Union’s Seventh Framework Programme (FP7/2007-2013)/ERC grant agreement no. 337753. M. M. Pereira acknowledges the PhD grant (2740-13-3) and financial support from Coordenação de Aperfeiçoamento de Pessoal de Nível Superior - Capes.
References
- [1].Omana D, Wang J, Wu J. Co-extraction of egg white proteins using ion-exchange chromatography from ovomucin-removed egg whites. J Chromatogr B. 2010;878:1771–1776. doi: 10.1016/j.jchromb.2010.04.037. [DOI] [PubMed] [Google Scholar]
- [2].Mine Y. Recent advances in the understanding of egg white protein functionality. Trends Food Sci Technol. 1995;6:225–232. [Google Scholar]
- [3].Geng F, Huang Q, Wu X, Ren G, Shan Y, Jin G. Co-purification of chicken egg white proteins using polyethylene glycol precipitation and anion-exchange chromatography. Sep Purif Technol. 2012;96:75–80. [Google Scholar]
- [4].Croguennec T, Nau F, Pezennec S, Brule G. Simple rapid procedure for preparation of large quantities of ovalbumin. J Agric Food Chem. 2000;48:4883–4889. doi: 10.1021/jf991198d. [DOI] [PubMed] [Google Scholar]
- [5].Stein PE, Leslie AGW, Finch JT, Turnell WG, McLaughlin PJ, Carrell RW. Crystal structure of ovalbumin as a model for the reactive centre of serpins. Nature. 1990;347:99–102. doi: 10.1038/347099a0. [DOI] [PubMed] [Google Scholar]
- [6].Shah RR, Dodd S, Schaefer M, Ugozzoli M, Singh M, Otten GR. The development of self-emulsifying oil-in-water emulsion adjuvant and an evaluation of the impact of droplet size on performance. J Pharm Sci. 2015:1–10. doi: 10.1002/jps.24337. [DOI] [PubMed] [Google Scholar]
- [7].Borde A, Ekman A, Holmgren J, Larsson A. Effect of protein release rates from tablet formulations on the immune response after sublingual immunization. Eur J Pharm Sci. 2012;47:695–700. doi: 10.1016/j.ejps.2012.08.014. [DOI] [PubMed] [Google Scholar]
- [8].Misaka S, Sato H, Yamauchi Y, Onoue S, Yamada S. Novel dry powder formulation of ovalbumin for development of COPD-like animal model: Physicochemical characterization and biomarker profiling in rats. Eur J Pharm Sci. 2009;37:469–476. doi: 10.1016/j.ejps.2009.04.002. [DOI] [PubMed] [Google Scholar]
- [9].Bernkop-Schnurch A, Gabor F, Szostak MP, Lubitz W. An adhesive drug delivery system based on K99-fimbriae. Eur J Pharm Sci. 1995;3:293–299. [Google Scholar]
- [10].Hopkins FG. On the separation of a pure albumin from egg-white. J Physiol. 1900;25:306–330. doi: 10.1113/jphysiol.1900.sp000799. [DOI] [PMC free article] [PubMed] [Google Scholar]
- [11].Desert C, Guérin-Dubiard C, Nau F, Jan G, Val F, Mallard J. Comparison of different electrophoretic separations of hen egg white proteins. J Agric Food Chem. 2001;49:4553–4561. doi: 10.1021/jf001423n. [DOI] [PubMed] [Google Scholar]
- [12].Datta D, Bhattacharjee S, Nath A, Das R, Bhattacharjee C, Datta S. Separation of ovalbumin from chicken egg white using two-stage ultrafiltration technique. Sep Purif Technol. 2009;66:353–361. [Google Scholar]
- [13].Awadé AC, Moreau S, Mollé D, Brulé G, Maubois J-L. Two-step chromatographic procedure for the purification of hen egg white ovomucin, lysozyme, ovotransferrin and ovalbumin and characterization of purified proteins. J Chromatogr A. 1994;677:279–288. doi: 10.1016/0021-9673(94)80156-8. [DOI] [PubMed] [Google Scholar]
- [14].Chiu H, Lin J, Cheng T, Chou S, Huang C. Direct purification of lysozyme from chicken egg white using weak acidic polyacrylonitrile nanofiber-based membranes. J Appl Poly Sci. 2012;125:616–621. [Google Scholar]
- [15].Chiang BH, Su CK, Tsai GJ, Tsao GT. Egg white lysozyme purification by ultrafiltration and affinity chromatography. J Food Sci. 1993;58:303–306. [Google Scholar]
- [16].Tong X-D, Dong X-Y, Sun Y. Lysozyme adsorption and purification by expanded bed chromatography with a small-sized dense adsorbent. Biochem Eng J. 2002;12:117–124. [Google Scholar]
- [17].Ghosh R, Silva SS, Cui Z. Lysozyme separation by hollow-fibre ultrafiltration. Biochem Eng J. 2000;6:19–24. doi: 10.1016/s1369-703x(00)00069-3. [DOI] [PubMed] [Google Scholar]
- [18].Oliveira FC, Coimbra JSR, da Silva LH Mendes, Rojas EEG, Silva MCH. Method development for direct recovery of lysozyme from highly crude chicken egg white by stirred fluidized bed technique. Biochem Eng J. 2006;30:63–75. [Google Scholar]
- [19].Albertsson PA. Partition of cell particles and macromolecules: separation and purification of biomolecules, cell organelles, membranes, and cells in aqueous polymer two-phase systems and their use in biochemical analysis and biotechnology. 3rd. Wiley; 1986. [Google Scholar]
- [20].Saravanan S, Rao JR, Nair BU, Ramasami T. Aqueous two-phase poly(ethylene glycol)–poly(acrylic acid) system for protein partitioning: Influence of molecular weight, pH and temperature. Proc Biochem. 2008;43:905–911. [Google Scholar]
- [21].Nerli B, Espariz M, Picó G. Thermodynamic study of forces involved in bovine serum albumin and ovalbumin partitioning in aqueous two-phase systems. Biotechnol Bioeng. 2001;72:468–474. doi: 10.1002/1097-0290(20000220)72:4<468::aid-bit1008>3.0.co;2-l. [DOI] [PubMed] [Google Scholar]
- [22].Dallora NLP, Klemz JGD, Pessôa Filho PA. Partitioning of model proteins in aqueous two-phase systems containing polyethylene glycol and ammonium carbamate. Biochem Eng J. 2007;34:92–97. [Google Scholar]
- [23].Coen CJ, Prausnitz JM, Blanch HW. Protein salting-out: phase equilibria in two-protein systems. Biotechnol Bioeng. 1997;53:567–574. doi: 10.1002/(SICI)1097-0290(19970320)53:6<567::AID-BIT4>3.0.CO;2-K. [DOI] [PubMed] [Google Scholar]
- [24].Su C-K, Chiang BH. Partitioning and purification of lysozyme from chicken egg white using aqueous two-phase system. Proc Biochem. 2006;41:257–263. [Google Scholar]
- [25].Lu Y, Lu W, Wang W, Guo Q, Yang Y. The optimization of aqueous two-phase extraction of lysozyme from crude hen egg white using response surface methodology. J Chem Technol Biotechnol. 2013;88:415–421. [Google Scholar]
- [26].Diederich P, Amrhein S, Hämmerling F, Hubbuch J. Evaluation of PEG/phosphate aqueous two-phase systems for the purification of the chicken egg white protein avidin by using high-throughput techniques. Chem Eng Sci. 2013;104:945–956. [Google Scholar]
- [27].Shibusawa Y, Kihira S, Ito Y. One-step purification of proteins from chicken egg white using counter-current chromatography. J Chromatogr B. 1998;709:301–305. doi: 10.1016/s0378-4347(98)00071-1. [DOI] [PubMed] [Google Scholar]
- [28].Shibusawa Y, Iino S, Shindo H, Ito Y. Separation of chicken egg white by high-speed countercurrent chromatography. J Liq Chrom Rel Technol. 2001;24:2007–2016. [Google Scholar]
- [29].Zhi W-B, Deng Q-Y, Song J-N, Ouyang F. Purification of ovalbumin from hen egg white by high-speed counter-current aqueous two-phase chromatography. Chin J Biotechnol. 2005;21:129–134. [PubMed] [Google Scholar]
- [30].Roy I, Rao MVS, Gupta MN. An integrated process for purification of lysozyme, ovalbumin, and ovomucoid from hen egg white. Appl Biochem Biotechnol. 2003;111:55–63. doi: 10.1385/abab:111:1:55. [DOI] [PubMed] [Google Scholar]
- [31].Abeyrathne NS, Lee HY, Ahn DU. Sequencial separation of of lysozyme and ovalbumin form chicken egg white. Korean J Food Sci An. 2013;33:501–507. [Google Scholar]
- [32].Almeida MR, Passos H, Pereira MM, Lima ÁS, Coutinho JAP, Freire MG. Ionic liquids as additives to enhance the extraction of antioxidants in aqueous two-phase systems. Sep Purif Technol. 2014;128:1–10. [Google Scholar]
- [33].Pereira JFB, Lima ÁS, Freire MG, Coutinho JAP. Ionic liquids as adjuvants for the tailored extraction of biomolecules in aqueous biphasic systems. Green Chem. 2010;12:1661–1669. [Google Scholar]
- [34].Merchuk JC, Andrews BA, Asenjo JA. Aqueous two-phase systems for protein separation. Studies on phase inversion. J Chromatogr B. 1998;711:285–293. doi: 10.1016/s0378-4347(97)00594-x. [DOI] [PubMed] [Google Scholar]
- [35].Akita E, Nakai S. Comparison of four purification methods for the production of immunoglobulins from eggs laid by hens immunized with an enterotoxigenic E. coli strain. J Immunol Methods. 1993;160:207–214. doi: 10.1016/0022-1759(93)90179-b. [DOI] [PubMed] [Google Scholar]
- [36].Marcus Y. Thermodynamics of Solvation of Ions. J Chem Soc. 1991;87:2995–2999. [Google Scholar]
- [37].Hofmeister F. Arch Exp Pathol Pharmacol. 1888;24:247–260. [Google Scholar]
- [38].Freire MG, Pereira JFB, Francisco M, Rodríguez H, Rebelo LPN, Rogers RD, Coutinho JAP. Insight into the interactions that control the phase behaviour of new aqueous biphasic systems composed of polyethylene glycol polymers and ionic liquids. Chem Eur J. 2012;18:1831–1839. doi: 10.1002/chem.201101780. [DOI] [PubMed] [Google Scholar]
- [39].Rogers RD, Zhang J. Effects of increasing polymer hydrophobicity on distribution ratios of TcO4- in polyethylene/poly(propylene glycol)-based aqueous biphasic systems. J Chromatogr B. 1996;680:231–236. doi: 10.1016/0378-4347(95)00389-4. [DOI] [PubMed] [Google Scholar]
- [40].Piculell L, Lindman B. Association and segregation in aqueous polymer/polymer, polymer/surfactant, and surfactant/surfactant mixtures: similarities and differences. Adv Colloid Interf Sci. 1992;41:149–178. [Google Scholar]
- [41].Meller da Silva LH, Meirelles AJA. PEG + Potassium Phosphate + Urea Aqueous Two-Phase Systems: Phase Equilibrium and Protein Partitioning. J Chem Eng Data. 2001;46:251–255. [Google Scholar]
- [42].Cascone O, Andrews BA, Asenjo JA. Partitioning and purification of thaumatin in aqueous two-phase systems. Enzyme Microb Technol. 1991;13:629–635. [Google Scholar]
- [43].Rajan RS, Li T, Aras M, Sloey C, Sutherland W, Arai H. Modulation of protein aggregation by polyethylene glycol conjugation: GCSF as a case study. Protein Sci. 2006;15:1063–1075. doi: 10.1110/ps.052004006. [DOI] [PMC free article] [PubMed] [Google Scholar]
- [44].Muraoka T, Adachi K, Ui M, Kawasaki S, Sadhukhan N, Obara H. A structured monodisperse PEG for the effective suppression of protein aggregation. Angew Chem. 2013;52:2430–2434. doi: 10.1002/anie.201206563. [DOI] [PubMed] [Google Scholar]
- [45].Muraoka T, Sadhukhan N, Ui M, Kawasaki S, Hazemi E, Adachi K. Thermal-aggregation suppression of proteins by a structured PEG analogue: Importance of denaturation temperature for effective aggregation suppression. Biochem Eng J. 2014;86:41–48. [Google Scholar]
- [46].Barth A. Infrared spectroscopy of proteins. Biochim Biophys Acta. 2007;1767:1073–101. doi: 10.1016/j.bbabio.2007.06.004. [DOI] [PubMed] [Google Scholar]
- [47].Pereira MM, Pedro SN, Quental MV, Lima ÁS, Coutinho JAP, Freire MG. Enhanced extraction of bovine serum albumin with aqueous biphasic systems of phosphonium- and ammonium-based ionic liquids. J Biotechnol. 2015;206:17–25. doi: 10.1016/j.jbiotec.2015.03.028. [DOI] [PMC free article] [PubMed] [Google Scholar]
Associated Data
This section collects any data citations, data availability statements, or supplementary materials included in this article.


