Abstract
We examined the effectiveness of a heads-up Forward Collision Warning (FCW) system in 39 younger to middle aged drivers (25-50, mean = 35 years) and 37 older drivers (66-87, mean = 77 years). The warnings were implemented in a fixed based, immersive, 180 degree forward field of view simulator. The FCW included a visual advisory component consisting of a red horizontal bar which flashed in the center screen of the simulator that was triggered at time-to-collision (TTC) 4 seconds. The bar roughly overlapped the rear bumper of the lead vehicle, just below the driver's line-of-sight. A sustained auditory tone (~80 dB) was activated at TTC=2 to alert the driver to an imminent collision. Hence, the warning system differed from the industry standard in significant ways. 95% Confidence intervals for the safety gains ranged from −.03 to .19 seconds in terms of average correction time across several activations. Older and younger adults did not differ in terms of safety gains. Closer inspection of data revealed that younger to middle aged drivers were already braking (42%) on a larger proportion of FCW activations than older drivers (26%), p < .001. Conversely, older drivers were still accelerating (38%) on a larger proportion of FCW activations than younger to middle aged drivers (23%) at the time FCW was activated, p < .009. There were no differences in the proportion of activations when drivers were coasting at the time FCW was activated, p = .240. Furthermore, large individual differences in basic visual, motor, and cognitive function predicted the tendency to brake prior to FCW activation. Those who tended to be better functioning in each of these domains were more likely to be already braking prior to FCW activation at the fixed threshold of TTC=4. These findings suggest optimal timing for advisory alerts for forward events may need to be larger than TTC=4.
INTRODUCTION
Extending the mobility of a growing aging population safely has relevance to public health and injury prevention. Aging drivers are at increased risk for crashes [1] and emerging technologies that incorporate Advanced Driver Assist systems (ADAS) hold a particular promise in compensating for declining capacities of elderly to extend safe mobility in later years. Rear-end collisions are among the most common crashes in the US [2] and forward collision warning (FCW) systems are designed to reduce incidence of these types of crashes.
Relatively recent Insurance Institute for Highway Safety (IIHS) data suggest that vehicle models equipped with autonomous braking are associated with reduction in insurance claims. Data on similar vehicle models without autonomous braking feature suggest benefits of FCW maybe more limited [3]. One of the challenges in designing a FCW without the added benefits of autonomous braking is to determine the timing of the initial alert. Ideally, the timing of the alert would adjust for or factor in both the risk tolerance preferences and the capabilities of the driver in responding to a forward event. For example, aging drivers would be expected to react more slowly than younger to middle aged drivers owing to declines in visual, motor, and cognitive function typical of aging [4], hence alerts that would be effective for older drivers would have to be presented earlier.
Our goal in this study was to evaluate the effectiveness of an idealized FCW that differed from industry standards in significant ways especially with respect to its visual components, examine individual differences in profiles of pedal behavior at the time of FCW activation, and ask whether basic visual, motor, and cognitive functioning predicted pedal behavior and effectiveness as measured by reaction time to turn FCW off. Figure 1 illustrates the FCW we implemented in a fixed-based simulator.
Figure 1.
Illustration of the FCW visuals. As the participant nears a vehicle ahead (depicted left to right), the size of the ‘red’ visual rectangle increases as a function of the increase in time-to-collision (TTC) value. When TTC <= 2.0 seconds, the visual is at its largest and is accompanied by a beeping tone to alert the driver to imminent danger. FCW system was only active at speeds above 5 mph to avoid over-alerting when approaching other vehicles at an intersection or in low speed traffic.
The advisory component of the FCW consisted of a red horizontal bar appearing in the center channel. The spatial position of the bar roughly overlapped the rear bumper of the lead vehicle, allowing the observer's attention to be rapidly drawn to the area of the environment where corrective action is needed. We elected to manipulate length and width of the visual icon because it creates a powerful sense of looming. This form of motion has been demonstrated to be a powerful attractor of attention in the literature [5]. A combination of driver manual recommendations and prior research [6,7,8] suggested a TTC of 4 seconds may be large enough to accommodate the declining reaction time of older drivers to forward-critical events. Hence the visual warning appeared when TTC reached 4 seconds. When TTC was reduced to 2 seconds or less, a sustained auditory tone was added to indicate an imminent crash.
To address the question of safety gains, younger to middle aged drivers and older drivers completed two versions of the same drive once with warnings turned on and once with warnings turned off. We included measures of both average reaction time (RT) to increase distance to greater than TTC = 4 and turn off FCW, total time drivers were exposed to FCW, and number of times they activated FCW. In addition, for each activation of FCW we tracked pedal behavior of the drivers as being in one of the three states: already braking, already costing, or still accelerating. These measures were tracked identically whether the participants actually saw the FCW or not. To gauge the appropriateness of TTC=4 threshold and functional significance of pedal behavior at the time of FCW activation, we examined these driving measures in relation to extensive assessments of basic visual, motor, and cognitive functioning.
METHODS
Sample
The sample consisted of 39 younger to middle-aged and 37 older drivers. The younger to middle aged drivers were 25 to 50 years old (mean = 35 years), and consisted of 18 males and 21 females. The older drivers were 66 to 87 years old (mean = 77 years), and consisted of 23 males and 14 females. Inclusion criteria included: a) valid driver's license, b) minimum 10 years of driving experience, c) driving at least 1 hour or 50 miles per week, d) negative screen for dementia (MoCA > 18) [9], and e) corrected visual acuity better than 20/50. 35% of the sample scored in the Mild Cognitive Impairment range and the remaining scored normal on MoCA. 86% of the sample was white. Educational achievement was distributed as follows: 7% had high school or less, 45% had less than college degree, 45% had a college degree or more, others did not indicate education level.
Procedure and Design
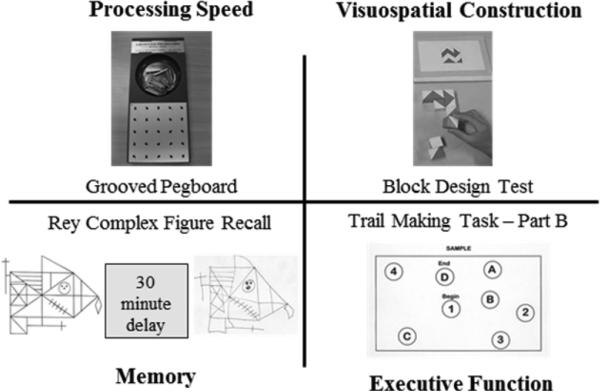
Following basic visual function and dementia screening, participants took a simulator drive (fixed base, full cabin with 180° FOV, DriveSafety RS600) to assess motion sickness. Of those tested in the simulator, 28 got motion sick and were not part of the 76 whose data were analyzed here. The remainder participated in detailed assessments of their cognitive function including processing speed, memory, and visuospatial construction during a second visit (see Figure 2). In four additional visits scheduled 2 weeks apart, participants took eight simulated drives that took 15-18 minutes to complete designed to examine long-term adaptation to warning systems that included in addition to FCW, also a lane deviation warning and lane change/merge warning. The data from the other warning systems were not examined in this report. This report also did not address long-term adaptation to FCW. In each of the four visits, participants were exposed to the warnings-on version and warnings-off version of the same drive (i.e. same layout, with same hazards differing only in whether the warnings were turned off (not visible to driver) or on (visible to driver). The order of presentation was randomized and counterbalanced both with respect to: a) whether they experienced the no-warn or the warn version of the drive first in each of four visits b) which of the four distinct drive layouts they first experienced. The drive layouts were similar in terms of tile composition with respect to road culture, total time (15-18 minutes each), and number of hazards encountered.
Figure 2.
Examples of tasks used to measure each of the cognitive function domains; processing speed, visuospatial construction, memory, and executive function.
Measures and Statistical Analyses
Assessments of Functioning
A battery of standardized tests measuring basic visual function [10,11], motor function[12,13,14], and extensive assessment of cognitive functioning were administered [15, 16]. The assessments took approximately 2.5 to 3 hours. Figure 2 illustrates some of the tests in the cognitive battery.
Table 1 lists the specific tests included in the basic visual and motor function domains. Table 2 lists the specific tests that were included in each of the four cognitive functioning domains: processing speed, visuospatial construction, memory, and executive functioning. The assignment of the tasks to these four cognitive domains was guided by a confirmatory factor analytic study [17]. The raw scores obtained from the each of the tests were standardized with zscore transforms and then averaged to form composite scores following prior practices.
Table 1.
A listing of the specific tests used to measure functioning in basic visual and motor function
| Tests | |
|---|---|
| Visual Function | Near and far visual acuity, contrast sensitivity |
| Motor Function | Get-up & Go, Functional Reach |
Table 2.
A listing of the specific tests used to measure functioning in each of the domains of cognitive functioning
| Domains of cognition | Tests |
|---|---|
| Processing Speed | Grooved Pegboard, Useful Field of View Total score, Trail Making Test-Part A |
| Visuospatial construction | Complex Figure-Copy, Line Orientation, Block Design |
| Memory | Controlled Oral Word Association, Complex Figure-Recall, Auditory Verbal Learning Test-30 minute Recall |
| Executive Function | Trail Making Test -Part B, Wisconsin Card Sort Test perseveration errors |
Driving Performance Measures
The following measures were extracted from the drive files: Total exposure to FCW in a given drive, number of FCW activations, time it took participants to turn FCW off in seconds (correction RT). Number of activations, and time it took a participant to turn off FCW were computed in each drive and then averaged across all available drives. In addition, participants pedal behavior at the time FCW was activated was tracked as being in one three states: already braking, already coasting, or still accelerating. The pedal behavior was used to compute a proportion score reflecting the percentage of FCW activations in which the participant was in one of these three states to quantify individual differences in headway keeping. These proportion scores were also averaged across all available drives.
RESULTS
A 2 × 2 mixed ANOVA was performed on each of these driving performance measures to examine in detail both the effectiveness of FCW and pedal use patterns to maintain headway for younger to middle aged drivers and older drivers. Warning status served as the within-subject factor, and age group as the between subject factor. The descriptive statistics from the cells of this design are shown in Table 3 through Table 8.
Table 3.
Descriptive statistics for each cell in the study design for Total Exposure measure
| Warnings On M (SD) | Warnings Off M (SD) | ||
|---|---|---|---|
| Younger to middle aged drivers (n=39) | 7.962 (3.26) | 8.139 (3.62) | 8.051 (3.04) |
| Older drivers (n=37) | 7.589 (3.23) | 8.117 (3.21) | 7.853 (3.04) |
| 7.780 (3.23) | 8.129 (3.41) |
Table 8.
Cell statistics for percent of activations when drivers were still accelerating at the time FCW was activated.
| Warnings On M (SD) | Warnings Off M (SD) | ||
|---|---|---|---|
| Younger to middle aged drivers (n=39) | 21.422 (15.74) | 24.900 (11.65) | 23.20 (12.49) |
| Older drivers (n=37) | 39.036 (19.53) | 37.650 (18.19) | 38.30 (12.77) |
| 29.997 (19.68) | 31.110 (16.39) |
The 2X2 mixed design ANOVA on Total Exposure to FCW did not show any significant main effect of warning status, p = .305, or a main effect of age group, p = .778, or an interaction effect of warning status by age group, p = .611. As can be seen from the cell means in Table 3, total exposure across 15-18 minute drives was very brief, 95% Confidence Intervals (CI) for the measure ranged from 7 to 9 seconds in both warnings-on and off drives. Older driver exposure was not different than the younger to middle aged drivers, and FCW affected both groups similarly on this measure.
The 2X2 mixed design ANOVA on number of FCW activations did not show any significant main effect of warning status, p = .961, or a main effect of age group, p = .170, or an interaction effect of warning status by age group, p = .525. Table 4 shows cell statistics. 95% CIs indicated that FCW was activated between 5.5 and 6.5 times. Patterns of FCW activation was similar for both age groups whether warnings were turned on or not.
Table 4.
Descriptive statistics for each cell in the study design for number of FCW activations.
| Warnings On M (SD) | Warnings Off M (SD) | ||
|---|---|---|---|
| Younger to middle aged drivers (n=39) | 5.581 (1.65) | 5.730 (2.27) | 5.657 (1.97) |
| Older drivers (n=37) | 6.349 (2.61) | 6.220 (2.03) | 6.285 (1.97) |
| 5.950 (2.19) | 5.97 (2.15) |
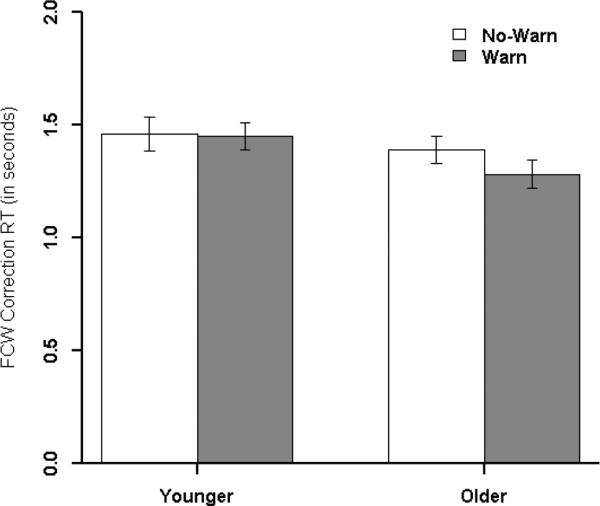
The 2X2 mixed design ANOVA on time it took the participants to turn FCW off did not show any significant main effect of warning status, p = .163, or an interaction effect of warning status by age group, p = .807. But there was a marginally significant effect of age group, p = .059. Table 5 shows cell statistics. 95% CIs indicated that it took between 1.23 to 1.55 seconds to turn FCW off whether participants saw the warnings or not. The marginally significant main effect showed an unexpected pattern in that older drivers appeared to turn off FCW more quickly than younger to middle aged drivers. Figure 2 presents bar graphs for those cell statistics.
Table 5.
Descriptive statistics for each cell in the study design for time to turn FCW off (correction RT).
| Warnings On M (SD) | Warnings Off M (SD) | ||
|---|---|---|---|
| Younger to middle aged drivers (n=39) | 1.449 (0.37) | 1.516 (0.46) | 1.483 (0.32) |
| Older drivers (n=37) | 1.295 (0.39) | 1.389 (0.37) | 1.342 (0.32) |
| 1.374 (0.38) | 1.454 (0.42) |
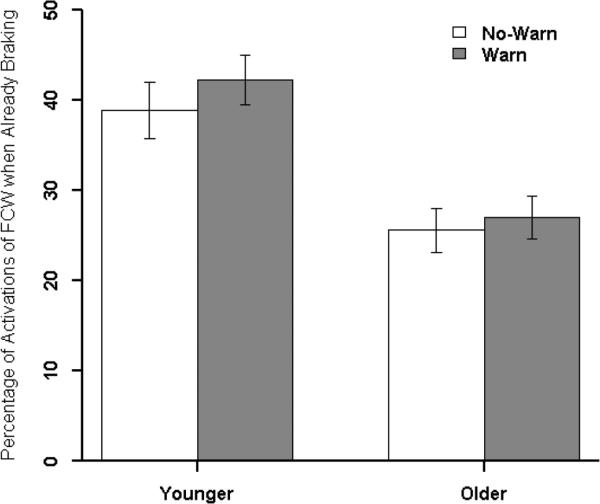
The 2X2 ANOVAs on pedal behavior measures indicated significant differences in how the two age groups were maintaining headway at the time FCW was activated. Table 6 shows the cell statistics for the tendency to brake at the time FCW was activated and Figure 4 depicts them as a bar graph. There was a significant age difference in the tendency to brake at the time FCW was activated, p <.001. Younger to middle aged drivers were already braking at FCW activation 39.8% of the time (95% CI ranged from 35.6% to 44.0%) whereas older drivers were braking on 26.2% of the time at FCW activation (95% CI ranged from 21.9% to 30.5%). The tendency to brake at the time FCW was activated did not change as a function of whether the warnings were turned on and visible to drivers or not, p =.144. The age groups did not respond differently when FCW was turned on or off, p = .380.
Table 6.
Cell statistics for percent of activations when drivers were already braking at the time FCW was activated.
| Warnings On M (SD) | Warnings Off M (SD) | ||
|---|---|---|---|
| Younger to middle aged drivers (n=39) | 42.254 (17.16) | 37.378 (16.72) | 39.80 (13.11) |
| Older drivers (n=37) | 26.787 (14.89) | 25.560 (17.79) | 26.20 (13.38) |
| 34.724 (17.79) | 31.625 (16.79) |
Figure 4.
Bar graphs for percent of activations when drivers were already braking at the time FCW was activated.
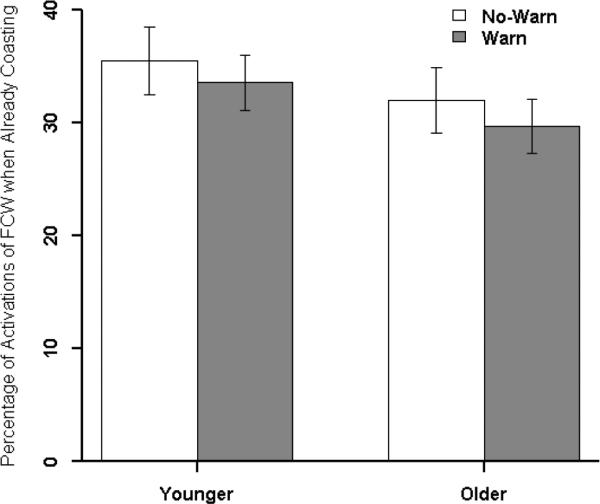
The 2X2 ANOVA for the tendency to be coasting at the time FCW was activated did not show significant effects of age group, p = .240, warning-status p = .428, or an interaction effect between age group and warning status, p = .889. Figure 5 shows the bar graphs and corresponding cell statistics are shown in Table 7. Younger to middle aged drivers were already coasting at FCW activation 33.8% of the time (95% CI ranged from 30% to 37.6%) and older drivers were also already coasting 32% of the time (95% CI ranged from 28.6% to 35.5%).
Figure 5.
Bar graphs for percentage of activations when drivers were already coasting at the time FCW was activated.
Table 7.
Cell statistics for percent of activations when drivers were already coasting at the time FCW was activated.
| Warnings On M (SD) | Warnings Off M (SD) | ||
|---|---|---|---|
| Younger to middle aged drivers (n=39) | 33.582 (15.50) | 35.680 (0.15) | 34.60 (12.49) |
| Older drivers (n=37) | 30.517 (14.24) | 31.987 (17.82) | 31.30 (12.17) |
| 32.090 (14.88) | 33.882 (16.64) |
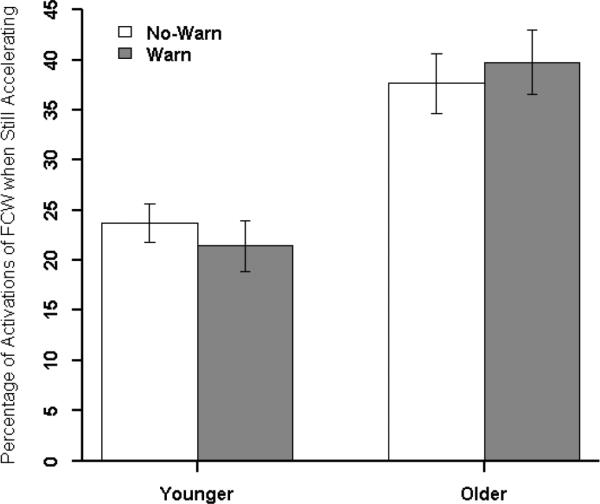
The 2X2 ANOVA for the tendency to be still accelerating at the time FCW was activated did not show significant effects of warning-status p = .672 or an interaction between age group and warning status, p = .326. However, there was significant main effect of age group, p < .001. Figure 6 shows the bar graphs and Table 8 shows the cell statistics from the design. There was a significant tendency for older adults to be still accelerating at the time FCW was activated compared to younger to middle aged drivers. Older drivers were still accelerating 38.3% of the time (95% CI ranged 34.2% to 42.4%) at the time FCW was activated while younger to middle aged adults were found to be accelerating 23.2% of the time (95%CI ranged from 19.2% to 27.2%).
Figure 6.
Bar graphs for percentage of activations when drivers were still accelerating the time FCW was activated.
To further explain the meaning and significance of the individual differences observed in pedal behavior at the time of FCW activation we examined pedal behavior in relation to measures of basic visual, motor, and cognitive functioning. Table 9 presents the Pearson correlations for the whole sample in both the warnings-on and warnings-off version of the drives. As can be seen from Table 9, tendency to brake at the time FCW was activated was associated with better functioning while the tendency to be still accelerating at the time FCW was activated was associated with lower functioning in general. This pattern held whether the driving measures were obtained when the warnings were turned on and visible to participants or not.
Table 9.
Pearson correlations among measures of functioning and pedal behavior at the time FCW was activated in both the warnings turned-on and off drives
| Pearson r | Visual Function | Motor Function | Speed of Processing | Memory | Visuospatial Construction | Executive Function |
|---|---|---|---|---|---|---|
| Warnings are off | ||||||
| % time already braking | .309** | .303** | .373** | .235* | .180 | .074 |
| % time coasting | .031 | .103 | .132 | .115 | .079 | .242* |
| % time still accelerating | −.267* | −.340** | −.452** | −.281* | −.224* | −.163 |
| Warnings are on | ||||||
| % time already braking | .401** | .257* | .469** | .357** | .154 | .363** |
| % time coasting | .088 | .103 | .139 | .218 | .227* | .204 |
| % time still accelerating | −.422** | −.360** | −.523** | −.497** | −.297** | −.433** |
p < .05
p< .05
SUMMARY/CONCLUSIONS
We evaluated the relative effectiveness of FCW for both older and younger to middle aged drivers that differed from industry standard in significant ways, especially with respect to its visual features. The advisory component of the FCW was visually distinct from objects in the driving scene overlapped with the rear bumper of the vehicle ahead, the length of the width of the visual icon was manipulated to create sense of looping to better capture attention between initial activation at TTC = 4 until the auditory chime was added at TTC =2 to signify an imminent crash.
The measures of FCW effectiveness including total exposure time, number of activations, or correction time did not indicate that FCW was effective in speeding either the deactivation of the warning, or reducing the total exposure. FCW also did not differentially affect older and younger to middle aged drivers. However, there was a trend suggested older drivers had slightly shorter correction times than younger to middle aged drivers. This was a marginally significant trend that was observed in both the warnings on and warnings off version of the drives. We believe this unexpected pattern was partly explained by the measures of pedal behavior around FCW activations. Older drivers tended to be still accelerating at the time FCW was activated and less likely to be braking compared to younger to middle aged drivers. Furthermore, the tendency to be still accelerating at TTC =4 was associated with lower functioning. This pattern of findings suggests that well-functioning drivers begin braking before the TTC =4 threshold was reached.
These findings suggest optimal timing for advisory alerts for forward events may need to be larger than TTC=4 especially for older drivers. We plan to conduct additional analyses to better identify the typical brake and coast times for older and younger to middle aged drivers to inform headway maintenance in general and typical TTC associated with those strategies to inform the timing of alerts. These additional analyses can also provide insight into the risk tolerance behavior of different age groups and whether risk tolerance varies as a function of cognitive functioning. Importantly, simulated drives while informative on relative rank-ordering of performance differences among age groups, may fail to generalize to the real-world in terms of absolute activation thresholds such as TTC= 4 is effective as simulated drives often lack the greater complexity of the real world.
Figure 3.
Bar graphs for correction RT or time it took drivers to turn FCW off.
ACKNOWLEDGMENTS
1. The study was funded by Toyota-CSRC. We would like to thank James Foley and Kazutoshi Ebe for their guidance in designing both scenarios and input on LDW visuals.
2. The study would not be possible without he patience and perseverance of the participants in returning to the lab for repeated visits, and the hard work of the following research assistants: Amanda Farmer, Jessica Ferdig, Lacy Flanagan, Robert Marini, Tara Ohrt, and Sayeh Sabbagh.
DEFINITIONS/ABBREVIATIONS
- SA
sample abbreviations
- UBT
Use borderless table ≤ 3.5 inches wide
- test vector
Don't capitalize term unless an acronym or proper noun
Footnotes
CITATION: Aksan, N., Sager, L., Hacker, S., Marini, R. et al., “Forward Collision Warning: Clues to Optimal Timing of Advisory Warnings,” SAE Int. J. Trans. Safety 4(1):2016, doi:10.4271/2016-01-1439.
Contributor Information
Nazan Aksan, University of Iowa Hospital and Clinic.
Lauren Sager, University of Iowa.
Sarah Hacker, University of Iowa.
Robert Marini, University of Iowa.
Jeffrey Dawson, University of Iowa.
Steven Anderson, University of Iowa.
Matthew Rizzo, University of Nebraska Medical Center.
REFERENCES
- 1.National Highway Traffic Safety Administration Traffic Safety Facts 2012: A compilation of motor vehicle crash data from the fatality analysis reporting system and the general estimates system. DPT HS 812 032. 2012.
- 2. http://safebraking.com/nhtsa-28-of-crashes-are-rear-end-collisions/
- 3. http://www.iihs.org/iihs/news/desktopnews/crash-avoidance-features-reduce-crashes-insurance-claims-study-shows-autonomous-braking-and-adaptive-headlights-yield-biggest-benefits.
- 4.Dawson JD, Uc EY, Anderson SW, Johnson AM, Rizzo M. Neuropsychological predictors of driving errorsin older adults. Journal of American Geriatric Society. 2009;58:1090–1096. doi: 10.1111/j.1532-5415.2010.02872.x. [DOI] [PMC free article] [PubMed] [Google Scholar]
- 5.Franconeri SL, Simons DJ. Moving and looming stimuli capture attention. Perception & Psychophysics. 2003;65:999–1010. doi: 10.3758/bf03194829. [DOI] [PubMed] [Google Scholar]
- 6.Ayres TJ, Li L, Schleuning D, Young D. Preferred time-headway of highway drivers. IEEE Intelligent Transportation Systems Conference Proceedings. 2001 [Google Scholar]
- 7.Vogel K. A comparison of headway and time to collision as safety indicators. Accident Analysis and Prevention. 2003;35:427–433. doi: 10.1016/s0001-4575(02)00022-2. [DOI] [PubMed] [Google Scholar]
- 8.Sultan B, McDonald M. Assessing the safety benefit of automatic collision avoidance systems (during emergency braking situations).. The 18th International Conference on the Enhanced Safety of Vehicles; Nagoya, Japan. 2003. [Google Scholar]
- 9.Nasreddine ZS, Phillips NA, Bédirian V, Charbonneau S, Whitehead V, Collin I, et al. The Montreal Cognitive Assessment (MoCA): A Brief Screening Tool For Mild Cognitive Impairment. Journal of the American Geriatrics Society. 2005;53:695–699. doi: 10.1111/j.1532-5415.2005.53221.x. [DOI] [PubMed] [Google Scholar]
- 10.Pelli DG, Robson JG, Wilkins AJ. The design of a new letter chart for measuring contrast sensitivity. Clinical Vision Sciences. 1988;2:187–199. [Google Scholar]
- 11.Ferris FL, III, Kassoff A, Bresnick GH, Baily I. New visual acuity charts for clinical research. American Journal of Ophthamology. 1982;94:91–96. [PubMed] [Google Scholar]
- 12.Alexander NB. Postural control in older adults. J Am Geriatr Soc. 1994;42:93–108. doi: 10.1111/j.1532-5415.1994.tb06081.x. [DOI] [PubMed] [Google Scholar]
- 13.Duncan PW, Weiner DK, Chandler J, Studenski S. Functional reach: A new clinical measure of balance. Journal of Gerontology. 1990;45:M192–M197. doi: 10.1093/geronj/45.6.m192. [DOI] [PubMed] [Google Scholar]
- 14.Mathias S, Nayak USL, Isaacs B. Balance in elderly patients: The “Get-up and Go Test”. Archives of Physical Medicine and Rehabilitation. 1986;67:387–389. [PubMed] [Google Scholar]
- 15.Lezak MD, Howieson DB, Loring DW. Neuropsychological Assessment. 4th ed. Oxford University Press; New York: 2004. [Google Scholar]
- 16.Strauss E, Sherman EMS, Spreen OA. Compendium of Neuropsychological Tests: Administration, Norms, and Commentary. 3rd Ed. Oxford University Press; New York: 2006. [Google Scholar]
- 17.Anderson S, Aksan N, Dawson J, Uc Ergun, Johnson AM, Rizzo M. Neuropsychological Assessment of Driving Safety Risk in Older Adults With and Without Neurologic Disease. Journal of Experimental and Clinical Neuropsychology. 2012;34:895–905. doi: 10.1080/13803395.2011.630654. [DOI] [PMC free article] [PubMed] [Google Scholar]


