Abstract
We have developed a programmable illumination system capable of tracking and illuminating numerous objects simultaneously using only low-cost and reused optical components. The active feedback control software allows for a closed-loop system that tracks and perturbs objects of interest automatically. Our system uses a static stage where the objects of interest are tracked computationally as they move across the field of view allowing for a large number of simultaneous experiments. An algorithmically determined illumination pattern can be applied anywhere in the field of view with simultaneous imaging and perturbation using different colors of light to enable spatially and temporally structured illumination. Our system consists of a consumer projector, camera, 35-mm camera lens, and a small number of other optical and scaffolding components. The entire apparatus can be assembled for under $4,000.
I. INTRODUCTION
Targeted and patterned illumination systems are becoming an important tool for experimentalists in numerous fields, including neuroscience, genetics, biophysics, microfabrication, and dynamical systems, due to their ability to selectively illuminate and perturb a small specified region of interest within a sample. Targeted illumination has been used in the field of optogenetics for the tracking and manipulation of organisms such as C. elegans,1 customizable illumination has been used in semiconductor manufacturing as a maskless photolithography technique,2 and programmable illumination has been used in the study of coupled chemical oscillators.3 All of these targeted illumination techniques make use of the ability to illuminate different regions of the field of view.
The Programmable Illumination Microscope (PIM) described in this paper is highly customizable and diverse in its potential applications due to its modular design, inexpensive components, and active feedback control software. The principles behind its design are readily accessible to undergraduate students, allowing the construction of a PIM to be an undergraduate student project. Similar systems have been constructed and used previously at primarily undergraduate institutions.4 However, these setups require the repurposing of an existing trinocular microscope and are limited to ultra-light projectors that can be mounted directly on the camera port. The system described here is more versatile in functionality due to its open modular design, can accommodate higher quality projectors with more powerful illumination, and provides an engaging educational opportunity for a project in optics. In addition to the hardware advantages, our PIM system is not limited to passive illumination because the adaptive feedback software allows for programmable illumination that can respond to the objects being imaged based on a predefined response algorithm. Work currently underway is using this capability to measure the response of chemical oscillators to light and to create chemical logic gates.
Optical scanning systems using galvanometers or acousto-optic deflectors (AOD) are commonly used in various laser microscopy techniques and in laser light shows. In theory, a system similar to ours could be constructed using either of these methods and achieve comparable results. However, these scanning systems illuminate point-by-point so that the illumination is time-shared over the field of view while a projector illuminates the entire field of view simultaneously. For our system, we chose to use a standard consumer projector due to both price considerations and ease of use. Used consumer projectors are readily available, inexpensive, and require little technical knowledge to use in a PIM. Galvanometer or AOD-based systems are only inexpensive as salvaged or “kit” pieces and require significant time and expertise to assemble. Consumer projectors have a standardized software interface that makes software development significantly easier. For the purposes of an efficient and inexpensive laboratory tool, a consumer projector is a robust option.
The remainder of this paper describes the hardware and software used in our system. Nothing cost prohibitive or overly sophisticated is used in creating the microscope described here and no specialized training or tools are required. A critical step in the construction of the PIM is aligning the field of projection with the field of view. Once the alignment has been completed, the software can illuminate any object within the field of view automatically, allowing for a closed loop experimental design. Supplemental matlab code is available for download to assist in the setup and alignment of a PIM and as a basic demonstration of functionality.5
II. TECHNICAL DETAILS
The PIM described here is the result of two separate projects, both of which are accessible to advanced undergraduate students. The first project is the construction of the microscope itself from a minimally modified consumer projector, camera lens, assorted optical components, and scaffolding framework that together form a challenging and open-ended optics project. This project can range from a short assembly process to an involved study of advanced optics, depending on the desired resolution and evenness of illumination of the final product. The second project is the development of the control software that acquires data from the camera, sends output to the projector, and tracks the objects within the field of view. This project is also challenging and open-ended, depending on the desired speed and functionality of the control software. All of the required functions are readily available in matlab, though a faster implementation could make use of a standalone programming language such as c or python.
A. Hardware
Our system uses the light from a consumer projector for both illumination and perturbation of a chemical system. The exact projector used is not critical and we have created systems using both three-color liquid crystal display (LCD) and color-wheel digital light processing (DLP) projectors. A DLP projector typically has a higher contrast ratio than a comparable LCD projector (the DLP Dell 1210S has an advertised 2200:1 contrast ratio,6 the LCD NEC VT800 has an advertised 500:1 contrast ratio,7 and the high-end LCD NEC NP1150 has an advertised 600:1 contrast ratio8), but a three-color projector provides continuous illumination while a single source projector uses a color-wheel that provides discontinuous illumination (the Dell 1210S has a 2× color wheel6 that flashes each color at twice the refresh rate with a net duty cycle of just under 1/3). The DLP projector we used (Dell 1210S) has off-axis optics due to the alignment of the mirror plane that requires further optical corrections and yields a less uniform image with poorer focal quality. LCD projectors are also often off-axis, but the NEC VT800 and NEC NP1150 are on-axis. The primary consideration for choosing a projector is finding one where the lens is centered on the projector engine (LCD or DLP). One way to guarantee that the projector is on-axis is to select ones with geometric lens shifts. The PIM described here uses a NEC VT800 projector with a resolution of 1024 × 768, purchased factory refurbished from eBay.
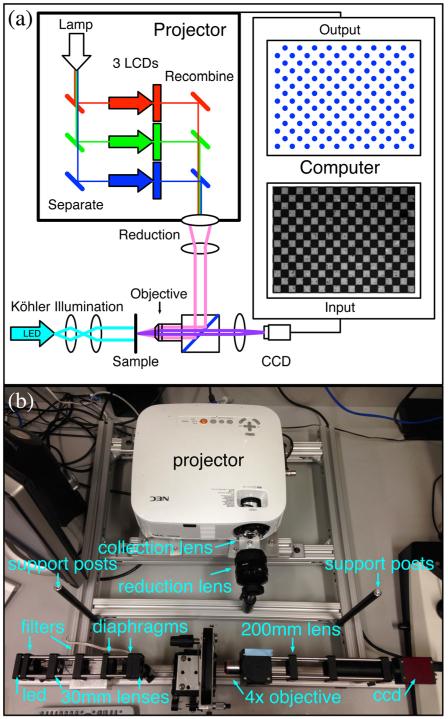
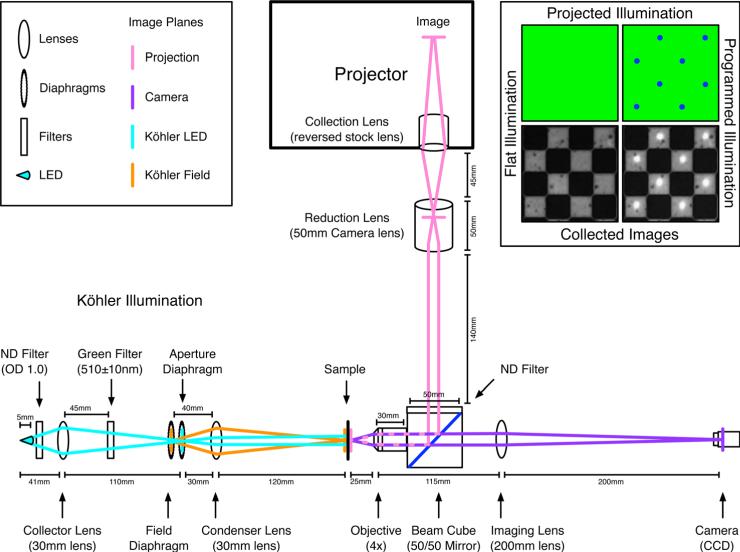
We removed and reversed the focusing lens from the NEC VT800 projector in order to create a reduced image of the LCD outside of the projector. Depending on the type of projector, it may be necessary to open the enclosure to remove the lens. Sometimes it is necessary to modify the projector enclosure in order to position the reversed lens close enough to the LCD unit. A manual focus SLR lens from eBay was used as a reduction lens to defocus the reduced image of the LCD to an infinity plane. The parallel light was transmitted onto the central beam cube and reflected from a beamsplitter to an infinity corrected microscope objective attached to the beam cube that focuses the image onto the sample stage.9 Figure 1 shows a schematic and photograph of the setup, while Fig. 9 in Appendix B shows the exact layout of the optics used. This setup allows the projector to illuminate the sample in reflection while an LED Köhler setup illuminates the sample in transmission.
Fig. 1.
(a) A schematic illustration and (b) a photograph of the optics of the Programmable Illumination Microscope (PIM). Light from the projector exits the projector through the stock lens in reverse and is defocused to infinity using the lens from a 35-mm camera. The parallel light is transmitted into the beam cube, reflected from a beamsplitter, and focused through the ×4 microscope objective to illuminate in reflection. The sample is imaged with a 200-mm lens onto a CCD camera. An optional Köhler illumination setup is in place to illuminate the sample in transmission (a cyan LED in conjunction with a neutral density filter and 510-nm bandpass filter focused using two 30-mm lenses with ring-activated iris field and aperture diaphragms). A neutral density filter is taped to the beam cube to attenuate the intensity of light from the projector and support posts for the blackout cage are mounted to the supporting frame. The computer (not shown) calculates a dot for every white square in the 100-μm checkerboard alignment grid. The exact layout of the optics is shown in Fig. 9.
Fig. 9.
The optical layout of the PIM with distances between elements. The different optical paths are shown in pink, purple, and cyan with an additional conjugate path in orange. The original projection image from within the projector is focused onto the sample via the pink path with an intermediate image plane within the body of the reduction lens. The sample is imaged onto the camera via the purple path. The Köhler illumination is created via the cyan path with an intermediate image plane on the aperture diaphragm and the conjugate field path is shown in orange. The field diaphragm controls the field of illumination and the aperture diaphragm controls the intensity of illumination. The neutral density filters attenuate the intensity of the projector and LED while the 510 ± 10-nm bandpass “green” filter is used to select illumination wavelength. The locations of the filters are not critical as long as imaging planes are avoided. Shown in the corner are examples of flat illumination and programmed illumination illuminating the 100-μm checkerboard alignment grid.
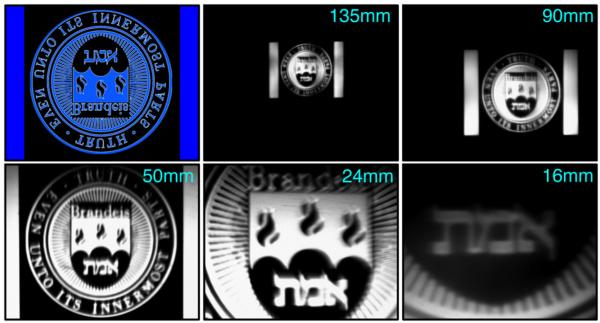
On the side of the beam cube, opposite the sample stage, a lens focuses the image onto the camera (Allied Vision Marlin F131-B with 1280 × 1024 resolution). The computer input shown in Fig. 1 is an image of a 100-μm semi-transparent “checkerboard” alignment grid. The computer output shows that the software detects and illuminates the white squares. The camera is focused on a subset of the projected image to ensure that all regions of the field of view can be illuminated. The field of view can be further restricted within the field of projection to enhance uniformity of illumination by changing the focal length of the reduction lens. Figure 2 shows different overlaps of the field of projection and the field of view by varying the focal length of the reduction lens. Our system uses an overlap region of ~564 × 451 pixels of the field of projection within the field of view. This overlap was chosen to balance the evenness of illumination while maintaining sufficient resolution to index individual elements within the field of view.
Fig. 2.
The overlap of the field of projection with the field of view is controllable by changing the focal length of the reduction lens [see Fig. 1(b)] used in the PIM. Examples are shown of the overlap using reduction lenses of different focal lengths. The exact overlap will also depend on the focusing lens used and the sensor size of the CCD. Top left: The image being projected onto a clean silicon wafer. Note that the Brandeis logo is upside down in the projection. Using a 135-mm or 90-mm lens results in the field of projection being smaller than the field of view. Using a 24-mm or 16-mm lens results in the field of view being smaller than the field of projection. Using a 50-mm lens results in a nearly perfect overlap of the fields of view and projection.
When using the microscope, a blackout cage is placed over the assembly to block ambient light. In Fig. 1, the blackout cage has been removed and the support posts are visible. The microscope is further customizable by using the projector to illuminate in transmission or even using two projectors to have programmable illumination in both reflection and transmission. To reduce costs, the Köhler illumination setup can be excluded and a lower resolution projector and camera can be used with minimal loss in functionality. It should be noted that the decision to reverse the stock lens is a compromise and not necessarily the best option for maintaining optical quality. It is very likely that the stock lens contains corrective optics and that reversing its direction greatly degrades the image. This could be avoided by maintaining the projector in its factory condition and using a large collection lens to create the reduced intermediary image. However, such a large collection lens may be cost prohibitive. For several projectors, we found that reversing the lens was a surprisingly good solution, providing adequate image clarity while requiring minimal effort and no additional cost.
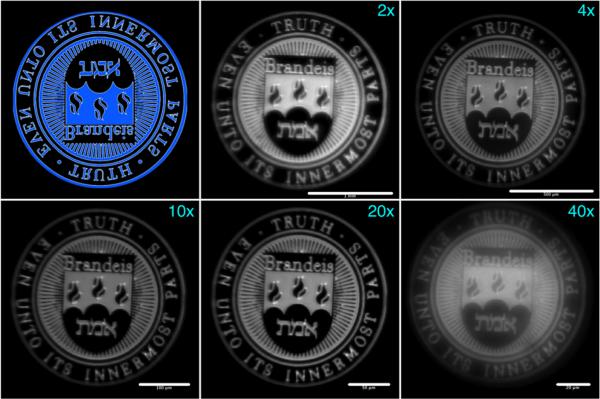
The size of the projected image depends on the magnification of the microscope objective used. Figure 3 shows examples of the Brandeis seal projected through several different objectives. In each case, the logo was projected onto a clean glass slide for imaging and onto a 100-μm grid for measurements. The image is formed by projected light reflected backwards from the glass. As can be seen, the image is recorded on the camera with high fidelity; the dot of the “i” in Brandeis is easily discernible, even with a ×40 objective. With a ×20 objective (or lower), the “i” maintains a steep profile from the background level to the peak. The size and quality of the final image depends on the optics used and the care of their alignment.
Fig. 3.
The Brandeis seal as imaged when projected onto a glass slide through various microscope objectives. In each case, the image was taken twice, once onto a clean glass slide (shown here) and once onto a 100-μm grid for measurement (not shown). Top left: The image being projected. The scale bars in the images above are: ×2 objective, 1-mm scale bar; ×4 objective, 500-μm scale bar; ×10 objective, 100-μm scale bar; ×20 objective, 50-μm scale bar; and ×40 objective, 20-μm scale bar.
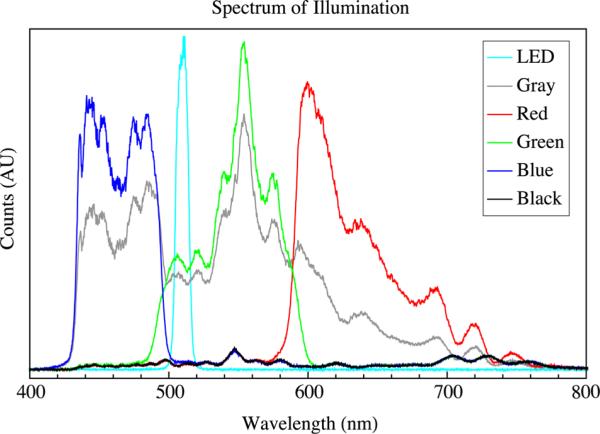
The spectral output of the projector was unaltered. The LED used for transmission illumination was a high-intensity cyan LED filtered through a 510 ± 10-nm filter. Figure 4 shows the illumination spectrum as measured on the sample stage. A finer selection of the spectra of each channel is possible by modifying the projector further with the addition of optical filters within each pathway.
Fig. 4.
The illumination spectrum as measured on the sample stage. The LED is a high-power cyan LED through a 510 ± 10 nm filter, the projector was set to project a solid screen of red (RGB[50,0,0]), green (RGB[0,50,0]), blue (RGB[0,0,50]), black (RGB[0,0,0]), or gray (RGB[50,50,50]).
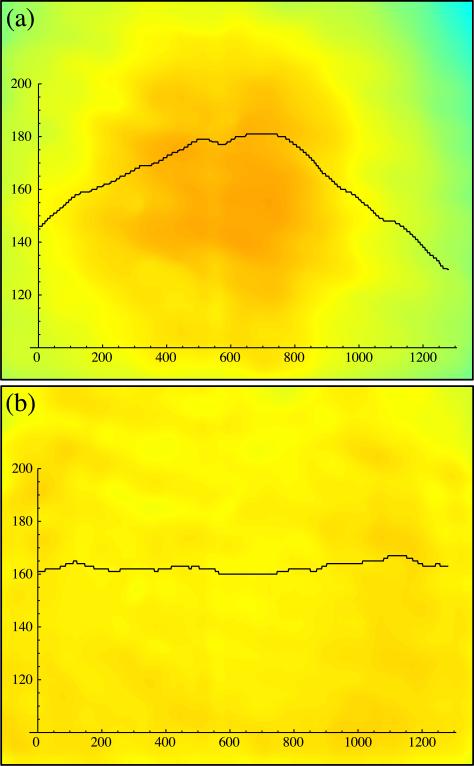
The illumination from the projector is natively a Gaussian distribution with a peak in the center of the illumination. The distribution can be flattened via corrective optics or using software to adjust the spatial structure of the illumination. Although an optical correction is often preferable, the optical techniques required can be expensive and time intensive to implement while a software correction can be less costly and quicker to adopt. Depending on the width of the distribution compared to the field of view, the evenness of illumination may be acceptable without corrections. Figure 5 shows the field of view before and after software flattening where the variation in intensity of the field of view was reduced from 8.6% to 1.1%. The illumination was flattened using the formula Clight = [f(1 – Nimage) + n] ○ Ulight, where Clight is the corrected illumination, Ulight is the uncorrected illumination, Nimage is the normalized image in which the brightest pixel is set to 1 and taken with uncorrected illumination, f is a scaling factor to prevent overcorrecting the darker regions, n is an offset to scale the average intensity, and the symbol “○” indicates the Hadamard product (an element by element multiplication of the matrices implemented as “.*” in matlab). Other correction algorithms can be used as well.
Fig. 5.
The illumination of the sample before and after software flattening. Shown are pseudocolor images of a clean sheet of glass with a representative intensity trace superimposed (pixel value vs pixel position). In both cases, the image was median filtered to remove noise. (a) An image where a spatially uniform illumination of RGB[0,0,125] is projected. Superimposed is a horizontal trace across the center of the field of view with a variation of 8.6%. (b) An image where the illumination has been flattened using the formula in the text with f = 0.25 and n = 0.95. Superimposed is a horizontal trace across the center of the field of view with a variation of 1.1%. The corrected and uncorrected illuminations are both scaled to align with the field of view. Regions of the field of projection outside the field of view were not illuminated.
B. Software
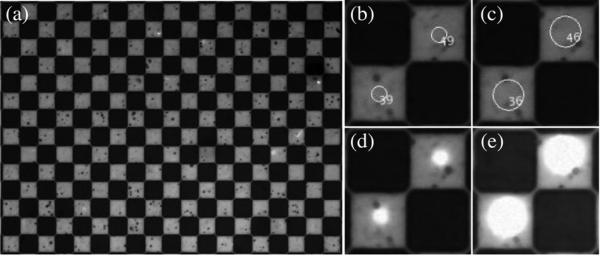
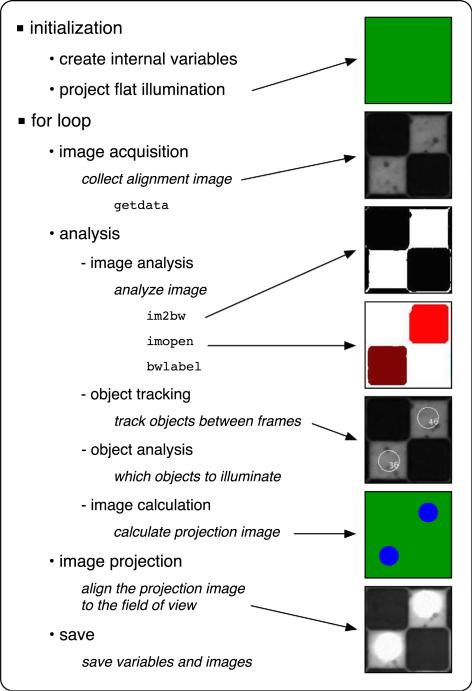
Our systems are controlled by software written in matlab (2011a) and running on an iMac (Mid-2010 dual-core i3), equipment readily available at most institutions. A less expensive computer running the open-source GNU Octave software package instead of matlab can also be used with minimal loss of functionality. Each iteration of the software cycle can be broadly separated into three steps; image acquisition, image analysis, and image projection. These steps run sequentially within a simple for loop after an initialization process that preallocates all of the required variables. The image acquisition process collects an image from the camera for use in the object analysis step, the object analysis step runs all of the required code to determine what image is to be projected onto the sample, and the image projection step then projects the calculated image onto the sample for a prescribed duration. During each iteration, five items are saved to the computer: the raw image from the first step, a tracking image where all of the tracked objects are labeled, the calculated projection, an image from the camera during projection, and the internal variables. Examples of the three images collected can be seen in Fig. 6 and an illustration of the software flow is shown in Fig. 7.
Fig. 6.
Examples of images saved during each iteration of the control software. (a) The raw image collected imaging the checkerboard alignment grid at ×4 magnification. The squares are 100 μm per side. (b)–(c) Labels and opening shapes superimposed over a small region of the raw image: (b) disk with an 8-pixel radius; (c) disk with a 16-pixel radius. (d)–(e) A small region of the image taken while projecting a dot matching the opening object: (d) disk with an 8-pixel radius; (e) disk with a 16-pixel radius.
Fig. 7.
An illustration of the software flow for the PIM. After an initialization sequence, a for loop runs for each frame to be collected. Within each iteration of the for loop, the process can be separated into image acquisition, image analysis, and image projection steps. The bulk of the process is within the image analysis step, which can be further separated into image analysis, object tracking, object analysis, and image calculation subprocesses. The images on the right illustrate the flat illumination, an image of the checkerboard alignment grid with flat illumination, thresholded image, opened image, tracked image, programmed illumination, and an image with programmed illumination. Supplemental software and an animation are available to demonstrate this process (Ref. 5).
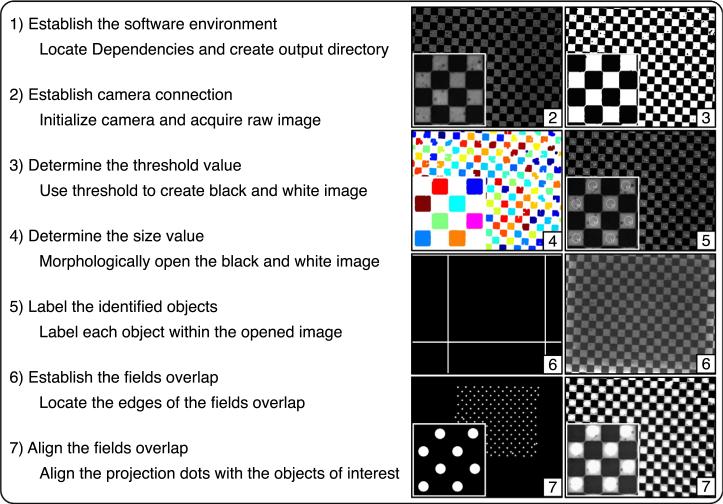
A critical step in setting up a new PIM is the alignment of the field of projection with the field of view. This step allows for the active feedback control software to illuminate any object within the field of view automatically. (Appendix C and Fig. 10 provide more details on aligning the PIM.) It is recommended that the alignment of the PIM is checked before each use as the alignment may drift slightly from day to day. Instructions and supplemental matlab code are available for download to assist in setting up and aligning a new PIM.5 The control software for our system is available from the authors upon request.
Fig. 10.
An illustration of the alignment procedure for the PIM. The seven steps on the left correspond to the seven steps in the supplemental software (Ref. 5) and demonstrated in the supplemental animation. The images at right are examples of the output using a checkerboard alignment grid (100-μm squares) with a zoomed-in region superimposed. Step one establishes the software environment on the computer independent of the PIM (no output). Step two establishes the connection with the camera and results in a raw image of the sample (raw image shown). Step three determines the threshold value to create a black-and-white image of the sample (black-and-white image shown). Step four determines the size value to morphologically open the black-and-white image and identify the objects of interest within the image (labelled image shown). Step five labels the objects of interest on the raw image for identification (tracked image shown). Step six establishes the overlap between the field of view and the field of projection (overlap within the field of projection shown on left and corresponding image from the field of view on the right). Step seven aligns the field of view with the field of projection (projection shown on left and corresponding image on the right).
The image acquisition step of the control software depends entirely on the software system and coding language being used. Our system uses the Image Acquisition Toolbox of matlab and the getdata command.
The analysis step runs through a few subprocesses to track the objects within the field of view and calculate the image to be projected. These processes can be described as image analysis, object tracking, object analysis, and image calculation, and are described in more detail below.
• Image Analysis
The image analysis consists of thresholding the image to black and white (im2bw), morphological opening (imopen), and object labeling (bwlabel). Morphological opening is a standard image processing technique used to find objects of a predetermined shape and size.10,11 Object labeling is another standard image processing technique where isolated blocks of ones are identified and given unique labels, as shown in Fig. 7. For each of these labeled objects, data, such as their area, centroid, or average pixel value, can be extracted for further analysis. The centroids of these objects and the size of the disk used in their opening are used to demonstrate the output of labeling in Fig. 7. Tuning the thresholding and opening parameters within this process are critical for successful operation of the control software. Standalone routines were created to predetermine these values.
• Object Tracking
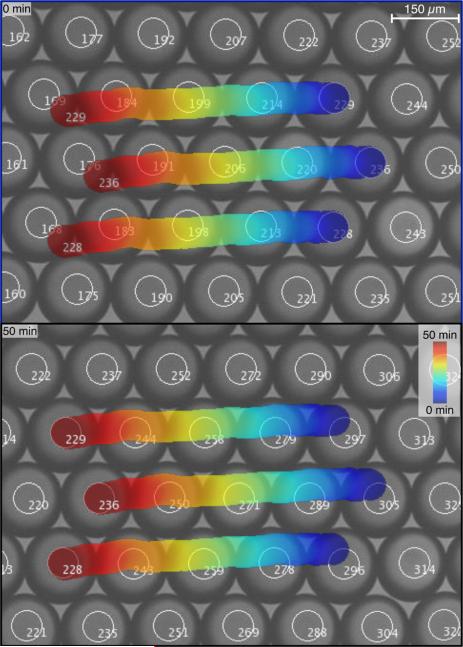
The preallocation process runs the image analysis subprocess and creates an “object” matrix that is the heart of the object tracking process. This matrix stores the size, position, velocity, and activity of every identified object within the field of view. The labeling process of the image analysis subroutine returns an integer list of objects that is based solely on their position within the current image; the integer assignments of specific objects, returned by the subroutine, are often not consistent between frames. The object tracking subprocess fixes this problem by identifying the object label within the current frame to the object number being tracked between frames. For each iteration, the objects detected in the image analysis subprocess are compared with the matrix of objects being tracked using a weighting algorithm that compares the size and position of the current object with the predicted size and positions of the previously tracked objects. Whichever preexisting object has the lowest weight is associated with the current labeled object. If no preexisting object has a weight below a certain threshold then the current object is considered new and a new entry is added to the “object” matrix. If a preexisting object is not associated with any object in the current frame, it is marked as inactive to indicate it is not currently present. This process allows for objects to be tracked as they enter and leave the field of view while maintaining a memory of their previous activity. Figure 8, along with the supplemental videos, demonstrate objects being tracked in time.
Fig. 8.
Droplets of a water-in-oil emulsion being tracked as the drops move in a glass capillary. The images are a small section of a larger field of view taken 50 minutes apart. The superimposed traces indicate the locations of three objects tracked over time. Objects moving in from the right are assigned new numbers (enhanced online) [URL: http://dx.doi.org/10.1119/1.4935806.1][URL: http://dx.doi.org/10.1119/1.4935806.2] .
• Object Analysis
The object analysis process depends strongly on the desired application of the microscope. For our purposes, the mean intensity of each object is sampled and compared to that same object's intensity in previous frames. This allows us to determine the oxidation state of the chemical oscillators within the field of view. The object tracking subprocess allows objects to be compared against themselves in previous frames, even if they move within the field of view.
• Image Calculation
The image calculation process also depends strongly on the desired application of the microscope. In our application, various metrics are calculated from the oxidation states of the chemical oscillators and those satisfying certain criteria are illuminated with a circle of light. The object tracking and object analysis subprocesses allow for the flexibility of illuminating specific locations at specific times with specific colors and intensities without any user intervention.
• Image Projection
After the analysis processes have finished, the calculated image is projected onto the sample for a prescribed duration. Projection is carried out by displaying the image fullscreen on a second display attached to the computer. This second display is connected to the projector so that the second display shows exactly what is being projected at all times. A matlab/java script is included with the supplemental material to assist in this process.5 To align the projector and sample, the calculated image is shifted in position, size, and orientation to align it with the field of view, based on the optics of the hardware. The software alignment of the projected image is key to the successful operation of the microscope. The alignment parameters depend on the type of microscope being used. For the two systems we have created, one flips the image vertically while the other flips the image horizontally and both have different alignments between the field of view and the field of projection. In both cases, the field of view is a subset of the field of projection, allowing for the projected illumination to access the entire field of view. These parameters should be checked and fine-tuned before every use of the microscope. The supplemental software is designed to assist in setting up and aligning a new microscope.
At the end of every iteration, the projector is returned to a blank screen in preparation for the next frame, the collected images are saved, the calculated projection is saved, and the internal variables are saved. Saving the variables with each iteration and recording the saved images as a series of stills rather than frames within a movie prevents loss of data if the control software is terminated prematurely. For our purposes, images are typically collected one image every ten seconds while tracking up to 300 objects to create a time-lapse video of the chemical processes being observed. A stripped-down version of our software has been used to collect images at three frames per second while tracking twenty objects. The limiting factors for the frame rate are the number of objects being tracked, the complexity of the calculations being performed on the tracked objects, the desired duration of projection for each frame, and the specifications of the computer running the code. More sophisticated software running in a more fundamental programming language such as python or c can also increase the maximal frame rate.
III. APPLICATIONS
The PIM described here can be used in a variety of experimental fields. Any technique that requires or can benefit from spatially or temporally structured illumination can potentially be implemented on a PIM. The active feedback control software introduces a new and innovative approach for targeted and patterned illumination. The following list shows some examples of applications of PIMs in different field.
• Optogenetics
The PIM at low magnification can be used to track entire organisms such as C. elegans and manipulate the illumination at different macroscopic portions of the organism's anatomy.1 At higher magnification, the PIM can localize illumination on specific microscopic anatomical substructures with a programmable temporal sequence that can include responding to cues from within the field of view.
• Microfabrication
The PIM can serve as a maskless photolithography system for “g-line” (436 nm) photoresists, such as Shipley-18134 and OFPR-800.12 With significant modifications, DLP projectors can even be used with more typical “i-line” (365 nm) SU-8 photoresists.13 The scale of the structures to be manufactured can easily be adjusted by changing the magnification of the objective.
• Biophysics
The PIM can be a valuable tool in the study of the phototactic motility of Chlamydomonas reinhard-tii.14 The entire organism can be tracked with targeted optical perturbation for demonstrations and measurements of the phototactic response.
• Chemistry
The PIM can be used to study and demonstrate the emergence of stationary Turing patterns in the Chlorine Dioxide-Iodine-Malonic Acid (CDIMA) and related reactions.15
• Nonlinear dynamics
The PIM has been used to control the boundary conditions and initial conditions on systems of diffusively chemical oscillators.3 Here, the PIM allowed for the first direct experimental testing of Turing's 60-year-old mathematical theory.
• Computer science
The PIM can be used to create and demonstrate chemical Boolean logic gates in oscillatory chemical media16 and to find the optimal solution to modifiable labyrinths and mazes.17
These examples illustrate what the PIM can be used for. The modular design and inexpensive components allow for rapid construction and modification for a variety of purposes. The active feedback control software allows for realtime algorithmic illumination that can be targeted and patterned, both spatially and temporally. The powerful capability of the PIM, combined with the simplicity of hardware and software, makes it an ideal tool for a teaching laboratory.
Supplementary Material
ACKNOWLEDGMENTS
The authors would like to thank Michael Heymann for help with the design and construction of the previous generation of the programmable illumination microscope. The authors acknowledge the support from the Brandeis University NSF MRSEC, DMR-1420382.
APPENDIX A: COMPONENT LIST WITH PRICES
Most, if not all, components can be purchased from eBay. Most pieces of our apparatus were purchased from eBay, Thor Labs, or 80/20, Inc.
Key components:
Projector: NEC VT800. This model has been discontinued and replaced with the NEC VT695. The NEC VT695 retails for $1,399 but is currently available on eBay for $150. Removing the projector lens requires opening the projector enclosure, but the reversed lens can be positioned close enough to the LCD panel without having to modify the enclosure. We have also used the NEC NP1150 (retail: $3,499, eBay: $350), which has a convenient “lens release” to change the optics without opening the case and to position the reversed lens without modifying the enclosure. We recommend both the NEC VT695 and NEC NP1150 with the NEC NP1150 being simpler to use as it has both geometric lens shift and lens release; the NEC VT695 has neither of these features. The DLP projector used was a Dell 1210S (retail: $450, eBay: $150) but we never managed to make images of the same quality using the DLP projector as the LCD projectors.
Computer: Apple iMac (Mid-2010 21.5″ dual-core 3 GHz i3) refurbished from the Apple Education Store for $1,079. Currently available on eBay for $550.
Camera: Allied Vision Marlin F131-B (eBay: $375)
Reduction lens: 50-mm Canon FD 1:1.4 lens (eBay: $50)
Objective: Infinity corrected Olympus PlanN (×4, Thor: $200, eBay: $100)
Microscope XY-Stage: Generic stage (eBay: $50)
Translation Stage: NewPort NCR 420 (eBay: $100)
Beamsplitter: Chroma 21000 50/50 Beamsplitter (Chroma: $125)
Focusing Lens: Thor Labs achromat 200 mm (Thor AC254-200-A: $71)
Structural Components:
Lens Mount Adapter: Canon FD to C-Mount (eBay: $25) and internal C-Mount to external SM1 (Thor SM1A10: $18).
Camera Mount Adapter: internal SM1 to external C-Mount (Thor SM1A9: $18) and external SM2 coupler (Thor SM1T2: $18)
Microscope Objective Mount Adapter: external SM1 to internal RMS (Thor SM1A3: $16)
Beam Cube: 30-mm Cage Cube (Thor C6W: $60), Base Plate (Thor B1C: $18), Top Plate (Thor B3C: $23), Filter Mount (Thor FFM1: $56), and Port Hole Cover (Thor SM1CP2: $17)
Optics Mounts: SM1 Plates (×4, Thor CP02T: $20 each)
Camera Light Hood (Thor SM1S30: $20)
Rails: Connecting Rails (Thor ER8-P4 $44)
Posts (×3, Thor TR4: $6 each) and Stands (×3, Thor PH4: $9 each)
Frame: We machined our own frame out of 14 feet of 80/20 1515 framing (eBay: $50), twelve 80/20 3368 corner connectors (eBay: $6 each), four 80/20 4302 inside corner brackets (eBay: $3 each), one package of 80/20 3320 mounting connectors (eBay: $15), and scrap aluminum.
Optional Components (Köhler illumination):
LED: Cyan LED (Luxeon: $8 eBay: $5), 350-mA Driver (Luxeon: $20, eBay: $14), 13 V Power Supply (eBay: $10), and Mounting Plate (Thor CP01: $15)
Lenses: 30 mm (×2, Thor AC254-030-A: $77 each)
Irises: iris (×2, Thor SM1D12D: $58 each)
Neutral Density Filter: OD10 filter (Thor NE10A-A: $68)
Green Filter: Bandpass filter (Thor FB510-10: $84)
Optics Mounts: Thick SM1 Plates for lenses and bandpass filter (×3, Thor CP02T: $20 each)
Optics Mounts: Thin SM1 Plates for irises and neutral density filter (×3, Thor CP02: $16 each)
Rails: Connecting Rails (Thor ER8-P4 $44)
Posts (×2, Thor TR4: $6 each) and Stands (×2, Thor PH4: $9 each)
APPENDIX B: OPTICAL LAYOUT
The full optical layout of the PIM with distances is shown in Fig. 9. The optics path of the projected image is shown in pink from the source image within the projector to the focused image on the sample. Another projection image plane exists within the body of the reduction lens. The optics path for imaging the sample is shown in purple. The Köhler illumination optics path is shown in cyan with an intermediate image plane on the aperture diaphragm. An additional conjugate optics path for the Köhler field is shown in orange where the field diaphragm is imaged onto the sample. The field diaphragm controls the field of illumination and the aperture diaphragm controls the intensity of illumination. Also included are two neutral density filters to attenuate the intensity of the illumination from the projector and the LED. An additional 510 ± 10 nm bandpass “green” filter is used to image the oxidation state of ferroin in chemical studies. The locations of the filters is not critical as long as imaging planes are avoided. A schematic illumination and an actual sample image are also shown in Fig. 9.
APPENDIX C: ALIGNMENT
A critical aspect in the usage of the PIM is the alignment of the field of view with the field of projection. Special care needs to be taken with the initial alignment and it is also recommended to check the alignment before every use. Supplemental software in matlab is available to assist in aligning the fields overlap.5 The software consists of seven steps that are outlined below and shown in Fig. 10 with output images. The supplemental animation provides additional clarification on the alignment software workflow. It is recommended that step seven is repeated before every use.
Step One. Establish the software environment. This step creates the necessary output directories and locates the software dependencies. After this step, the MATLAB environment is ready.
Step Two. Establish the camera connection. This step creates the connection between MATLAB and the camera. During this step, the camera settings, the illumination intensity, and the focal plane are adjusted to capture an image of the sample.
Step Three. Determine the threshold value. This step creates a black-and-white image of the sample using the determined threshold value.
Step Four. Determine the size value. This step uses morphological opening to identify the objects of interest within the black and white image using the determined size value.
Step Five. Label the identified objects. This step creates labels on the raw image for each object of interest. The output image demonstrates that the software is correctly identifying the objects of interest. After this step the camera and the software environment are ready.
Step Six. Establish the fields overlap. This step identifies the region of the field of projection that includes the field of view. A small routine within this section projects a white bar on an otherwise black screen that starts at the edge of the field of projection and is moved across the field of projection until detected by the camera. The current location of the bar within the field of projection is then recorded as the edge of the field of view. This is repeated for the other three sides until an outline of the field of view within the field of projection is identified. This outline provides the starting point for a finer alignment.
Step Seven. Align the fields overlap. This step aligns the field of view with the field of projection. Using the previously identified outline of the overlaps, dots of light are projected onto the objects of interest. The location of the dots on the sample is checked manually and five parameters are adjusted until the dots align with the objects of interest to the user's satisfaction. The five parameters are: horizontal and vertical compression, adjustments to the spacing of the dots that controls how far apart they appear, horizontal and vertical positioning, adjustments to the positioning of the dots that controls their location and rotation, and adjustments to the angular rotation between the field of view and the field of projection.
Typical use of the PIM after the initial alignment starts with a repeat of steps one through five to load the saved parameters and is complete in under a minute. Step six is skipped entirely and the previous values are loaded from a saved file. Step seven is repeated in full using the previous values as a starting point. Repeating step seven can typically be completed in a couple of minutes. Note that the projector should be allowed to fully warm up, which takes roughly thirty minutes for our systems, before aligning since the various structural components will likely have different rates of thermal expansion.
Footnotes
Supplemental matlab code is available to assist in the setup of the active feedback software.
References
- 1.Stirman JN, Crane MM, Husson SJ, Wabnig S, Schultheis C, Gottschalk A, Lu H. Real-time multimodal optical control of neurons and muscles in freely behaving Caenorhabditis elegans. Nat. Methods. 2011;8(2):153–158. doi: 10.1038/nmeth.1555. [DOI] [PMC free article] [PubMed] [Google Scholar]
- 2.Singh-Gasson S, Green RD, Yue Y, Nelson C, Blattner F, Sussman MR, Cerrina F. Maskless fabrication of light-directed oligonucleotide microarrays using a digital micromirror array. Nat. Biotechnol. 1999;17(10):974–978. doi: 10.1038/13664. [DOI] [PubMed] [Google Scholar]
- 3.Tompkins N, Li N, Girabawe C, Heymann M, Bard Ermentrout G, Epstein IR, Fraden S. Testing Turings theory of morphogenesis in chemical cells. Proc. Natl. Acad. Sci. U.S.A. 2014;111(12):4397–4402. doi: 10.1073/pnas.1322005111. [DOI] [PMC free article] [PubMed] [Google Scholar]
- 4.David Musgraves J, Close BT, Tanenbaum DM. A maskless photolithographic prototyping system using a low-cost consumer projector and a microscope. Am. J. Phys. 2005;73(10):980–984. [Google Scholar]
- 5.See supplementary material, including sample videos, an animation that demonstrates the flow of the active feedback software, and MATLAB code to assist in the setup and alignment of the microscope, at http://dx.doi.org/10.1119/1.4935806.
- 6.Dell 1210S Projector User's Guide. 2009.
- 7.Portable Projector VT800 User's Manual. 2008.
- 8.LCD Projector NP3150/NP2150/NP1150 User's Manual. 2007.
- 9.Delgado J, Li N, Leda M, Gonz alez-Ochoa HO, Fraden S, Epstein IR. Coupled oscillations in a 1D emulsion of Belousov–Zhabotinsky droplets. Soft Matter. 2011;7(7):3155–3167. [Google Scholar]
- 10.MathWorks, MATLAB “imopen” documentation (online, accessed January 18, 2015).
- 11.Russ JC. The Image Processing Handbook. 6th ed. CRC Press; Boca Raton, FL: 2011. [Google Scholar]
- 12.Itoga K, Kobayashi J, Yamato M, Kikuchi A, Okano T. Maskless liquid-crystal-display projection photolithography for improved design flexibility of cellular micropatterns. Biomaterials. 2006;27(15):3005–3009. doi: 10.1016/j.biomaterials.2005.12.023. [DOI] [PubMed] [Google Scholar]
- 13.Naiser T, Mai T, Michel W, Ott A. Versatile maskless microscope projection photolithography system and its application in light-directed fabrication of dna microarrays. Rev. Sci. Instrum. 2006;77(6):063711. [Google Scholar]
- 14.Witman GB. Chlamydomonas phototaxis. Trends Cell Biol. 1993;3(11):403–408. doi: 10.1016/0962-8924(93)90091-e. [DOI] [PubMed] [Google Scholar]
- 15.Nagao R, Epstein IR, Dolnik M. Forcing of Turing patterns in the chlorine dioxide–iodine–malonic acid reaction with strong visible light. J. Phys. Chem. A. 2013;117(38):9120–9126. doi: 10.1021/jp4073069. [DOI] [PubMed] [Google Scholar]
- 16.Stone C, Toth R, de Lacy Costello B, Bull L, Adamatzky A. Coevolving Cellular Automata with Memory for Chemical Computing: Boolean Logic Gates in the BZ Reaction, Parallel Problem Solving from Nature. Springer; Berlin Heidelberg: 2008. pp. 579–588. [Google Scholar]
- 17.Steinbock O, Tóth Á, Showalter K. Navigating complex labyrinths: optimal paths from chemical waves. Science. 1995;267:868–871. doi: 10.1126/science.267.5199.868. [DOI] [PubMed] [Google Scholar]
Associated Data
This section collects any data citations, data availability statements, or supplementary materials included in this article.


