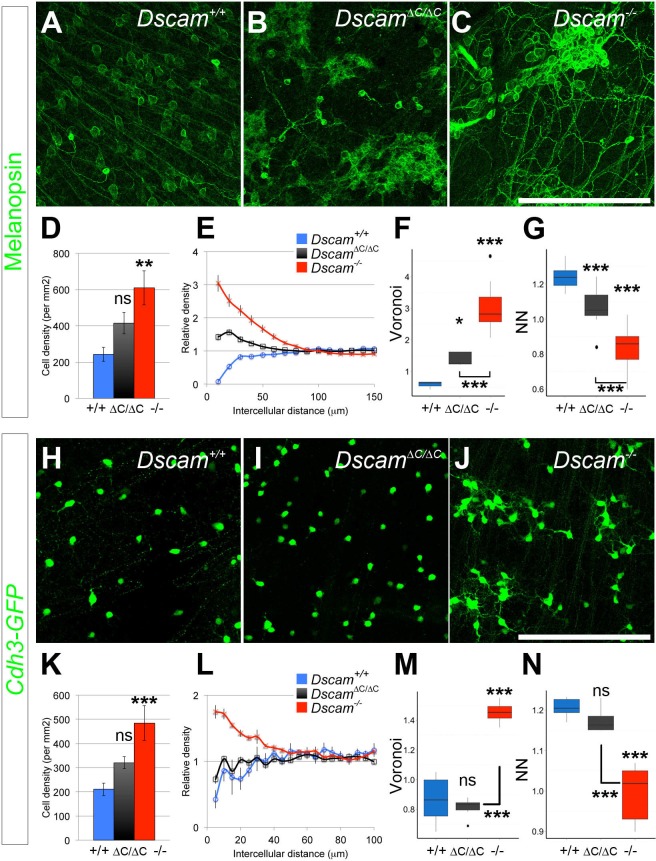
Figure 3. RGCs also display differential dependence on DSCAM C-terminal interactions for self-avoidance.
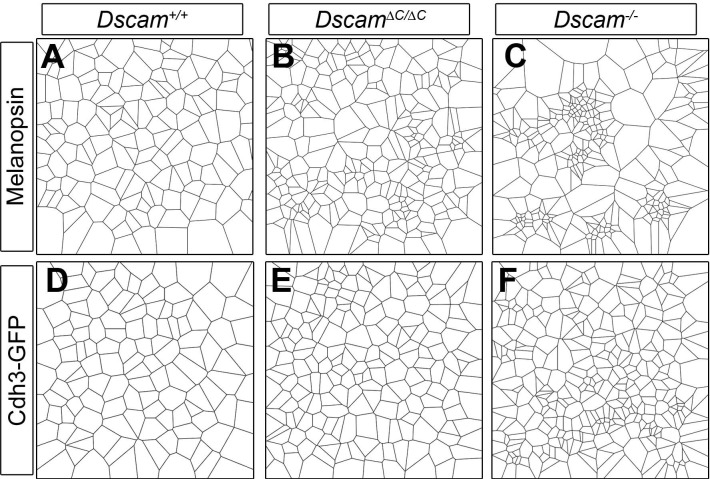
(A–C) Melanopsin-positive intrinsically photoresponsive retinal ganglion cells are found in a mosaic pattern in wild type retinas (A), but at two weeks of age, ipRGC cell bodies in Dscam∆C/∆C (B) retinas are pulled into clusters similar to those in Dscam-/- (C) retinas. (D) Overall ipRGC density was not significantly increased in Dscam∆C/∆C retinas. (E) By DRP, cell body clustering was intermediate between Dscam+/+ and Dscam-/- retinas. Voronoi (F) and nearest neighbor (G) analyses also revealed a clear intermediate defect. Values from Dscam∆C/∆C retinas were significantly different from both control and Dscam-/- mutants. (H–J) Cdh3-GFP RGCs are mosaically spaced in control retinas (H), and this spacing is not perturbed in the Dscam∆C/∆C retinas (I), but these cells form clusters in Dscam-/- animals (J), indicating interactions mediated by DSCAM’s C-terminus are dispensable to prevent these cells from clustering. (K) Cdh3-GFP RGC overall cell density was significantly increased in Dscam-/- retinas, but not in Dscam∆C/∆C mutants. (L) A clear exclusion zone is detectable by DRP analysis in Dscam+/+ and Dscam∆C/∆C retinas. This exclusion zone is lost in Dscam-/- animals, where cell density is increased adjacent to any given cell, indicative of clustering. Similarly, Voronoi (M) and nearest neighbor (N) analyses describe a clear spacing defect in Dscam-/- but not in Dscam∆C/∆C retinas. Means ± s.e.m. are represented in D–E, K–L. Box plots represent the median, first and third quartile, range, and outliers. N = 6 retinas per genotype. *p<0.05; **p<0.01; ***p<0.001; n.s. is not significant by Tukey post-hoc test between indicated genotypes or compared to controls. Scale bar is 250 µm. Representative Voronoi domains are in Figure 3—figure supplement 1.


