Abstract
Guaranteeing high-quality next-generation sequencing data in a rapidly changing environment is an ongoing challenge. The introduction of the Illumina NextSeq 500 and the depreciation of specific metrics from Illumina's Sequencing Analysis Viewer (SAV; Illumina, San Diego, CA, USA) have made it more difficult to determine directly the baseline error rate of sequencing runs. To improve our ability to measure base quality, we have created an open-source tool to construct the Percent Perfect Reads (PPR) plot, previously provided by the Illumina sequencers. The PPR program is compatible with HiSeq 2000/2500, MiSeq, and NextSeq 500 instruments and provides an alternative to Illumina's quality value (Q) scores for determining run quality. Whereas Q scores are representative of run quality, they are often overestimated and are sourced from different look-up tables for each platform. The PPR’s unique capabilities as a cross-instrument comparison device, as a troubleshooting tool, and as a tool for monitoring instrument performance can provide an increase in clarity over SAV metrics that is often crucial for maintaining instrument health. These capabilities are highlighted.
Keywords: genomics, bioinformatics, high-throughput DNA
INTRODUCTION
Given the context-specific character of sequencing errors, sequencing data are often subject to reliability issues. Basecall quality can vary significantly from cycle to cycle, as well as within a single cycle.1 The reduction of the influence of such instrument artifacts is essential for the acquisition of unbiased genomic data. However, assessing the magnitude of this influence in a context of rapidly evolving sequencing technologies has been inadequately addressed. Currently, the standard measure for sequencing quality on Illumina platforms is their Phred-like Q score,2 which represents the probability of a correct basecall. However, this metric is not the ideal choice for an unbiased measurement, as it is itself calibrated with instrument-dependent variables.3 Illumina Q scores are calculated by matching properties of clusters, such as intensity and signal-to-noise ratios, to a table of empirically acquired metrics.3 These values differ for each instrument, change with updates in the sequencing platform's chemistry or software, and are built under ideal circumstances.3
Illumina SAV Q scores and PPR use different methods to estimate basecall error rate. PPR used the alignment of a PhiX spike-in as an external control to measure the percentage of reads with 0–4 mismatches, providing a direct measurement of the intrinsic error rate. The graphic contains a cycle-by-cycle representation of the percentage of reads with 0 mismatches, percentage of reads with ≤1 mismatch, percentage of reads with ≤2 mismatches, and so on. This metric was introduced with the Genome Analyzer and was generated for all Illumina sequencers until its retirement in November 2014. As a simple external test of data reliability on a cycle-by-cycle basis, this metric is an unbiased utility for quality measurement that can flexibly handle the common variations that occur within Illumina reads, including mismatch rate changes with increasing read length or with changes in base composition within the read. Whereas current versions of SAV still contain information sourced from the PhiX alignment, this information (“Error Rate”) condenses the 0–3 mismatch rates into a single number (Illumina, written communication, June 2015) that does not indicate how the errors are distributed among or along the reads. Additionally, whereas Q scores are represented graphically, they are not a direct measurement of the error rate, as they rely on lookup tables derived in ideal circumstances. Here, we present a program that generates PPR from Illumina sequencing data, providing a sensitive, multidimensional representation of read quality that is information rich, while also being easy to interpret.
METHODS
Each sequencing run used a 150 or 300 cycle NextSeq 500 v1 or v2 High Output Sequencing Kit and corresponding High Output Flow Cell. Illumina libraries were quantified using real-time quantitative PCR, and loading concentrations varied between 0.8 and 1.7 pM. The Illumina PhiX bacteriophage genome was spiked in at concentrations between 1 and 25%, with 10% being the median. The PhiX bacteriophage genome was chosen as the reference genome, as it is the genome used in the previous PPR metric and current Error Rate metric in Illumina SAV. The libraries were standard submissions to the core facility from various research labs.
The PPR plot program is written in Perl and R, accepting FASTQ files as input. The bacteriophage PhiX is used as the reference genome for all studies in this manuscript. For HiSeq 2000/2500 lanes, the program reduces data quantity (down-sampling) by randomly selecting a total of 1/10 of the data from each lane from 10 evenly distributed vertical sections. Down-sampling of NextSeq 500 data is accomplished by using only a single tile, Tile 7, from each camera swath. MiSeq data are not down-sampled. After down-sampling, PhiX reads are identified by aligning the first 30 nucleotides to the PhiX bacteriophage genome using Bowtie 2.4 From those reads identified as being derived from PhiX, the entire forward and reverse reads are aligned and mismatches determined. The mismatch count is then calculated, and the PPR plot is created using R. The PPR software package5, 6 is available at http://openwetware.org/wiki/BioMicroCenter:PPR_Program (BioMicro Center, Massachusetts Institute of Technology, Cambridge, MA, USA).
RESULTS AND DISCUSSION
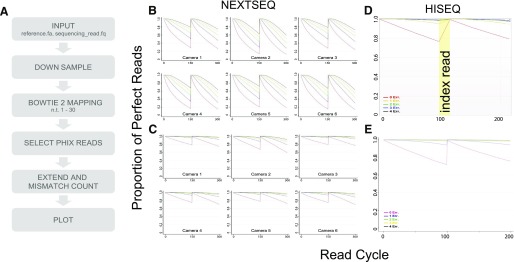
To more accurately evaluate the performance of the Illumina HiSeq 2000/2500, MiSeq, and NextSeq 500, the PPR graphics that had once been a part of Illumina's SAV were reimplemented. The algorithm uses Bowtie 24 to map a subset of PhiX spike-in reads rapidly to the PhiX reference genomic sequence and counts the number of mismatches based on this alignment (Fig. 1A). The alignment files allow determination of the cycles at which errors occur. The software described here is publicly available (Supplemental Material).
FIGURE 1.
PPR output for HiSeq 2000 and NextSeq 500. (A) PPR summary. (B) PPR plots for a 150 + 150 NextSeq 500 v1 run that clustered at a density of 1083 K/mm2 and yielded 494 million reads passing filter. (C) PPR plots for a 150 + 150 NextSeq 500 v2 run that clustered at a density of 525 K/mm2 and yielded 315 million reads passing filter. (D) PPR plot generated in Illumina SAV v1.8.37 for a HiSeq 2000 lane with index read shaded yellow. (E) PPR plot generated by our program for the same 100 + 8 + 8 + 100 HiSeq 2000 lane that clustered at a density of 742 K/mm2 and yielded 192 million reads passing filter.
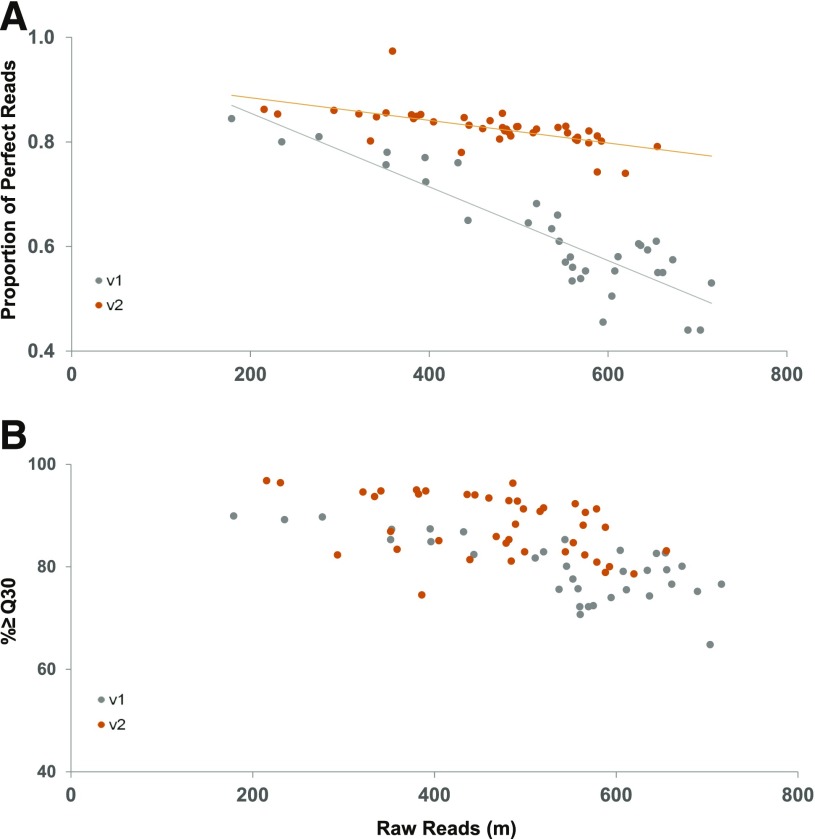
PPR was compared with Illumina’s % Perfect Reads and other Illumina quality metrics to demonstrate the consistency of our results (Fig. 1). Error rates measured by our program are consistent with other Illumina metrics, although our program measures higher error rates for runs with lower Clusters Passing Filter rates and lower percent ≥ Q30 scores, on average, for all platforms (Fig. 1B and C and Supplemental Table 1). HiSeq 2000 (Fig. 1C and D) and MiSeq (Supplemental Fig. 1) data showed similar reproducibility between plots. The observed deviation is likely a result of a harder quality filter in the original algorithm, which threw away some poor reads, whereas PPR's more permissive filter allows the program to function even on very low-quality reads (Supplemental Fig. 1). Additionally, for all Illumina sequencing platforms, an increase in cluster density results in a higher number of reads and after a certain increase, a lower number of reads passing Illumina’s quality filter as a result of the density of overlapping clusters. Given this trend, an increase in mismatches as cluster density increases is expected and is observed for both the Q score and PPR (Fig. 2).
FIGURE 2.
PPR and Illumina Q30 for v1 and v2 NextSeq 500 runs. (A) V2 chemistry data reveal a marked increase in error-free reads over v1 chemistry. Average v1 and v2 0 mismatch percentages are 59% and 71%, respectively. (B) V2 chemistry runs have higher average total percent ≥ Q30 scores and less drop-off in total percent ≥ Q30 scores with higher cluster densities. Average v1 and v2 Q scores are 80 and 87, respectively.
A comparison between Q30 and PPR data shows that the Q30 score consistently calculates a lower expected error rate than the one observed using the 0 mismatch rate from the PPR plots. For base calls with a Q30 quality score, 1 in 1000 basecalls is predicted to be incorrect.3 Therefore, the reported percent ≥ Q30 rate should approximate the 0 mismatch rate. However, PPR mismatch rates are consistently higher than those represented by reported Q30 scores (Fig. 2 and Supplemental Fig. 1), and Q score overestimation has been previously noted.7, 8 Interestingly, reference mismatches (Fig. 2A) seem to show a more sensitive response to read count than does Illumina Q30 (Fig. 2B).
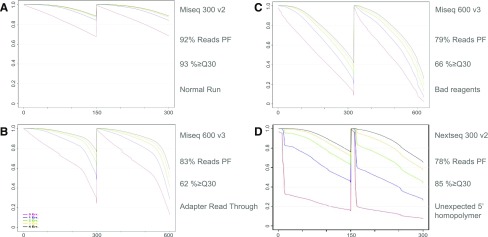
A valuable application of the PPR program is for diagnosing the causes of run failures. The identification of the cause of a run failure and the rectification of systematic errors across runs are complicated by the number and diversity of errors that can occur in Illumina sequencing, not all of which are instrument related. In a normal PPR plot, a roughly linear relationship is observed between read length and mismatches, which does not dip far below 80% perfect (Fig. 3A). Failed runs, in addition to having more mismatches, yield PPR profiles unique to the failure type. For instance, in the case where the insert to be sequenced is too short, the sequencing read can run off the end of the molecule. The PPR graph shows this error as a normal, linear error rate, followed by a sharp error-rate increase after the polymerase has run off the end of the amplicons (Fig. 3B). Likewise, issues with the Illumina chemistry can cause reads to decay rapidly in quality, resulting in sudden increases in error rate as individual reads go bad. The PPR graph shows this as a dramatic increase in the percentage of reads with >4 mismatches (Fig. 3C), whereas the percentage of reads with 0 mismatches decreases to below 20%. This suggests that once a single error occurs, read quality declines precipitously.
FIGURE 3.
PPR profiles for common sequencing failures. (A) A PPR plot for a normal run. (B) Adapter read-through failure mode. (C) Bad reagent failure mode. (D) Short repeating sequence failure mode.
The PPR program finds additional use in monitoring all 6 cameras separately for NextSeq 500 (Fig. 1B and C), insuring that failure of a single camera or a single part of the flow cell does not go unnoticed. This feature allowed quantification of the quality disparity between cameras: data from our worst camera, Camera 2, has, on average, 13% more errors than our best, Camera 3 (Fig. 1B and C), in runs that meet Illumina specification.
With the PPR plot, the user can often determine the source of sequencing error and possibly correct it. For example, in the above failures, several different responses were suggested. In Fig. 3B, the solution for the failure was to shorten the read length to avoid adapter sequence run-off, whereas the failure in Fig. 3C was determined to be tied to the quality of the sequencing reagents. In many instances, such as in Fig. 3D, the data are workable and should proceed to analysis. In this case, a low-complexity region of a unique molecular identifier at the 5′ end of the read caused major errors in the PhiX alignment. However, as those specific bases are not used in analysis (they are the linker between the molecular identifier and the genomic sequence), the errors at this position can be ignored, and the data are amenable to further analysis. These additional details could speed troubleshooting both for the user and for Illumina technical support.
Unsurprisingly, a key feature of an instrument-related issue is that it occurs across several runs, regardless of sample identity or sequencing kit. By monitoring PPR quality across runs, a user can identify gradual decreases in run quality that are tied to a degradation in instrument performance. Such a decrease would be observed across many different sequencing kits and with differing sequencing libraries, eliminating the libraries and reagents as possible causes. Figure 4 shows such a quality-drop progression in Camera 1 over the course of 6 runs, suggesting a technical issue with the NextSeq 500 in question. This diagnosis was confirmed by Illumina and led to a quick replacement of the cameras.
FIGURE 4.
PPR profiles showing decay of Camera 1 over time.
The program outlined above provides HiSeq 2000/2500, NextSeq 500, and MiSeq users an alternative to Illumina Q score for assessing sequencing error rate. This tool can be used for comparing error rates between runs and between instruments, for monitoring NextSeq 500 camera performance, and for diagnosing run failures. Whereas imaging metrics contain important information, this information does not always correlate with data quality. A PhiX alignment is a quality metric that is independent of imaging technology and therefore, can provide a more objective comparison between platforms.
Supplementary Material
ACKNOWLEDGMENTS
The authors are grateful to members of the MIT BioMicro Center and Illumina, Inc., for the helpful discussions and comments on the manuscript. The authors also thank Sumeet Gupta in the Whitehead Genomics Technology Core and Zachary Hebert in the Dana Farber Cancer Institute Molecular Biology Core Facility for software testing. This work was funded by the National Cancer Institute of the U.S. National Institutes of Health (NIH) under Award P30-CA14051 and by the National Institute of Environmental Health Sciences of the NIH under Award P30-ES002109. The authors do not claim any financial conflict of interest.
REFERENCES
- 1.Nakamura K, Oshima T, Morimoto T, et al. Sequence-specific error profile of Illumina sequencers. Nucleic Acids Res 2011;39:e90. [DOI] [PMC free article] [PubMed] [Google Scholar]
- 2.Ewing B, Green P. Base-calling of automated sequencer traces using Phred. II. Error probabilities. Genome Res 1998;8:186–194. [PubMed] [Google Scholar]
- 3.Understanding Illumina Quality Scores. San Diego, CA: Illumina, Inc., 2014;Pub. No. 770-2012-058.
- 4.Langmead B, Salzberg SL. Fast gapped-read alignment with Bowtie 2. Nat Methods 2012;9:357–359. [DOI] [PMC free article] [PubMed] [Google Scholar]
- 5.Gordon A, Hannon GJ. FASTX-Toolkit Version 0.0.13 computer program 2010.
- 6.Quinlan AR, Hall IM. bedtools Version 2.20.1 computer program 2010.
- 7.Dohm JC, Lottaz C, Borodina T, Himmelbauer H. Substantial biases in ultra-short read data sets from high-throughput DNA sequencing. Nucleic Acids Res 2008;36:e105. [DOI] [PMC free article] [PubMed] [Google Scholar]
- 8.DePristo MA, Banks E, Poplin R, et al. A framework for variation discovery and genotyping using next-generation DNA sequencing data. Nat Genet 2011;43:491–498. [DOI] [PMC free article] [PubMed] [Google Scholar]
Associated Data
This section collects any data citations, data availability statements, or supplementary materials included in this article.


