Abstract
Previous studies have suggested that kidney donors may have abnormalities of mineral and bone metabolism typically seen in chronic kidney disease. This may have important implications for the skeletal health of living kidney donors and for our understanding of the pathogenesis of long term mineral and bone disorders in chronic kidney disease. In this prospective study, 182 of 203 kidney donors and 173 of 201 paired normal controls had markers of mineral and bone metabolism measured before and at 6 and 36 months after donation (ALTOLD Study). Donors had significantly higher serum concentrations of intact parathyroid hormone (24.6% and 19.5%) and fibroblast growth factor-23 (9.5% and 8.4%) at 6 and 36 months, respectively, as compared to healthy controls, and significantly reduced tubular phosphate reabsorption (−7.0% and −5.0%) and serum phosphate concentrations (−6.4% and −2.3%). Serum 1,25-dihydroxyvitamin D3 concentrations were significantly lower (−17.1% and −12.6%), while 25-hydroxyvitamin D (21.4% and 19.4%,) concentrations were significantly higher in donors compared to controls. Moreover, significantly higher concentrations of the bone resorption markers, carboxyterminal cross-linking telopeptide of bone collagen (30.1% and 13.8%) and aminoterminal cross-linking telopeptide of bone collagen (14.2% and 13.0%), and the bone formation markers, osteocalcin (26.3% and 2.7%), and procollagen type I N-terminal propetide (24.3% and 8.9%) were observed in donors. Thus, kidney donation alters serum markers of bone metabolism that could reflect impaired bone health. Additional long term studies that include assessment of skeletal architecture and integrity are warranted in kidney donors.
Keywords: FGF23, hyperparathyroidism, parathyroid hormone, mineral metabolism
INTRODUCTION
There are compelling reasons to understand the short- and long-term effects of kidney donation on donors.1, 2 First, it is important to know the adverse consequences of donation to appropriately inform potential donors of inherent risks of donation. Second, kidney donation is an opportunity to better understand the physiological effects of mild reductions in kidney function without the confounding effects of underlying kidney disease.
Whether kidney donors with a glomerular filtration rate less than 60 mL/min/1.73m2 should be classified as having chronic kidney disease (CKD) as suggested in current guidelines is controversial.3, 4 One reason to classify someone as having CKD is to alert individuals and caregivers to possible preventable or treatable complications. Individuals with CKD typically have abnormalities of calcium and phosphorus regulation.5 Previous studies have reported that kidney donors have increased concentrations of serum parathyroid hormone (PTH) and fibroblast growth factor-23 (FGF23).6–14 Studies report that donors have reduced serum concentrations of 1,25-dihydroxyvitamin D3 (1,25(OH)2D3, calcitriol).7–11, 13 Most studies, however, have been small, with short-term follow-up. Only one study has been prospective and controlled, and only 1-year follow-up has been reported.14 None of these studies has reported a comprehensive assessment of mineral metabolism.
To examine the possible health-related consequences of kidney donation we conducted a prospective, controlled study of living kidney donors and paired normal controls (“Assessing Long Term Outcomes in Living Kidney Donors (ALTOLD)”.15, 16 We previously reported that for up to 3 years after donation, serum PTH concentrations were elevated in donors compared to pre-donation values and compared to controls.16 Because of these observations, and previous reports of elevated PTH and FGF23 concentrations among donors, we measured serum concentrations of intact PTH, intact FGF23, 25-hydroxyvitamin D, 1,25(OH)2D3, the tubular reabsorption of calcium and phosphorus, and markers of bone resorption and formation in donors and controls. The results show that 3 years after kidney donation, donors have increased PTH, FGF23 and reduced 1,25(OH)2D3 concentrations, and concomitant increases in serum markers of bone resorption, which if persistent could place donors at risk of increased bone loss in future years.
RESULTS
PARTICIPANT CHARACTERISTICS
Donors and controls were similar at baseline (Table 1). Donors were more likely to have a blood relationship to the transplant recipient than were controls. The numbers of participants taking an oral vitamin D and/or a calcium supplement were similar in controls and donors. There were no differences in body weight or body mass index. The participants differed from living donors in the USA in some important ways: compared to all living donors in the US, study participants were less likely to be male, more likely to be white, and more likely to be younger in age.15
Table 1.
Participant characteristics.1
| Characteristic | Controls (N=173) | Donors (N=182) | P-Value |
|---|---|---|---|
| Male sex | 60/173 (34.7%) | 62/182 (34.1%) | 0.91 |
| Non-white ethnicity | 8/173 (4.6%) | 11/182 (6.0%) | 0.64 |
| Blood relative of the transplant recipient | 40/173 (23.1%) | 98/182 (54.1%) | <0.001 |
| Vitamin D supplement used before donation | 6/173 (3.5%) | 7/182 (3.9%) | 0.85 |
| Vitamin D supplement used at 6 months after donation | 8/170 (4.7%) | 7/180 (3.9%) | 0.71 |
| Vitamin D supplement used at 36 months after donation | 26/173 (15.0%) | 17/182 (9.3%) | 0.11 |
| Calcium supplement used at before donation | 14/173 (8.1%) | 6/182 (3.3%) | 0.05 |
| Calcium supplement used at 6 months after donation | 15/170 (8.9%) | 8/180 (4.5%) | 0.10 |
| Calcium supplement used at 36 months after donation | 21/173 (12.1%) | 16/182 (8.8%) | 0.30 |
| Age at baseline before donation (years) | 43.4 (41.5–45.2) | 43.6 (42.0–45.3) | 0.84 |
| Body mass index at baseline before donation (kg/m2) | 26.7 (26.0–27.5) | 26.6 (26.0–27.2) | 0.81 |
Values are numbers (and % in parentheses) of controls or donors with the characteristic, or means (and 95% Confidence Intervals) for age and body mass index.
Glomerular filtration rate declined as expected after donation, but increased slightly among donors and declined slightly in controls between visits at 6 and 36 months after donation (Table 2). Serum albumin concentration appeared to decline slightly over time, but was not different in donors versus controls. C-reactive protein, urine protein and urine albumin concentrations were similar in donors and controls and changed little before and after donation.
Table 2.
Laboratory Measurements Before, and at 6 and 36 Months after Kidney Donation.
| Test | Group | Visits | P-Values Donors v. Controlsa | ||||
|---|---|---|---|---|---|---|---|
| Baseline before | 6 months after | 36 months after | Baseline | 6 months | 36 months | ||
| Serum creatinine (mg/dL) |
Controls | 0.79 (0.77–0.81) (172) |
0.80 (0.78–0.83) (168) |
0.80 (0.78–0.82) (173) |
0.90 | <0.001 | <0.001 |
| Donors | 0.80±0.77–0.82) (167) |
1.17 (1.14–1.21) (176) |
1.10 (1.07–1.14) (182) |
||||
| Serum cystatin C (mg/dL) |
Controls | 0.71 (0.68–0.72) (171) |
0.71 (0.69–0.73) (168) |
0.74 (0.72–0.76) (173) |
0.64 | <0.001 | <0.001 |
| Donors | 0.70 (0.68–0.72) (167) |
0.95 (0.93–0.97) (176) |
0.96 (0.94–0.99) (182) |
||||
| mGFR mL/min/1.73m2 |
Controls | 96.0 (93.6–98.3) (161) |
94.4 (92.1–96.8) (164) |
93.2 (91.0–95.4) (168) |
0.88 | <0.001 | <0.001 |
| Donors | 96.2 (94.0–98.4) (151) |
67.9 (66.4–69.4) (172) |
69.7 (68.2–71.2) (180) |
||||
| Serum albumin (mg/dL) |
Controls | 4.08 (4.03–4.12) (171) |
4.07 (4.02–4.12) (168) |
4.02 (3.97–4.06) (173) |
0.01 | 0.68 | 0.64 |
| Donors | 4.16 (4.11–4.20) (167) |
4.06 (4.02–4.11) (177) |
4.00 (3.96–4.04) (182) |
||||
| C-Reactive protein (mg/dL) |
Controls | 1.12 [0.51–2.75] (172) |
1.24 [0.58–3.03] (168) |
1.01 [0.57–2.44] (173) |
0.09b | 0.39b | 0.11b |
| Donors | 0.94 [0.46–1.84] (167) |
1.15 [0.65–2.64] (177) |
1.24 [0.60–2.99] (182) |
||||
| Urine PCR (g/g) | Controls | 62 [50–116] (169) | 68 [49–132] (166) |
63 [48–122] (169) |
0.45b | 0.86b | 0.72b |
| Donors | 66 [50–128] (161) | 70 [50–116] (177) |
60 [48–111] (181) |
||||
| Urine ACR (mg/g) | Controls | 5.06 [3.45–8.00] (161) |
4.73 [3.40–7.14] (164) |
4.66 [3.38–7.32] (168) |
0.09b | <0.001b | 0.45b |
| Donors | 4.48 [3.26–6.30] (154) |
3.41 [2.42–5.47] (175) |
4.18 [2.73–7.12] (180) |
||||
Note: Values are means (95% confidence intervals) or medians [interquartile range] and (number sampled).
Abbreviations: mGFR, glomerular filtration rate measured by iohexol plasma clearance; PCR, urine protein:creatinine ratio; ACR, urine albumin:creatinine ratio.
Analysis of variance with repeated measures (generalized linear mixed-effect models) with an unstructured covariance matrix. Covariance parameters were estimated using maximum likelihood estimation. P-values shown test the difference in least-square means of the donor effect at each study visit. Each variable was analyzed separately and no adjustment was made for multiple comparisons. Values not normally distributed were logarithmically transformed before analysis.
Based on logarithmically transformed values.
PARATHYROID HORMONE, FIBROBLAST GROWTH FACTOR-23 AND FRACTIONAL REABSORPTION OF PHOSPHATE
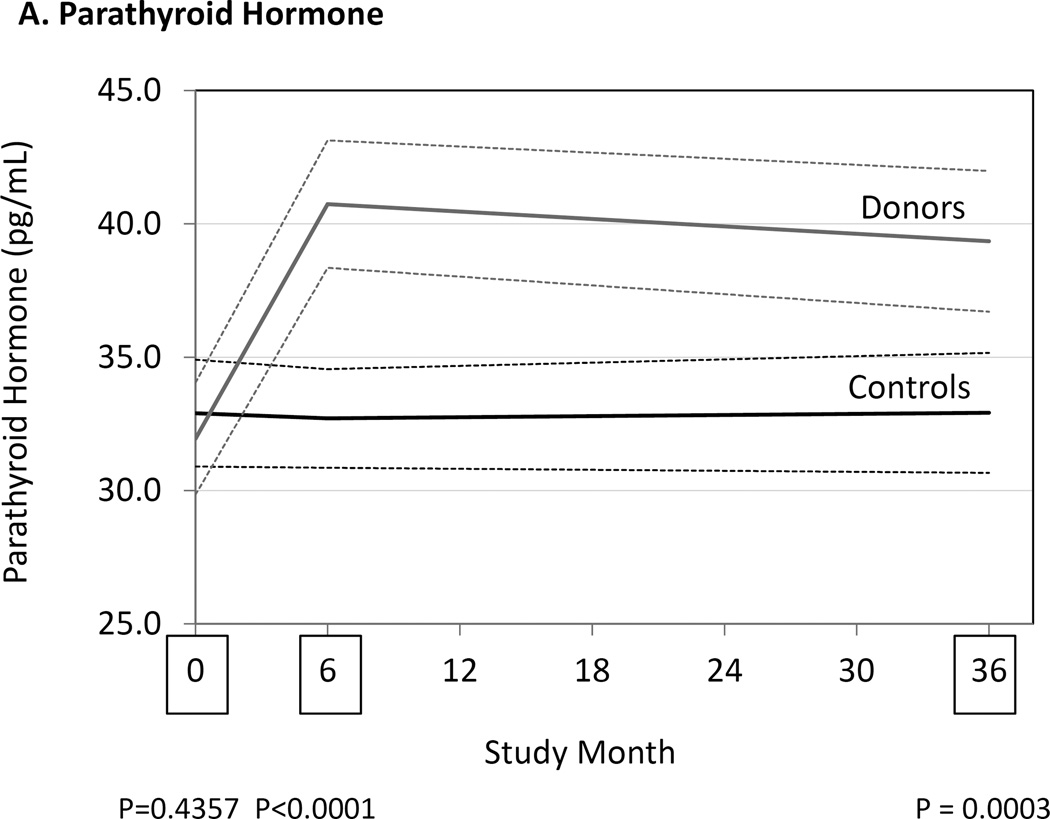
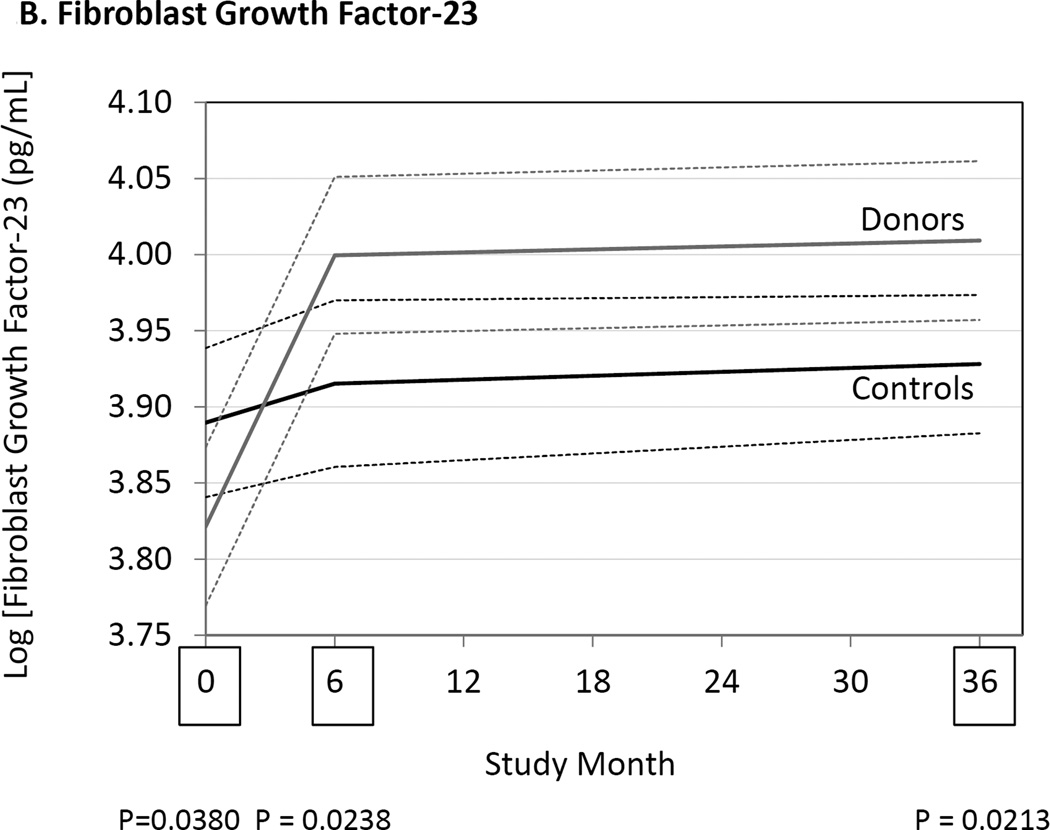
At 6 and 36 months serum PTH concentrations had increased in donors compared to controls (Fig. 1, Table 3). Serum FGF23 concentrations were also higher in donors than controls at 6 and 36 months. Increases in serum PTH and FGF23 were associated with a reduction in the tubular reabsorption of phosphate in the donor group, but not in the control group. The serum phosphate concentration was lower in donors than controls at 6 months but not different at 36 months. Serum calcium and fractional tubular resorption of calcium were not affected by kidney donation (Table 3).
Figure 1.
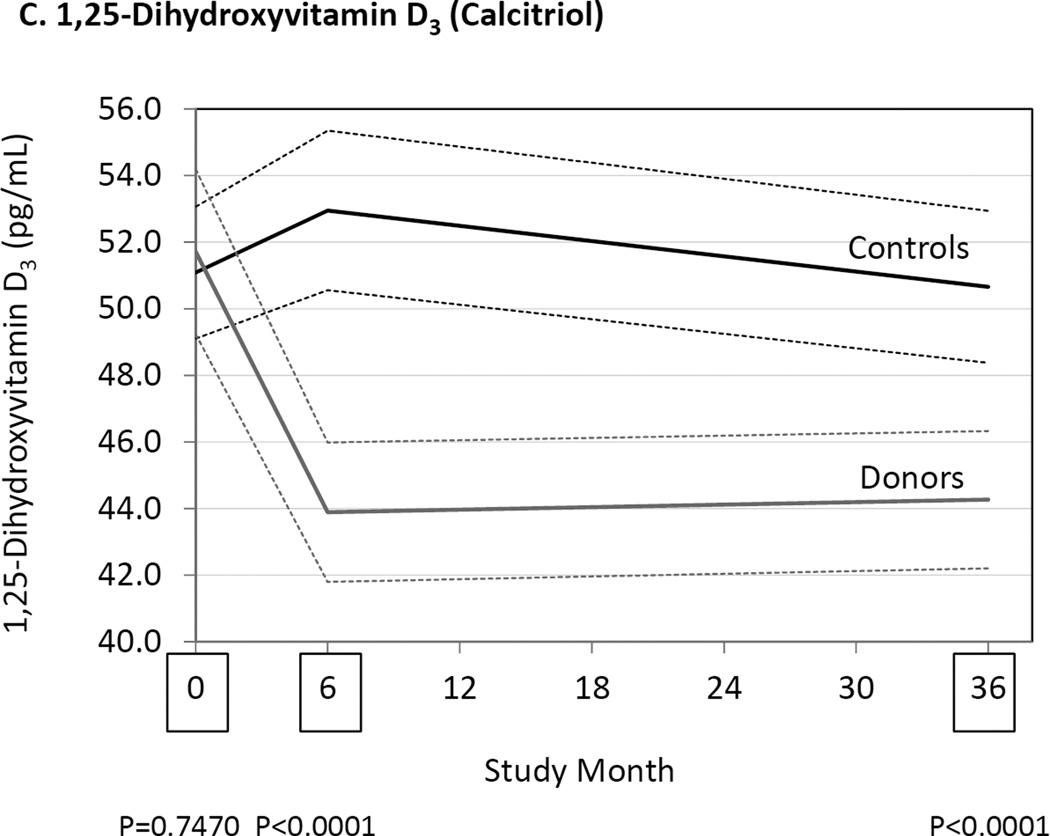
Differences between donors and controls, before and after donation, in concentrations of serum parathyroid hormone (Panel A), fibroblast growth factor-23 (Panel B), and 1,25-dihydroxyvitamin D3 (Panel C). Gray solid lines are means and gray dashed lines are 95% confidence intervals for controls. Black solid lines are means and black dashed lines are 95% confidence intervals for controls. P-values compare donors with controls. The times of study visits are indicated on the x-axis by squares. The numbers of samples assayed and the values at each time point are indicated in Table 3.
Table 3.
The effect of kidney donation on mineral and bone disorders biomarkers.
| Test | Group | Visits | P-Values Donors v. Controlsa | ||||
|---|---|---|---|---|---|---|---|
| Baseline before | 6 months after | 36 months after | Baseline | 6 months | 36 months | ||
| Serum Calcium (mg/dL) |
Controls | 9.14 (9.08–9.19) (172) |
9.19 (9.13–9.25) (168) |
9.21 (9.15–9.27) (173) |
0.02 | 0.24 | 0.26 |
| Donors | 9.24 (9.19–9.30) (167) |
9.24 (9.18–9.30) (177) |
9..26 (9.20–9.32) (182) |
||||
| Tubular Resorption of Calcium % |
Controls | 99.3 (99.2–99.4) (169) |
99.3 (99.2–99.4) (165) |
99.2 (99.2–99.3) (168) |
0.16 | 0.19 | 0.36 |
| Donors | 99.2 (99.1–99.3) (161) |
99.2 (99.1–99.3) (175) |
99.2 (99.1–99.3) (179) |
||||
| Serum Phosphate (mg/dL) |
Controls | 3.48 (3.40–3.56) (170) |
3.51 (343–3.58) (168) |
3.51 (3.44–3.57) (172) |
0.66 | <0.001 | 0.12 |
| Donors | 3.51 (3.43–3.58) (167) |
3.28 (3.21–3.35) (177) |
3.42 (3.35–3.50) (178) |
||||
| Tubular Resorption of Phosphate % |
Controls | 90.3 (89.6–91.0) (167) |
90.3 (89.6–91.0) (165) |
90.1 (89.4–90.8) (167) |
0.54 | <0.001 | <0.001 |
| Donors | 89.9 (89.1–90.7) (167) |
84.0 (83.1–85.0) (175) |
85.6 (84.7–86.5) (175) |
||||
| Parathyroid Hormone (pg/mL) |
Controls | 32.9 (30.9–34.9) (172) |
32.7 (30.9–34.6) (168) |
32.9 (30.7–35.2) (173) |
0.44 | <0.001 | <0.001 |
| Donors | 31.9 (29.8–34.0) (167) |
40.7 (38.3–43.1) (177) |
39.3 (36.7–42.0) (182) |
||||
| FGF23 (pg/mL) | Controls | 49.7 [40.9–59.5] (172) |
50.3 [40.6–60.2] (168) |
53.2 [42.6–61.5] (173) |
0.04b | 0.02b | 0.02b |
| Donors | 45.1 [38.7–55.4] (167) |
55.1 [43.9–66.2] (177) |
54.9 [42.6–61.5] (182) |
||||
| N-Telopeptide (BCE/L) |
Controls | 12.6 [9.9–16.0] (172) |
13.4 [10.4–16.4] (168) |
13.5 [10.9–17.8] (173) |
0.69e | <0.001e | 0.001e |
| Donors | 12.8 [10.2–16.0] (167) |
15.3 [11.6–19.7] (177) |
15.3 [11.7–20.1] (182) |
||||
| C-Terminal Peptide of Type I Collagen (ng/mL) |
Controls | 0.33 [0.27–0.49] (172) |
0.36 [0.28–0.48 (168) |
0.37 [0.28–0.48] (173) |
0.47b | <0.001b | 0.002b |
| Donors | 0.36 [0.27–0.52] (167) |
0.46 [0.32–0.58] (176) |
0.42 [0.31–0.63] (182) |
||||
| Tartrate Resistant Acid Phosphatase 5b (U/L) |
Controls | 2.40 (2.31–2.49) (172) |
2.36 (2.27–2.44) (168) |
2.46 (2.37–2.56) (173) |
0.10 | 0.03 | 0.21 |
| Donors | 2.53 (2.42–2.64) (167) |
2.49 (2.39–2.59) (177) |
2.55 (2.45–2.66) (182) |
||||
| Osteocalcin (ng/mL) |
Controls | 19.1 [15.4–24.2] (172) |
19.2 [15.6–23.7] (168) |
20.3 [15.8–24.6] (173) |
0.36b | <0.001b | <0.001b |
| Donors | 19.8 [16.0–25.0] (167) |
23.8 [18.7–31.1] (177) |
22.1 [17.2–29.6] (182) |
||||
| Alkaline Phosphatase (U/L) |
Controls | 68.7 (65.2–72.1) (167) |
66.4 (63.2–69.7) (164) |
65.3 (62.5–68.0) (172) |
0.45 | 0.03 | 0.13 |
| Donors | 71.2 (67.9–74.5) (162) |
71.7 (68.4–75.1) (176) |
68.2 (65.3–71.0) (180) |
||||
| Bone Alkaline Phosphatase (U/L) |
Controls | 21.2 [17.3–25.3] (172) |
21.1 [18.0–26.3] (168) |
21.4 [17.4–25.7] (173) |
0.012b | 0.002b | 0.011b |
| Donors | 23.4 [19.1–28.3] (167) |
24.8 [19.4–29.5] (177) |
23.7 [19.1–28.4] (182) |
||||
| Procollagen Type I (µg/L) |
Controls | 47.2 [35.7–57.1] (169) |
43.6 [36.8–60.2] (164) |
46.5 [35.2–62.4] (168) |
0.38b | 0.001b | 0.11b |
| Donors | 49.5 [36.5–63.4] (162) |
55.0 [39.7–70.3] (169) |
47.7 [36.0–69.0] (175) |
||||
| 1,25(OH)2 D3 (pg/mL) |
Controls | 51.1 (49.1–53.1) (166) |
53.0 (50.6–55.3) (167) |
50.7 (48.4–52.9) (164) |
0.75 | <0.001 | <0.001 |
| Donors | 51.7 (49.2–54.2) (167) |
43.9 (41,8–46.0) (173) |
44.3 (42.2–46.3) (176) |
||||
| 25OH D3 (ng/mL) |
Controls | 26.4 (24.9–27.9) (172) |
27.5 (26.1–28.9) (168) |
28.8 (27.0–30.6) (173) |
0.71 | <0.001 | <0.001 |
| Donors | 27.1 (25.5–28.6) (167) |
33.3 (31.4–35.1) (177) |
34.4 (32.7–36.2) (182) |
||||
| 25OH D Total (ng/mL) |
Controls | 27.1 (25.5–28.6) (171) |
28.0 (26.7–29.4) (168) |
29.4 (27.7–31.1) (173) |
0.55 | <0.001 | <0.001 |
| Donors | 28.0 (26.4–29.6) (167) |
34.0 (32.2–35.9) (177) |
35.1 (33.3–36.9) (182) |
||||
Note: Values are means (95% confidence intervals) or medians [interquartile range] and (number sampled).
Abbreviations: PTH, parathyroid hormone; FGF23, fibroblast growth factor-23; 1,25(OH)2 D3, 1,25 dihydroxyvitamin D3 (calcitriol); 25OH D3, 25 hydroxyvitamin D3; 25OH D Total, sum of 25 hydroxyvitamin D2 + 25 hydroxyvitamin D3.
Analysis of variance with repeated measures (generalized linear mixed-effect models) with an unstructured covariance matrix. Covariance parameters were estimated using maximum likelihood estimation. P-values shown test the difference in least-square means of the donor effect at each study visit. Each variable was analyzed separately and no adjustment was made for multiple comparisons. Values not normally distributed were logarithmically transformed before analysis.
Based on logarithmically transformed values.
VITAMIN D, CALCIUM AND FRACTIONAL EXCRETION OF CALCIUM
Serum 1,25(OH)2D3 concentrations were similar in donors and controls before kidney donation, but at 6 and 36 months 1,25(OH)2D3 concentrations were lower in donors compared to controls (Fig. 1, Table 3). Serum 25(OH)D concentrations were similar in donors and controls before kidney donation (Table 3). In the donor group, by 6 and 36 months, 25(OH)D concentrations had increased, while 25(OH)D concentrations remained unchanged in controls.
MARKERS OF BONE METABOLISM
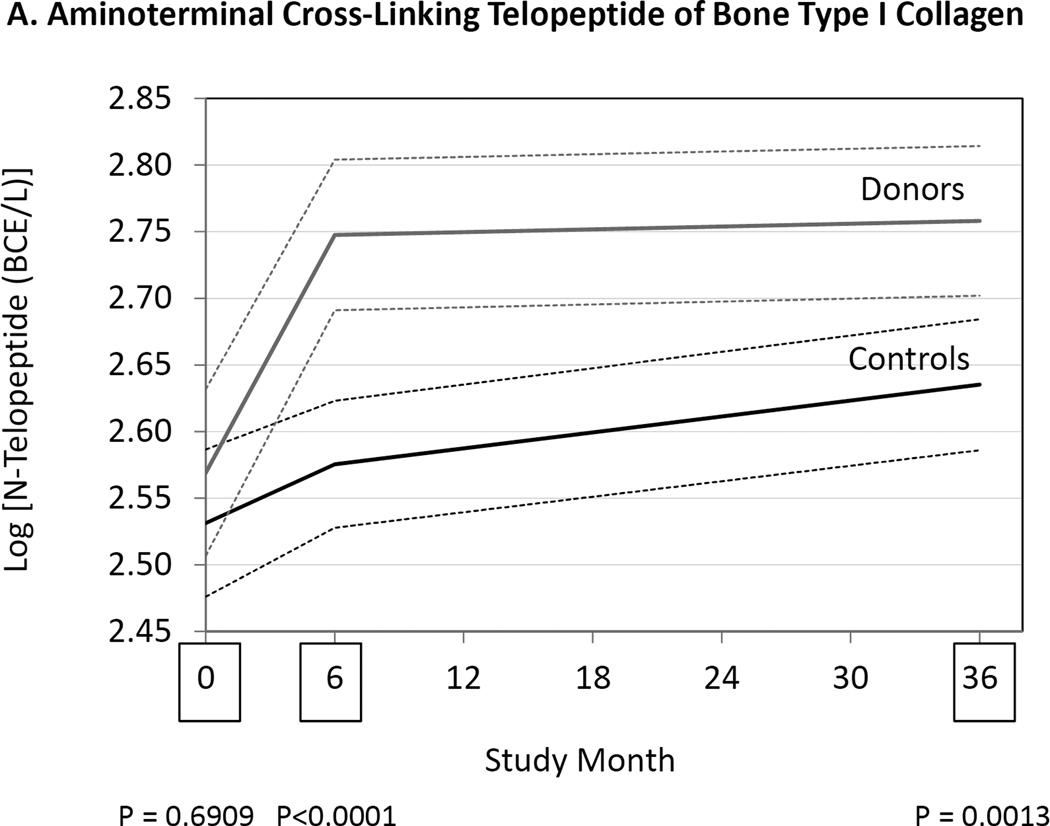
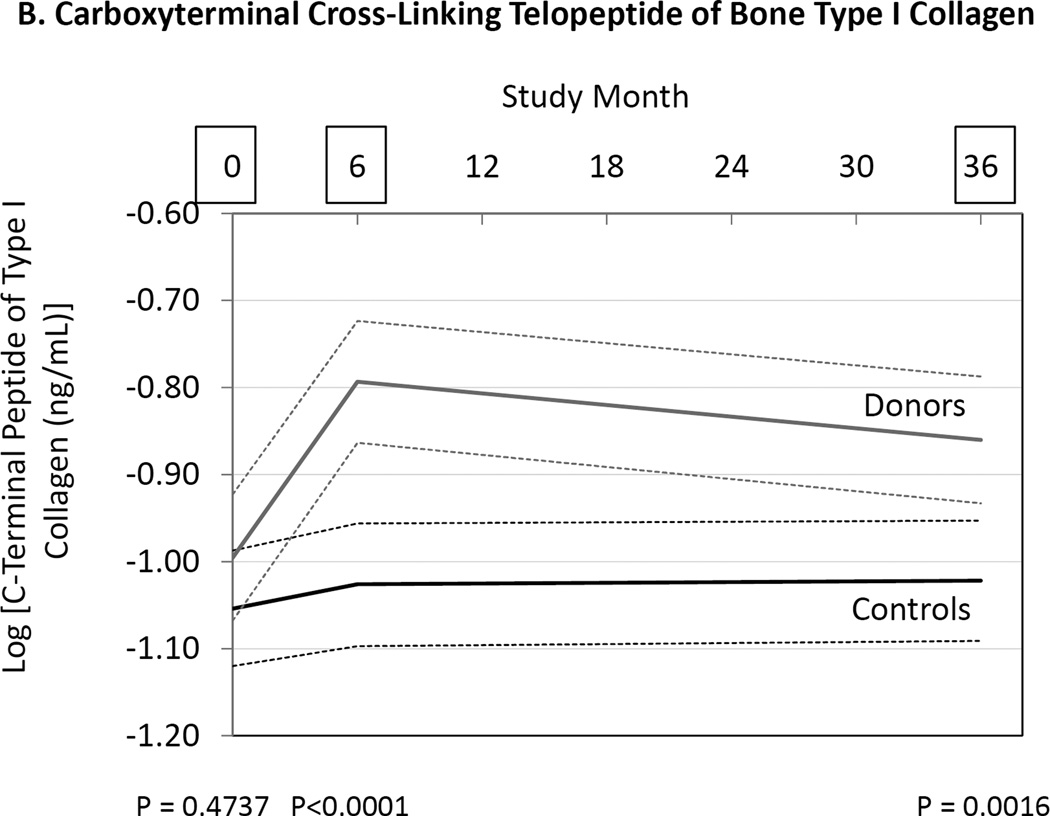
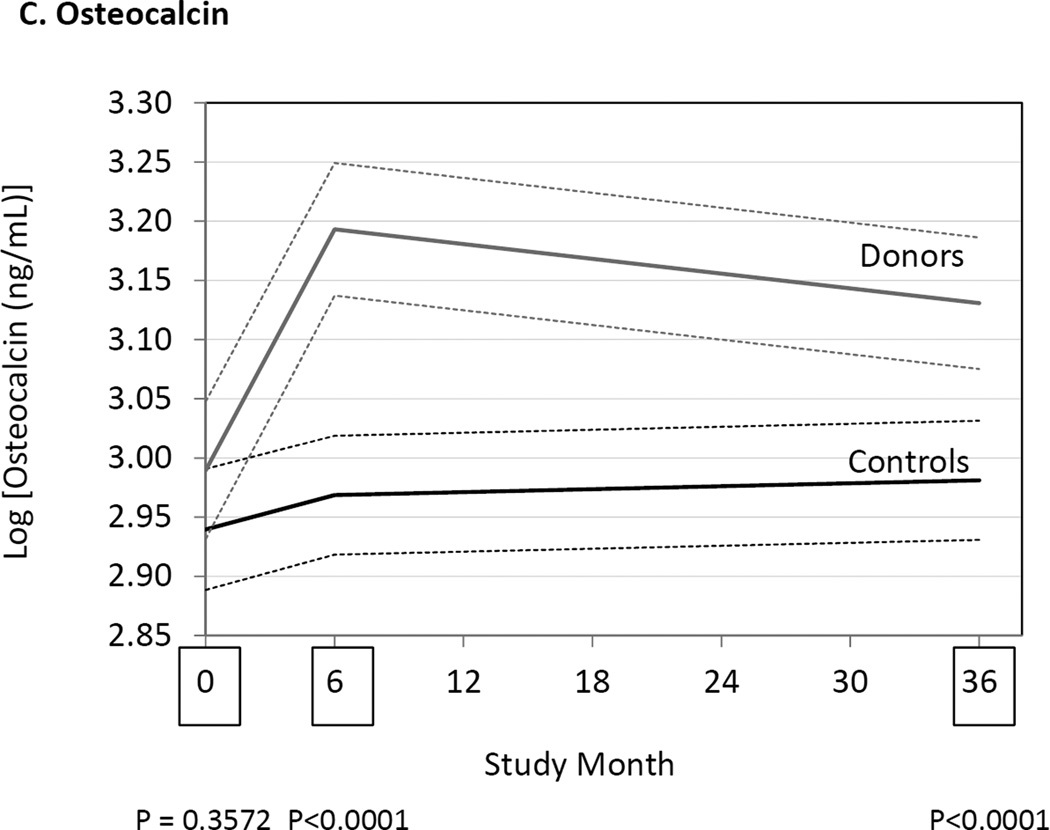
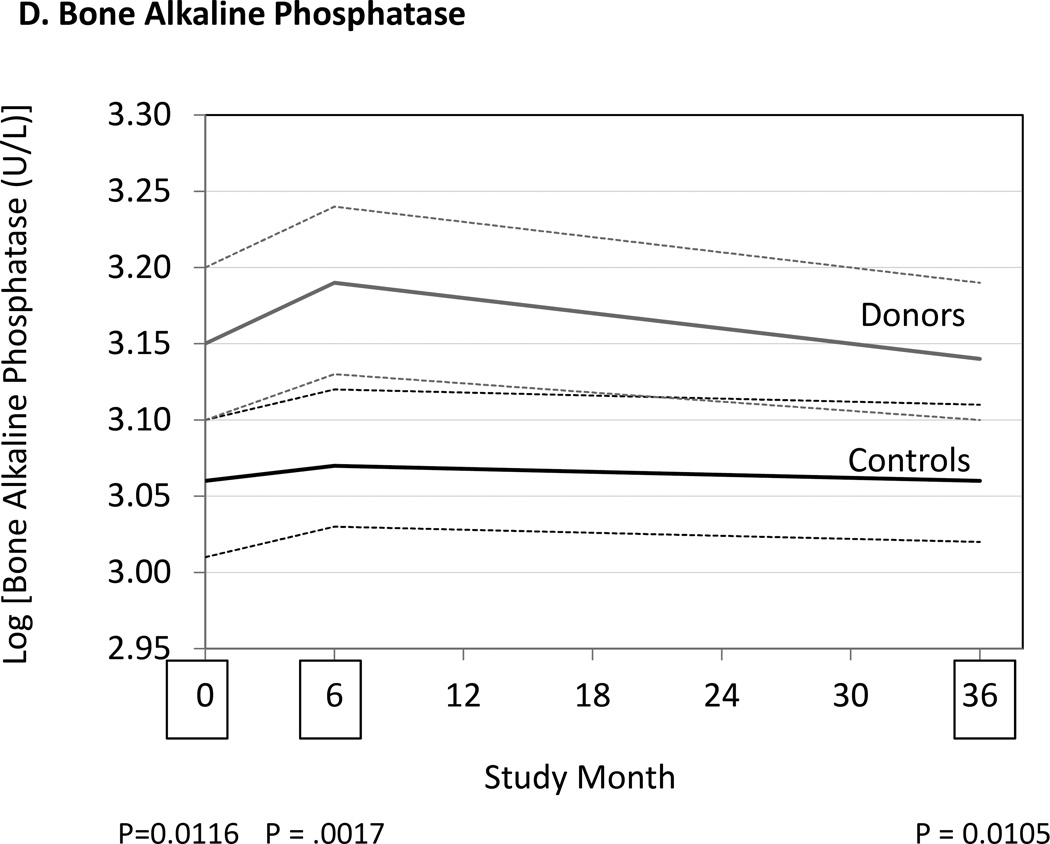
We measured markers of bone resorption and bone formation in donors and controls prior to and at 6 and 36 months following kidney donation. Bone resorption was assessed by measuring serum NTX, CTX and TRAP 5b, while bone formation was assessed measuring OC, BAP, and P1NP. Serum NTX and CTX were increased in donors compared to controls at both 6 and 36 months (Fig. 2, Table 3). TRAP 5b concentrations did not change in donors or controls. OC concentrations were higher in donors than controls at 6 and 36 months (Table 3), while P1NP concentration was higher at 6 months but not different at 36 months (Table 3). BAP concentrations were higher in donors than controls at 6 and 36 months, but BAP concentrations were also higher in donors than controls at baseline (Fig. 2, Table 3). Altogether the findings are consistent with increased bone turnover in donors compared to controls.
Figure 2.
Differences between donors and controls, before and after donation, in concentrations of serum aminoterminal cross-linking telopeptide of bone collagen (Panel A), carboxyterminal cross-linking telopetide of bone collagen (Panel B), osteocalcin (Panel C), and bone alkaline phosphatase (Panel D). Gray solid lines are means and gray dashed lines are 95% confidence intervals for controls. Black solid lines are means and black dashed lines are 95% confidence intervals for controls. P-values compare donors with controls. The times of study visits are indicated on the x-axis by squares. The numbers of samples assayed and the values at each time point are indicated in Table 3.
DISCUSSION
The principal findings of the current study at 3 years after kidney donation, are that donors show: 1) increased serum PTH and FGF23 concentrations; 2) increased fractional excretion of phosphate; 3) decreased serum 1,25(OH)2D3 and increased serum 25(OH)D concentrations; 4) no changes in serum calcium concentrations and the fractional excretion of calcium; and 5) an increase in bone turnover, manifest as an increase in bone resorption (NTX and CTX are increased), and an increase in bone formation (OC, BAP and P1NP are increased). The sequence of events leading to an increase in markers of bone turnover in kidney donors includes a reduction in GFR, associated reduction in the synthesis of 1,25(OH)2D3 (due to reduced renal mass and elevated FGF23 concentrations), and resultant secondary hyperparathyroidism.
The current study is the largest prospective study that compares kidney donors to a similar control group not undergoing surgery and selected before donation. We found 9 studies,6–14 not including the current study15, 16 reporting possible mineral and bone disorders in kidney donors (Table S1). Of the previous 9 studies, 5 were prospective, comparing changes before and after donation but did not include normal controls.6, 7, 10, 12, 13 Three others were retrospective, cross-sectional studies,8, 9, 11 and 1 of these studies included non-donor controls.11 Only 1 of the 9 studies was both prospective and controlled.14 There is considerable heterogeneity in the results of these studies. Some differences may be attributable to study design, particularly with differences in sample size (most being small) and duration of follow-up (most being short). Differences in the results could also reflect differences in assays.
We previously reported that serum phosphate concentration was decreased at 6 and 36 months after donation compared to controls.16 Despite reduced levels of serum phosphate, tubular resorption of phosphate declined (Table 3), indicating that renal phosphate excretion was the likely cause, or at least a contributing factor to the lower serum phosphate concentrations. Although 3 studies reported no change in serum phosphate concentrations,6, 10, 14 3 others reported a decline in phosphate after kidney donation.7, 11, 13 All studies that measured tubular resorption of phosphate reported a decline after donation.6–8, 10, 11, 13 Both PTH and FGF23 are known to be phosphaturic.17–19 Therefore, it is not surprising that both of these hormones were increased in donors compared to controls at 6 and 36 months after donation (Fig. 1, Table 3). Some,7, 11, 13, 14 but not all studies,9, 10 also reported that PTH concentrations increased after kidney donation. FGF23 was reportedly increased after kidney donation in 5 studies that measured it.10–14 Altogether, these results suggest that for at least 3 years after donation serum PTH and FGF23 are increased, possibly explaining why fractional excretion of phosphate is increased.
The presence of elevated serum FGF23 concentrations despite the presence of hypophosphatemia suggests the presence of autonomous (i.e. not responsive to changes in phosphate concentrations) synthesis of FGF23 in bone osteocytes20, 21 and supports the notion that bone metabolism is altered in subjects following kidney donation. Elevated PTH concentrations occurring as a result of reduced 1,25(OH)2D3 synthesis and attendant negative calcium balance could serve as the driver of altered bone metabolism and osteocyte activity following kidney donation. It is not known if alterations in the Klotho concentrations contribute to the hypophosphatemia seen following kidney donation22.
We found that serum 1,25(OH)2D3 was decreased at 6 and 36 months after donation (Fig. 1, Table 3). Similarly, others have reported reduced levels of 1,25(OH)2D3 in kidney donors,7, 9–11, 13 while results for 25(OH)D have been equivocal.7, 11, 13 We found that 25(OH)D3 and total 25(OH)D were unequivocally increased after donation (Table 3). These results are consistent with there being inadequate conversion of 25(OH)D3 to 1,25(OH)2D3 due to the reduction in kidney mass after organ donation, and that this effect persists for at least 3 years after donation. Nevertheless, as previously reported,7, 8, 10, 11, 13 we found serum calcium to be unchanged after donation, despite the reduced levels of 1,25(OH)2D3.
There have been few attempts to measure markers of bone metabolism in kidney donors. Ponte, et al., measured 2 markers of bone formation (BAP and P1NP) and 1 marker of bone resorption (CTX) in 27 kidney donors before donation, and at 6 months and 1 year after donation.13 They found that that BAP was increased at 6 months but not at 1 year compared to pre-donation, and P1NP was unchanged at 6 months and 1 year. Bone resorption measured by serum CTX determinations declined at 1 year compared to pre-donation.13 These results differ from those of the current study. In our study we found definitive evidence for an increase in bone resorption. Indeed, 2 of 3 markers of bone resorption (NTX and CTX) were increased. We also found that 2 markers of bone formation were increased (serum OC and P1NP). These findings suggest that bone turnover may be increased following kidney donation.
It is possible that the differences between donors and controls in MBD biomarkers seen in the current study simply reflect reduced renal clearance of the molecules and have no long term consequence to the donors. Indeed, the extent to which increases in biomarkers in donors compared to controls are due to differences in production, non-renal elimination or renal elimination is unclear. A very recent study examined single-pass renal clearance of PTH, FGF23, and vitamin D metabolites among 17 individuals from the general population undergoing heart catheterization23. The investigators found 44.2% ± 10.3% renal extraction of parathyroid hormone, which was greater than the extraction of creatinine (22.1% ± 7.9%). The renal extraction of FGF23 was 17.1% ± 19.5%. There were no differences in concentrations of vitamin D metabolites across the renal vein and artery; However, given the much longer plasma half-lives of vitamin D metabolites, the lack of large gradients across the renal artery and vein does not rule out slow renal clearance. We are not aware of other studies that have examined the renal clearance of MBD biomarkers in humans. A study in sheep found that plasma clearance of osteocalcin was reduced by unilateral nephrectomy24. Renal clearance of osteocalcin was 50–91% of plasma osteocalcin clearance, and the authors concluded that the kidney is the major site of osteocalcin clearance, although extra-renal sites made a significant contribution. We were unable to find studies directly measuring the renal clearance of the other MBD biomarkers that were examined in the present study. Not knowing the mechanisms for differences in plasma levels of MBD biomarkers between donors and controls does not diminish the potential for these differences to cause or contribute to bone disease. Nevertheless, additional studies into mechanisms causing acute and chronic changes in MBD biomarker concentrations after unilateral nephrectomy would be helpful.
The results of this study should be interpreted with caution. Although many studies have shown that MBD biomarkers correlate with bone mineral content and bone histology, evidence that these biomarkers correlate with fracture risk and outcomes in clinical trials of osteoporosis is weak.25 Thus, despite the findings in this study, it is not clear whether any of the reported abnormalities in mineral bone disorder biomarkers cause adverse outcomes of interest to living kidney donors. In a study of 2015 kidney donors in Canada, Garg, et al., failed to find an increased number of fractures compared to normal individuals in the general population.26 Similarly, although PTH, FGF23 and other MBD biomarkers have been found to be independent risk factors for cardiovascular disease in the general population and in patients with CKD,27–31 it is unclear whether kidney donation causes an increase in cardiovascular disease events or other adverse outcomes.32, 33
In summary, the results of this study provide the best evidence to date that mild reductions in kidney function in otherwise normal individuals may cause abnormalities in mineral metabolism. It is unequivocal that kidney donation causes increases in PTH, FGF23 and tubular excretion of phosphate. It is also clear that 1,25(OH)2D3 declines even as 25(OH)D3 and total 25(OH)D increase. These changes are also associated with changes in markers of bone metabolism. Additional studies, including studies of bone mineralization and bone metabolism over longer periods of time are warranted.
METHODS
INSTITUTIONAL APPROVALS
This study was approved by the institutional review boards at the participating sites, including the University of Minnesota, Minneapolis, MN (number 0503M67993); Hennepin County Medical Center, Minneapolis, MN; Mayo Clinic, Rochester, MN; Ohio State University, Columbus, OH; University of Maryland, Baltimore, MD; Johns Hopkins University, Baltimore, MD; University of Iowa, Iowa City, IA; and University of California at San Francisco, San Francisco, CA. Because this was an observational study and not a clinical trial, it was not registered in a clinical trials registry.
STUDY DESIGN AND POPULATION SAMPLE
Details of the study design have previously been reported.15, 16 Consecutive kidney donors at each study site were asked to participate prior to donation. For donors that consented to participate, a control was found that would have been a suitable donor at the same site as the donor. When more than one potential control was available, preference was given to age and sex to match the donor as closely as possible; 182 of 203 (89.7%) original donors and 173 of 201 (86.1%) original controls completed the 36 month follow-up visits.16
LABORATORY MEASUREMENTS
Serum and morning urine creatinine, phosphate and calcium were measured at the University of Minnesota Advanced Research and Diagnostic Laboratory.15, 16 Tubular resorption of phosphate was calculated as 100 × (1 − (urine phosphate × serum creaKnine/urine creaKnine × serum phosphate). Tubular resorption of calcium was similarly calculated.
Assays performed at the Mayo Clinic, Mayo Medical Laboratories, Immunochemical Core Laboratory or laboratory of one of the authors (RK) included:
Aminoterminal cross-linking telopeptide of bone type I collagen (NTX) is measured in serum by a quantitative competitive-inhibition enzyme-linked immunosorbent assay (Osteomark; Ostex International, Seattle, WA). Intra-assay coefficients of variation (CVs) are 6.9% and 2.5% at 7.5 and 30.2 nmol BCE/L, respectively. Inter-assay CVs are 17% and 7.1% at 7.2 and 26.5 nmol BCE/L, respectively.
Carboxyterminal cross-linking telopetide of bone type I collagen (CTX) is measured by a 2-site immunenzymatic sandwich assay on the Roche Cobas e411 (Roche Diagnostics, Indianapolis, IN). Intra-assay CVs are 7.8%, 2.7%, 3.2% and 1.9% at 0.046, 0.292, 0.709 and 2.94 ng/mL, respectively. Inter-assay CVs are 7.7 %, 8.5% and 7.8% at 0.291, 0.679 and 2.77 ng/mL, respectively.
Osteocalcin (OC) is measured by a 2-site immunenzymatic sandwich assay on the Roche Cobas e411 (Roche Diagnostics, Indianapolis, IN). Intra-assay CV’s are 2.8%, 1.3%, 1.2%, and 1.7% at 1.62, 14.5, 83.4 and 178 ng/mL respectively. Inter-assay CVs are 2.6%, 3.2% and 3.9% at 15.8, 87.2 and 186 ng/mL, respectively.
Bone alkaline phosphatase (BAP) is measured using an immunoassay from Metra Biosystems (Mountain View, CA). A monoclonal antibody captures bone alkaline phosphatase onto a solid-phase to measure its enzymatic activity. The assay has 3–8% cross-reactivity with liver alkaline phosphatase. Intra-assay CVs are 9.9% at 18 U/L and 8.3 % at 64 U/L.
Procollagen type I N terminal propetide (P1NP) is measured by a double antibody radioimmunoassay (Orion Diagnostica, Espoo, Finland). Intra-assay CVs are 2.3% at 44.5 µg/L and 12.7% at 103 µg/L. Inter-assay CVs are 3.8% at 28.0 µg/L and 9.2% at 165 µg/L.
1,25-Dihydroxyvitamin D3 (1,25(OH)2D3) testing is performed by an immuno-extraction and liquid chromatography-tandem mass spectrometry method. The 1-25-dihydroxyvitamin D3 intra-assay imprecision is 6.9% at levels of 45 and 307 pg/ml (n=20). The 1-25-dihydroxyvitamin D3 inter-assay imprecision is 12% and 7% at 82 and 207 pg/ml respectively (n=20). Linearity and recovery is within 95–105%.
25-Hydroxyvitamin D2 (25(OH)D2) is measured by liquid chromatography-tandem mass spectrometry. Intra-assay CVs are 4.4%, 3.3%, and 4.2% at 14, 41, and 124 ng/mL, respectively. Interassay CVs are 6.1%, 6.2%, and 4.7% at 15, 43, and 128 ng/mL, respectively.
25-Hydroxyvitamin D3 (25(OH)D3) is measured by liquid chromatography-tandem mass spectrometry. Intra-assay CVs are 3.8%, 2.4%, and 4.7% at 25, 54, and 140 ng/mL, respectively. Inter-assay CVs are 6.4%, 6.8%, and 5.0% at 24, 52, and 140 ng/mL, respectively.
25-Hydroxyvitamin D is the sum of 25(OH)D2 and 25(OH)D3.
Parathyroid hormone (PTH) is measured using a two-site chemiluminescent immunometric assay on Roche Cobas (Roche Diagnostics, Indianapolis, IN). Intra-assay CV’s are 5.3%, 2.2%, 2.3% at 18, 199.6 and 614.25 pg/mL, respectively.
Tartrate-resistant acid phosphatase 5b (TRAP 5b) is measured in serum by the BoneTRAP® immunoassay (Immunodiagnostic Systems PLC, Boldon, UK). Intra-assay CVs are 6.0% and 6.6% at 3.0 and 7.1 U/L, respectively. Inter-assay CVs are 5.8% and 7.2% at 3.3 and 16.1 U/L, respectively.
Fibroblast Growth Factor 23 (FGF23) is measured in serum by the fibroblast growth factor 23 ELISA Kit (Kainos Laboratories, Inc., Tokyo, Japan). Intra-assay CVs are 9.7% and 5.3% at 23 and 550 ng/L, respectively. Inter-assay CVs are 14.0% and 7.0% at 17 and 672 ng/L, respectively.
STATISTICAL ANALYSIS
Differences between donors and controls at baseline were assessed by chi-square (categorical data) and t-tests (parametric data). Differences between groups and among visits were assessed using analysis of variance with repeated measures (generalized linear mixed-effects models). This analysis assessed the independent effects of donors versus controls, visits at baseline, 6 month and 36 months. Results were considered statistically significant for P<0.05, although consideration should be given to the fact that P-value was not adjusted for multiple comparisons. Variables that were not normally distributed were logarithmically transformed before analysis. Differences in categorical variables between groups and among visits were assessed with Chi-Square. All analyses were carried out with SAS® 9.2 for the personal computer (SAS® Institute Inc., Cary, NC). Data were analyzed by authors BLK and JJS.
Supplementary Material
Acknowledgments
Support: This study was funded by the National Institutes of Health (NIH) under the cooperative agreement U01 DK066013. The NIH participated in the interpretation of data, writing the report, and the decision to submit the report for publication. The opinions expressed herein do not reflect those of the National Institutes of Diabetes, Digestive and Kidney Disease, the National Institute of Health, The Department of Health and Human Services and the government of the United States.
Footnotes
Publisher's Disclaimer: This is a PDF file of an unedited manuscript that has been accepted for publication. As a service to our customers we are providing this early version of the manuscript. The manuscript will undergo copyediting, typesetting, and review of the resulting proof before it is published in its final citable form. Please note that during the production process errors may be discovered which could affect the content, and all legal disclaimers that apply to the journal pertain.
DISCLOSURES
The authors declare that they have no other relevant financial interests.
Contributions: Research idea and study design: BLK, RSK, TA-H, ESK, AAP, TEP, HR, MWS, JJS, MRW; data acquisition: TA-H, RSK, ESK, AAP, HR, MRW; data analysis/interpretation: BLK, TA-H, AKI, RSK, PLK, ESK, RK, AAP, TEP, HR, MWS, JJS, RJS, MRW; statistical analysis: BLK, JJS. Each author contributed important intellectual content during manuscript drafting or revision and accepts accountability for the overall work by ensuring that questions pertaining to the accuracy or integrity of any portion of the work are appropriately investigated and resolved. BLK takes responsibility that this study has been reported honestly, accurately, and transparently; that no important aspects of the study have been omitted; and that any discrepancies from the study as planned have been explained.
REFERENCES
- 1.Grams ME, Sang Y, Levey AS, et al. Kidney-Failure Risk Projection for the Living Kidney-Donor Candidate. N Engl J Med. 2016;374(5):411–421. doi: 10.1056/NEJMoa1510491. [DOI] [PMC free article] [PubMed] [Google Scholar]
- 2.Steiner RW. The Risks of Living Kidney Donation. N Engl J Med. 2016;374(5):479–480. doi: 10.1056/NEJMe1513891. [DOI] [PubMed] [Google Scholar]
- 3.Kidney Disease: Improving Global Outcomes (KDIGO) KDIGO 2012 Clinical Practice Guideline for the Evaluation and Management of Chronic Kidney Disease. Kidney Int - Supplement. 2013;3(1):S1–S150. doi: 10.1038/ki.2013.243. [DOI] [PubMed] [Google Scholar]
- 4.Barri YM, Parker T, III, Daoud Y, Glassock RJ. Definition of chronic kidney disease after uninephrectomy in living donors: what are the implications? Transplantation. 2010;90(5):575–580. doi: 10.1097/TP.0b013e3181e64237. [DOI] [PubMed] [Google Scholar]
- 5.Kidney Disease: Improving Global Outcomes (KDIGO) CKD-MBD Work Group. KDIGO clincal practice guideline for the diagnosis, evaluation, prevention, and treatment of chronic kidney disase-mineral and bone disorder (CKD-MBD) Kidney Int Suppl. 2009;76(Suppl 113):S1–S130. doi: 10.1038/ki.2009.188. [DOI] [PubMed] [Google Scholar]
- 6.Pabico RC, McKenna BA, Freeman RB. Renal function before and after unilateral nephrectomy in renal donors. Kidney Int. 1975;8(3):166–175. doi: 10.1038/ki.1975.96. [DOI] [PubMed] [Google Scholar]
- 7.Friedlander MA, Lemke JH, Horst RL. The effect of uninephrectomy on mineral metabolism in normal human kidney donors. Am J Kidney Dis. 1988;11(5):393–401. doi: 10.1016/s0272-6386(88)80052-0. [DOI] [PubMed] [Google Scholar]
- 8.Gossmann J, Wilhelm A, Kachel HG, et al. Long-term consequences of live kidney donation follow-up in 93% of living kidney donors in a single transplant center. Am J Transplant. 2005;5(10):2417–2424. doi: 10.1111/j.1600-6143.2005.01037.x. [DOI] [PubMed] [Google Scholar]
- 9.Bieniasz M, Kwiatkowski A, Domagala P, et al. Serum concentration of vitamin D and parathyroid hormone after living kidney donation. Transplant Proc. 2009;41(8):3067–3068. doi: 10.1016/j.transproceed.2009.09.039. [DOI] [PubMed] [Google Scholar]
- 10.Westerberg PA, Ljunggren O, Larsson TE, Wadstrom J, Linde T. Fibroblast growth factor-23 and mineral metabolism after unilateral nephrectomy. Nephrol Dial Transplant. 2010;25(12):4068–4071. doi: 10.1093/ndt/gfq288. [DOI] [PubMed] [Google Scholar]
- 11.Young A, Hodsman AB, Boudville N, et al. Bone and mineral metabolism and fibroblast growth factor 23 levels after kidney donation. Am J Kidney Dis. 2012;59(6):761–769. doi: 10.1053/j.ajkd.2011.09.019. [DOI] [PubMed] [Google Scholar]
- 12.Huan Y, Kapoor S, Deloach S, Ommen E, Meyers K, Townsend RR. Changes in biomarkers associated with living kidney donation. Am J Nephrol. 2013;38(3):212–217. doi: 10.1159/000354312. [DOI] [PMC free article] [PubMed] [Google Scholar]
- 13.Ponte B, Trombetti A, Hadaya K, et al. Acute and long term mineral metabolism adaptation in living kidney donors: a prospective study. Bone. 2014;62:36–42. doi: 10.1016/j.bone.2014.01.020. [DOI] [PubMed] [Google Scholar]
- 14.Moody WE, Ferro CJ, Edwards NC, et al. Cardiovascular Effects of Unilateral Nephrectomy in Living Kidney Donors. Hypertension. 2016;67(2):368–377. doi: 10.1161/HYPERTENSIONAHA.115.06608. [DOI] [PMC free article] [PubMed] [Google Scholar]
- 15.Kasiske BL, Anderson-Haag T, Ibrahim HN, et al. A Prospective Controlled Study of Kidney Donors: Baseline and 6-month Follow-up. Am J Kidney Dis. 2013;62(3):577–586. doi: 10.1053/j.ajkd.2013.01.027. [DOI] [PMC free article] [PubMed] [Google Scholar]
- 16.Kasiske BL, Anderson-Haag T, Israni AK, et al. A Prospective Controlled Study of Living Kidney Donors: Three-Year Follow-up. Am J Kidney Dis. 2015;66(1):114–124. doi: 10.1053/j.ajkd.2015.01.019. [DOI] [PMC free article] [PubMed] [Google Scholar]
- 17.Chase LR, Aurbach GD. Parathyroid function and the renal excretion of 3'5'-adenylic acid. Proc Natl Acad Sci U S A. 1967;58(2):518–525. doi: 10.1073/pnas.58.2.518. [DOI] [PMC free article] [PubMed] [Google Scholar]
- 18.Bowe AE, Finnegan R, Jan de Beur SM, et al. FGF23 inhibits renal tubular phosphate transport and is a PHEX substrate. Biochem Biophys Res Commun. 2001;284(4):977–981. doi: 10.1006/bbrc.2001.5084. [DOI] [PubMed] [Google Scholar]
- 19.Berndt TJ, Craig TA, McCormick DJ, et al. Biological activity of FGF23 fragments. Pflugers Arch. 2007;454(4):615–623. doi: 10.1007/s00424-007-0231-5. [DOI] [PMC free article] [PubMed] [Google Scholar]
- 20.Yuan B, Takaiwa M, Clemens TL, et al. Aberrant Phex function in osteoblasts and osteocytes alone underlies murine X-linked hypophosphatemia. J Clin Invest. 2008;118(2):722–734. doi: 10.1172/JCI32702. [DOI] [PMC free article] [PubMed] [Google Scholar]
- 21.Sommer S, Berndt T, Craig T, Kumar R. The phosphatonins and the regulation of phosphate transport and vitamin D metabolism. J Steroid Biochem Mol Biol. 2007;103(3–5):497–503. doi: 10.1016/j.jsbmb.2006.11.010. [DOI] [PubMed] [Google Scholar]
- 22.Martin A, David V, Quarles LD. Regulation and function of the FGF23/klotho endocrine pathways. Physiol Rev. 2012;92(1):131–155. doi: 10.1152/physrev.00002.2011. [DOI] [PMC free article] [PubMed] [Google Scholar]
- 23.van Ballegooijen AJ, Rhee EP, Elmariah S, de Boer IH, Kestenbaum B. Renal Clearance of Mineral Metabolism Biomarkers. J Am Soc Nephrol. 2016;27(2):392–397. doi: 10.1681/ASN.2014121253. [DOI] [PMC free article] [PubMed] [Google Scholar]
- 24.Farrugia W, Yates NA, Fortune CL, McDougall JG, Scoggins BA, Wark JD. The effect of uninephrectomy on osteocalcin metabolism in sheep: a direct evaluation of renal osteocalcin clearance. J Endocrinol. 1991;130(2):213–221. doi: 10.1677/joe.0.1300213. [DOI] [PubMed] [Google Scholar]
- 25.Burch J, Rice S, Yang H, et al. Systematic review of the use of bone turnover markers for monitoring the response to osteoporosis treatment: the secondary prevention of fractures, and primary prevention of fractures in high-risk groups. Health Technol Assess. 2014;18(11):1–180. doi: 10.3310/hta18110. [DOI] [PMC free article] [PubMed] [Google Scholar]
- 26.Garg AX, Pouget J, Young A, et al. Fracture risk in living kidney donors: a matched cohort study. Am J Kidney Dis. 2012;59(6):770–776. doi: 10.1053/j.ajkd.2012.01.013. [DOI] [PubMed] [Google Scholar]
- 27.van Ballegooijen AJ, Reinders I, Visser M, Brouwer IA. Parathyroid hormone and cardiovascular disease events: A systematic review and meta-analysis of prospective studies. Am Heart J. 2013;165(5):655–664. 664. doi: 10.1016/j.ahj.2013.02.014. [DOI] [PubMed] [Google Scholar]
- 28.Arnlov J, Carlsson AC, Sundstrom J, et al. Higher fibroblast growth factor-23 increases the risk of all-cause and cardiovascular mortality in the community. Kidney Int. 2012;83(1):160–166. doi: 10.1038/ki.2012.327. [DOI] [PubMed] [Google Scholar]
- 29.Kendrick J, Cheung AK, Kaufman JS, et al. FGF23 associates with death, cardiovascular events, and initiation of chronic dialysis. J Am Soc Nephrol. 2011;22(10):1913–1922. doi: 10.1681/ASN.2010121224. [DOI] [PMC free article] [PubMed] [Google Scholar]
- 30.Scialla JJ, Xie H, Rahman M, et al. Fibroblast growth factor-23 and cardiovascular events in CKD. J Am Soc Nephrol. 2014;25(2):349–360. doi: 10.1681/ASN.2013050465. [DOI] [PMC free article] [PubMed] [Google Scholar]
- 31.Seiler S, Rogacev KS, Roth HJ, et al. Associations of FGF23 and sKlotho with cardiovascular outcomes among patients with CKD stages 2–4. Clin J Am Soc Nephrol. 2014;9(6):1049–1058. doi: 10.2215/CJN.07870713. [DOI] [PMC free article] [PubMed] [Google Scholar]
- 32.Garg AX, Meirambayeva A, Huang A, et al. Cardiovascular disease in kidney donors: matched cohort study. BMJ. 2012;344:e1203. doi: 10.1136/bmj.e1203. [DOI] [PMC free article] [PubMed] [Google Scholar]
- 33.Mjoen G, Hallan S, Hartmann A, et al. Long-term risks for kidney donors. Kidney Int. 2013;86:162–167. doi: 10.1038/ki.2013.460. [DOI] [PubMed] [Google Scholar]
Associated Data
This section collects any data citations, data availability statements, or supplementary materials included in this article.


