Abstract
Hemolytic uremic syndrome caused by Shiga toxin-producing Escherichia coli (STEC HUS) is a worldwide endemic problem and its pathophysiology is not fully elucidated. Here we tested whether the mannose-binding lectin (MBL2), an initiating factor of lectin complement pathway activation, plays a crucial role in STEC HUS. Using novel human MBL2 expressing mice (MBL2 KI) that lack murine Mbls (MBL2+/+Mbl1−/−Mbl2−/−), a novel STEC HUS model consisted of an intraperitoneal injection with Shiga toxin-2 (Stx-2) with or without anti-MBL2 antibody (3F8, intraperitoneal). Stx-2 induced weight loss, anemia, thrombocytopenia, and increased serum creatinine, free serum hemoglobin, and cystatin C levels, but a significantly decreased glomerular filtration rate all compared to control/sham mice. Immunohistochemical staining revealed renal C3d deposition and fibrin deposition in glomeruli in Stx-2 injected mice. Treatment with 3F8 completely inhibited serum MBL2 levels, and significantly attenuated Stx-2 induced renal injury, free serum hemoglobin levels, renal C3d and fibrin deposition, and preserved the glomerular filtration rate. Thus, MBL2 inhibition significantly protected against complement activation and renal injury induced by Stx-2. This novel mouse model can be used to study the role of complement, particularly lectin pathway-mediated complement activation, in Stx-2 induced renal injury.
Keywords: fibrin, complement activation, lectin pathway, antibody, deposition
Graphical Abstract
Introduction
Hemolytic uremic syndrome (HUS) is a disease characterized by renal failure, thrombocytopenia, and hemolytic anemia 1. HUS is divided into two major classes by its etiologies- Shiga toxin-producing Escherichia coli HUS (STEC HUS) and atypical HUS (aHUS). An AB5 toxin produced by bacteria, Shiga toxin (Stx), has been identified as the causative factor of STEC HUS 2. A major source of Stx is ingestion of food contaminated with Stx-producing Escherichia coli or Shigella dysenteriae 3. Currently there is no proven therapeutic option for STEC HUS other than supportive care 4. Supportive therapy with dialysis in the acute phase of STEC HUS can be life-saving; however, chronic renal failure and hypertension develop in many patients 5,6. Establishment of definitive therapy to treat STEC HUS is needed to decrease mortality and morbidity.
Stx is a member of the ribosome-inactivating proteins (RIPs) and is classified into two main forms; Stx-1 and Stx-2 7. Stx-2 is associated with severe human disease 8. The B subunits of Stx bind to a glycosphingolipid receptor, globotriaosyl ceramide (Gb3), which is expressed on the plasma membrane, and the receptor-bound Stx is then internalized to the cytosol. Gb3 is highly expressed on human renal endothelial cells, and cellular injury may occur following Stx exposure 9. Stx is then transported to the ribosome where the A subunit cleaves an adenosine at position 4324 from the 5' terminal of the 28 S ribosome and leads to protein synthesis inhibition and cell injury 10. In a small number of instances, protein synthesis may be enhanced (e.g., tissue factor) 11,12. Although these intracellular mechanisms have been elucidated, the mechanisms by which ribosomal inactivation induces the peculiar characteristics of STEC HUS are unknown 13.
Involvement of the complement system has been suggested as a possible mechanism in the development of STEC HUS 14. Low C3 plasma levels in STEC HUS patients have been reported 15,16. Other changes in the complement system include increased levels of breakdown products of the two components of the alternative pathway C3 convertase, C3 (C3b, C3c, C3d), factor B (Ba and Bb), as well as sC5b-9 17-19. These findings imply that inhibiting the complement system may attenuate the cell injury and lead to resolution of renal insufficiency. In children with severe neurological STEC HUS, anti-C5 antibody eculizumab/Soliris™ was shown to be clinically effective 20. In contrast, other studies have questioned the effectiveness of Soliris™ in the treatment of STEC HUS 21,22. However, the role of the lectin complement pathway in STEC HUS is unknown. We hypothesized that mannose-binding lectin 2 (MBL2) of the lectin pathway plays a role in the pathogenesis of STEC HUS.
MBL2 is an initiating factor of the lectin complement pathway and recognizes pathogens and altered-self cells, resulting in induction of an inflammatory response and thrombogenesis. Upon MBL2 binding to its target, serine proteases called MBL/ficolin-associated serine proteases (MASP-1, MASP-2, MASP-3) activate C4 and C2 leading to formation of the C3 and C5 convertases and ultimately to formation of the membrane attack complex (e.g., C5b-9). MASPs are also involved in cleavage of prothrombin to thrombin, cleavage of fibrinogen to fibrin, activation of factor XIII 23,24. MBL2 and MASPs are involved in the activation of multiple biological pathways involved in thrombotic diseases 25. We have shown that MBL2 is associated with endothelial injury during sterile injury such as ischemia/reperfusion injury and thrombogenesis 26.
To investigate the role of MBL2 further in clinically relevant settings, we recently described a mouse model in which human MBL2 is knocked-in with the absence of murine Mbls (MBL2+/+Mbl1−/−Mbl2−/−; MBL2 KI mouse) and also used a functionally inhibiting monoclonal antibody (mAb) against MBL2, clone 3F8 27-29 to inhibit MBL2 function. To mimic STEC HUS we modeled Stx-induced renal injury using the MBL2 KI mouse and purified Stx-2. In the present study we examined the role of MBL2 in the pathogenesis of STEC HUS and explored the effectiveness of 3F8 in this mouse model.
Results
Determination of Doses of Stx-2 and 3F8
We determined the toxicity of Stx-2 in MBL2 KI mice. Dose-response experiments determined that the 50% lethal dose was 625 pg/g. Administration of Stx-2 (625 pg/g) resulted in rapidly progressive weight loss; mice were moribund 3 days later and displayed convulsions and ataxia, indicating impairment of the nervous system. In order to reproduce more clinically relevant STEC HUS in MBL2 KI mice without death, the Stx-2 dose was reduced to 125 pg/g. We used weight loss as an indicator of toxicity instead of death in these pilot stuides, since weight loss in rodent STEC HUS models correlates with illness 30-32. With a dose of Stx-2 (125 pg/g), MBL2 KI mice developed various degrees of weight loss but none exhibited neurological deficits by day 4. This sub-lethal dose of Stx-2 (125 pg/g) was used in all experimental studies. For sham/controls, mice were injected with either PBS or toxoid (e.g., a mutated form of Stx-2 that is produced and purified in the same manner as Stx-2) 33,34.
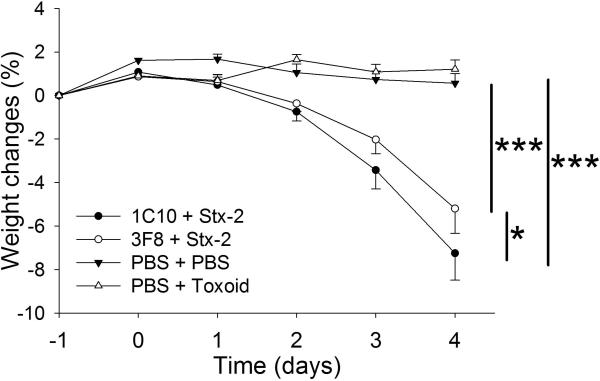
Mice were weighed every 24 hours from day −1 to day 4 (Figure 1). The MBL2 KI mice receiving Stx-2 and an isotype control monoclonal antibody (clone 1C10) began to lose body weight by day 2. On day 4, these mice lost an average of 11% of their baseline body weight. To control for any contaminating lipopolysaccharide or blood volume changes, we injected mice with toxoid or PBS 33,34. Similar to PBS, toxoid injected mice had no weight loss over the four day observation period. MBL2 KI mice treated with 3F8 and receiving Stx-2 had significantly less weight loss at day 4 compared to the 1C10 + Stx-2 group.
Figure 1. Time course of weight changes.
Baseline weight measurements were obtained at Day −1 followed by injections at Day 0.5 and Day 0 for the following groups: 1C10 + Stx-2 (n=5), 3F8 + Stx-2 (n=30), PBS + PBS (n=7), and PBS + toxoid (n=5). *p<0.05; ***p<0.001
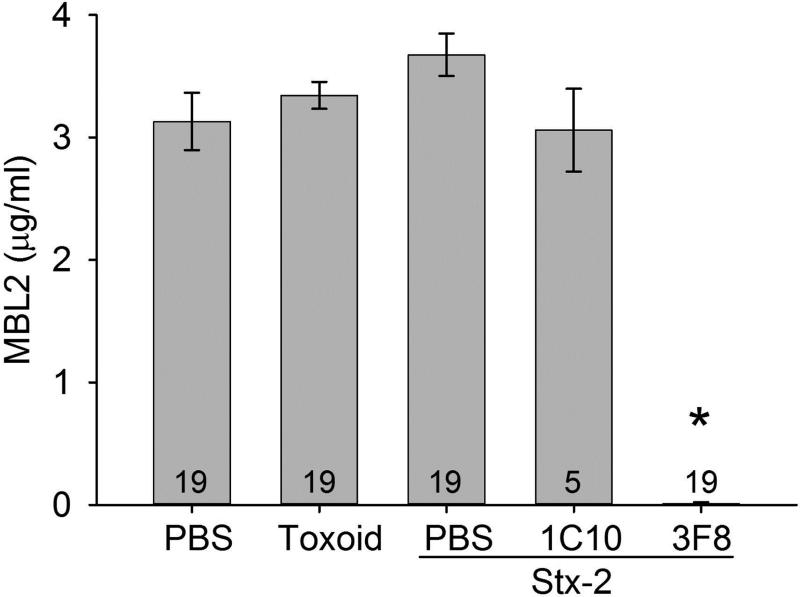
Functional serum MBL2 levels were evaluated in mice receiving PBS or toxoid and mice receiving Stx-2 and treated with either PBS, 1C10 or 3F8 (Figure 2). All groups had similar levels of circulating MBL2 (e.g., ~3 μg/ml sera), which was significantly inhibited in mice receiving 3F8.
Figure 2. Serum MBL2 concentrations in MBL2 KI mice on Day 4.
MBL2 concentrations remained at baseline levels after four Days in all groups, except those treated with anti-MBL2 mAb, 3F8, which completely inhibited circulating MBL2 levels. Data are shown as mean ± SEM. Numbers within the bars represent the number of animals studied. *p<0.001 comparing 3F8 + Stx-2 group to all other groups
Stx-2 Induced Renal Injury, Anemia and Thrombocytopenia in MBL2 KI Mice and 3F8 Ameliorated Renal Injury
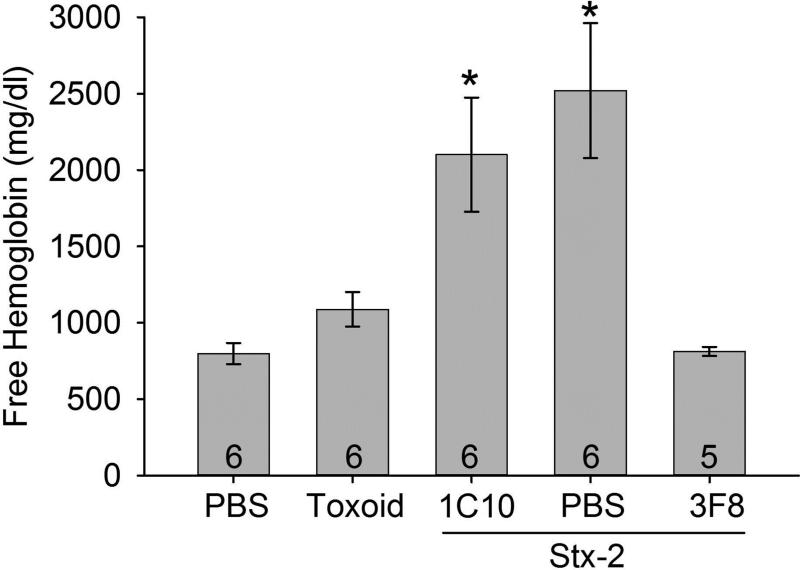
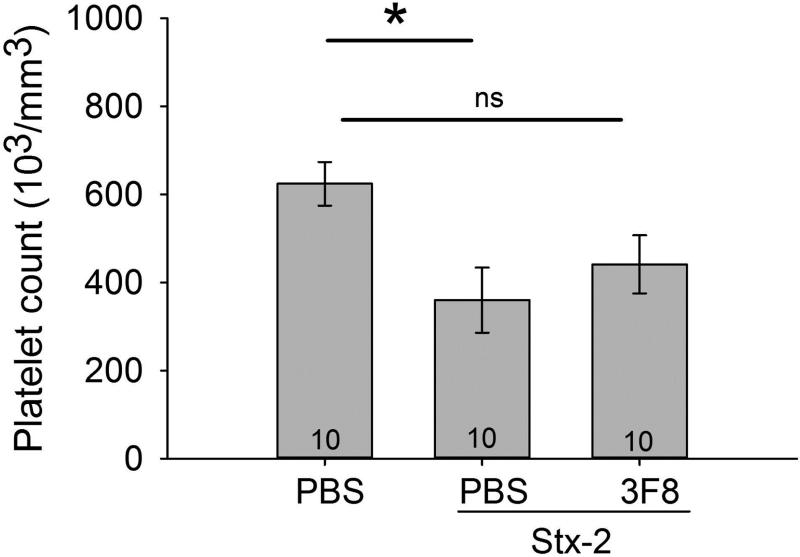
The main characteristics of STEC HUS are anemia, thrombocytopenia and renal injury. We observed a small but significant decrease in RBC count from 11±1 to 8±1 (106 cells/mm3) following Stx-2 administration compared to control. In order to better evaluate Stx-2 induced lysis of RBCs, we investigated free serum hemoglobin (Hgb) as an index of anemia. We observed an increase in free Hgb in mice treated with PBS or 1C10 and also receiving Stx-2 compared to control mice receiving only PBS or toxoid (Figure 3). Mice treated with 3F8 had significantly lower free Hgb levels and these levels were not different from the control mice (e.g., mice receiving only PBS or toxoid). We also observed a significant decrease in platelet counts induced by Stx-2 compared to mice receiving only PBS (Figure 4; NOTE: since toxoid did not affect other parameters, the toxoid group was discontinued in the remaining studies). While the platelet counts in the 3F8 + Stx-2 group were not significantly different from those in either the PBS only group or the Stx-2 group, there was a trend for platelet counts with 3F8 + Stx-2 to be higher than those in the PBS + Stx-2 group, a trend which might have reached statistical significance with a higher N. These data demonstrate Stx-2 induced anemia and thrombocytopenia in this novel mouse line with anemia blocked by anti-MBL2 treatment.
Figure 3. Free serum hemoglobin (Hgb) on day 4.
As an index of hemolysis, serum hemoglobin was studied in the groups. Treatment with PBS or 1C10 followed by Stx-2 injection resulted in a significant increase in free Hgb compared to mice injected with only PBS + PBS or toxoid or treated with 3F8 then injected with Stx-2. Thus, MBL2 inhibition significantly prevented hemolysis. Bars and brackets represent mean ± SEM and numbers in the bars represent number of mice studied. *p<0.05 compared to PBS, toxoid or 3F8 + Stx-2.
Figure 4. Platelet count.
Plasma blood samples were analyzed for platelet counts on Day 4. Mice treated with PBS + PBS had significantly higher platelet counts compared to PBS + Stx-2. Treatment with 3F8 + Stx-3 did not significantly alter platelet counts compared to PBS + PBS group, but were also not different from the PBS + Stx-2 group. Bars and brackets represent mean ± SEM and numbers in the bars represent number of mice studied. *p<0.05; ns= not significant
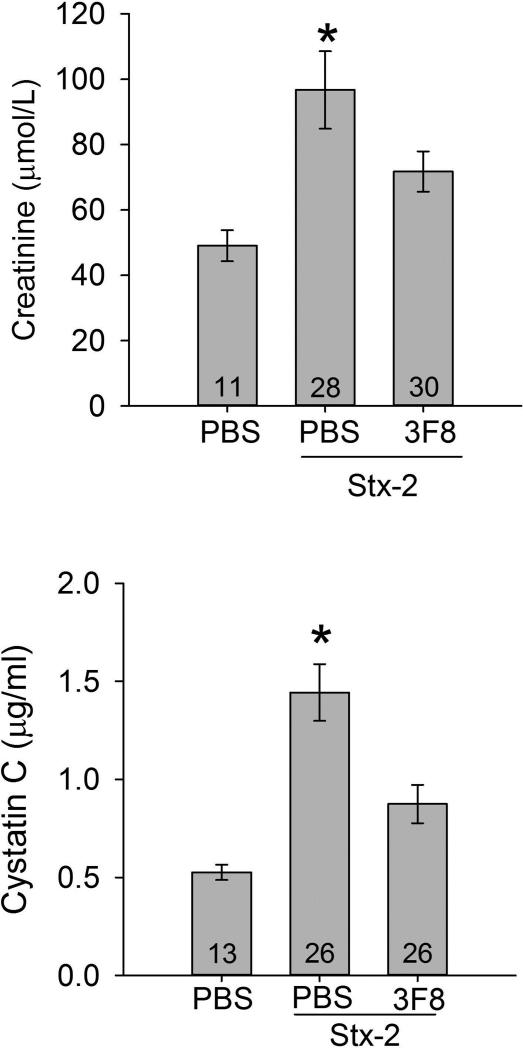
Serum samples were also analyzed for two representative markers of renal injury (Creatinine; Cr and Cystatin C; CysC) (Figure 5). Four days after administration of Stx-2, serum Cr was increased significantly compared to the PBS only group (Figure 5, top panel). Serum Cr in the 3F8 + Stx-2 group was significantly lower compared to the group receiving PBS + Stx-2. Similar to the Cr data, serum CysC (Figure 5, bottom panel) was increased in response to Stx-2 compared to the Control group (PBS only). Serum CysC levels were significantly lower in the 3F8 + Stx-2 group compared to the PBS + Stx-2 group.
Figure 5. Serum creatinine and cystatin C levels.
Renal injury was assessed by serum creatinine and serum cystatin C. The upper and lower panels summarize serum creatinine and cystatin C levels on day 4, respectively. Creatinine levels significantly increased in PBS treated mice and injected with Stx-2 compared to the control mice injected with PBS only. Treatment with 3F8 resulted in significantly lower creatinine levels compared to PBS + Stx-2 mice and was not significantly different from the PBS only mice. Similarly results were observed with cystatin C levels (lower panel). Bars and brackets represent mean ± SEM. Numbers in the bars represent the number of mice studied. *p<0.05 compared to the other groups.
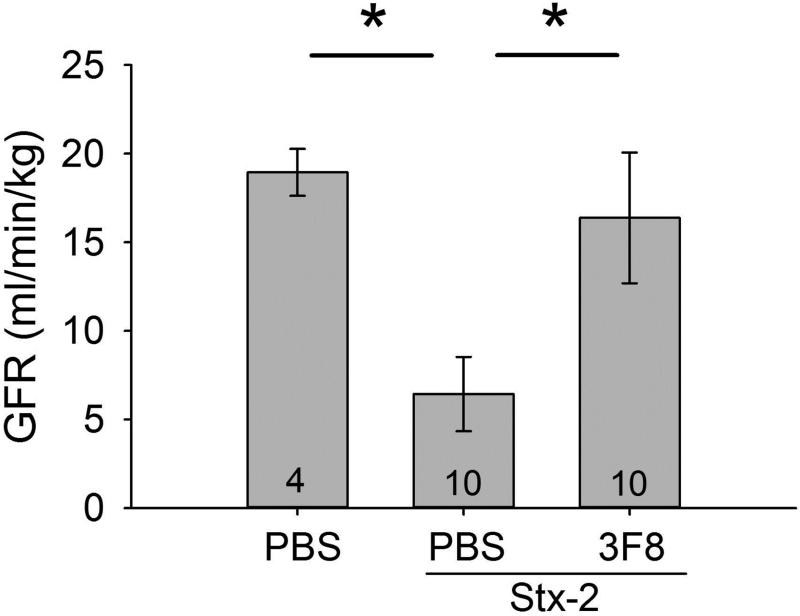
To evaluate renal function, we determined glomerular filtration rate (GFR). GFR was significantly decreased in the PBS + Stx-2 group compared to the PBS only group (Figure 6). GFR in the 3F8 + Stx-2 group was significantly higher compared to the PBS + Stx-2 group and not significantly different from the PBS only group.
Figure 6. Assessment of renal function in STEC HUS model with and without 3F8.
Glomerular filtration rate (GFR) was determined as serum inulin clearance. GFR was significantly decreased in the PBS + Stx-2 group compared to the PBS only group and also to the 3F8 treated group. Bars and brackets represent mean ± SEM and numbers in the bars represent number of mice studied. *p<0.05
In summary, Stx-2 induced three characteristics of STEC HUS; renal failure, anemia, and thrombocytopenia in MBL2 KI mice. In this Stx-2 model, functional inhibition of MBL2 with mAb 3F8 prevented renal failure and anemia, with marginal affects on thrombocytopenia. Renal function (e.g., GFR) was significantly protected from Stx-2 induced injury by MBL2 inhibition.
Complement activation and deposition
Local synthesis of complement protein C3 from renal epithelial cells is an important mediator for local tissue injury in renal disease 35. We examined renal C3d deposition as an index of complement activation by all complement pathways. As others have demonstrated 35,36, we observed local C3d in renal sections from mice given only PBS (Figure 7A; n=3). Mice (n=3) injected with PBS + Stx-2 (panel B) had significantly (p=0.001) greater renal C3d deposition compared to control mice (panel A; (47 ± 6% increase). The 3F8 + Stx-2 group (n=2; panel C) demonstrated C3d deposition that was not different from control mice (panel A) and significantly less than PBS + Stx-2 (p=0.004; panel B). These data demonstrate that MBL2 and the lectin complement pathway are responsible for complement activation and C3d deposition following Stx-2 administration.
Figure 7. C3d deposition.
C3 activation and deposition in the study was evaluated as C3d immunohistochemical staining. Representative staining of images taken from a single experiment is shown. Normal C3 staining is observed in the kidney and is observed in the PBS only group, panel A, which increases after injection of Stx-2, panel B. Anti-MBL2 (3F8) treatment significantly reduced C3d deposition (panel C), thus demonstrating MBL2 dependent activation of the lectin complement pathway in this model.
Glomerular fibrin deposition
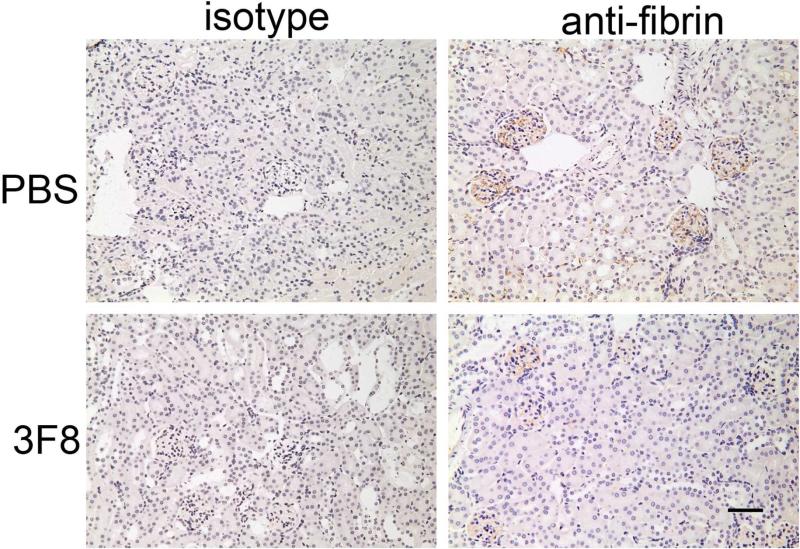
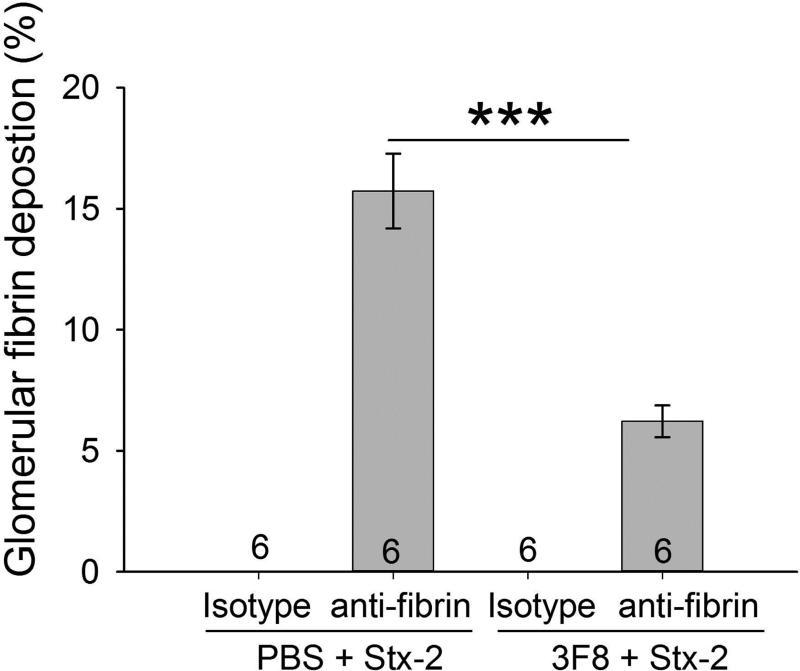
Immunohistochemical staining for fibrin demonstrated fibrin deposition in the glomeruli of PBS + Stx-2 mice (Figure 8A). There was significantly less fibrin deposition in the glomeruli in the 3F8 + Stx-2 group (Figure 8A and 8B). These data demonstrate the important role of the MBL2 complex in glomeruli fibrin deposition following Stx-2 administration.
Figure 8. Immunohistochemical analysis of renal fibrin deposition.
Representative kidney sections stained for fibrin or porcine C5a (isotype control) are shown in Panel A. No obvious thrombi were observed in the glomeruli. Fibrin deposition was clearly observed in glomeruli. Quantitative area of fibrin deposition (Panel B; described in Methods) in the glomeruli are shown as bars and brackets representing mean ± SEM. Numbers in the bars represent number of mice studied. ***p<0.001. Scale bar = 50μm
Discussion
We developed a murine model with three characteristics of STEC HUS (renal injury, anemia, and thrombocytopenia) using MBL2 KI mice injected with Stx-2. We found that the anti-MBL2 mAb, 3F8, attenuated complement C3d deposition and the renal injury induced by Stx-2. Although involvement of complement activation, particularly the classical and alternative pathways, has been suggested in STEC HUS, the mechanisms by which this occurs have not been fully elucidated 15,18,37-39. The lectin pathway has not been investigated in STEC HUS because of the lack of specific inhibitors to murine Mbl1 and Mbl2. The present studies demonstrate that MBL2, an initiating factor of the lectin pathway, is involved in the pathogenesis in this murine STEC HUS model and may be the rate-limiting pathway for complement activation in STEC HUS.
Studying the role of mannose-binding lectin in mouse models of human disease has been limited, as wild-type mice have two active forms of MBL (e.g., Mbl1 and Mbl2) and inhibitors of these two functional Mbls are not available. In order to overcome these limitations, we generated a humanized MBL2 expressing mouse (MBL2+/+ Mbl1−/− Mbl2−/− ; MBL2 KI) within the Mbl1 locus 29. These mice produce functional MBL2, no mouse Mbl1 or Mbl2, and mAb 3F8 completely inhibits MBL2 function in vivo 29. Using these mice it is now possible to study the role of the MBL/lectin complement pathway in the pathogenesis of STEC HUS.
We evaluated renal injury in our model by measuring glomerular filtration rate. Stx-2 induced a decrease in GFR, and 3F8 was protective against the Stx-2 induced filtration dysfunction. These observations indicate that MBL2 mediates renal injury in this STEC HUS model. Because of the absence of Gb3 on murine glomerular endothelial cells, it has generally been said that microthrombosis in the glomeruli cannot be reproduced in a mouse model of STEC HUS 40. Consistent with this conventional theory, microthrombi were not found in the glomeruli of our STEC HUS model. However, we observed glomerular injury indicated by fibrin deposits and decreased GFR in this model. The fibrin deposits were not accompanied with light microscopic thrombi as is typical in the thrombotic microangiopathy in humans. A similar finding was reported in the glomeruli of another mouse STEC HUS model 31. Fibrin depositions were significantly decreased in the glomeruli of mice treated with the anti-MBL2 mAb 3F8. This effect of 3F8 is similar to our previous report in which 3F8 inhibited fibrin deposition following reperfusion of the ischemic myocardium 29. These data suggest that the MBL/MASPs complex directly activated the coagulation cascade in this model. A recent study demonstrating the affinity of Stx-2 to glycolipids and glycans suggests the possibility that other cellular components contribute to Stx-2 potency and supports our findings that glomerular injury developed without Gb3 expression 41. Further, Stx is transferred within microvesicles in a Gb3 receptor-independent manner 42,43. Based on these past observations, we believe that Stx-2 induces glomerular injury in our model even in the absence of Gb3. Moreover, MBL2 can independently induce tubular epithelial cell death without complement activation 44. Our findings further support an important role for MBL2 mediated renal injury and extends these findings to include glomerular injury in a murine STEC HUS model.
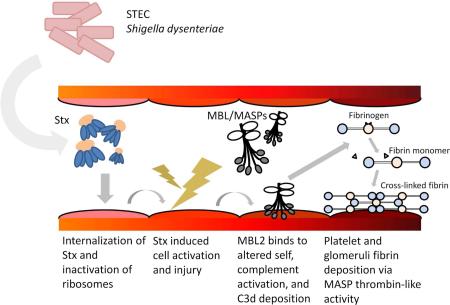
Published findings and observations in the current study led us to propose the following mechanism of MBL2 mediated renal injury in this STEC HUS model (Figure 9). Stx produced by STEC or Shigella dysenteriae enters the blood stream and is internalized in endothelial cells 42,43,45. Stx is transported to the ribosome and inhibits protein synthesis and induces cellular activation and injury 10. Induction of oxidative stress by Stx-2 is one mechanism of cell injury in STEC HUS 46. We have published that reactive oxygen species induce MBL2 ligands on endothelial cells 27,28. MBL2 then binds to injured endothelial cells and/or exposed tubular epithelial cells and MASPs trigger complement activation and C3d deposition. Lectin pathway activation can then lead to amplification of the alternative pathway 47 via direct activation of factors B and D by MASPs 48. MBL2 inhibition with 3F8 would suppress activation of the alternative complement pathway and even downstream activation of the terminal complement complex formation in this STEC HUS model. Along these lines, a role for the alternative complement pathway in STEC HUS has been proposed 9,39. Furthermore, terminal complement components (e.g., C5a and C5b-9) increase tissue factor expression in endothelial cells 49. Besides complement activation, the MBL/MASPs complex plays a role in coagulation activation via several mechanisms including the cleavage of fibrinogen to fibrin 11,12,50,51. These series of events may result in glomerular dysfunction and renal tubular injury in STEC HUS.
Figure 9. Proposed roles of MBL2 in pathogenesis of STEC HUS.
Stx induces cellular activation and injury to endothelium resulting in the expression of MBL2 ligand and recognized by MBL2. MBL2 binds, activates the lectin complement pathway and results in C3d deposition. MBL2 complex, which has thrombin-like activity, cleaves fibrinogen to fibrin, leading to cross-linked fibrin formation. Stx, Shiga toxin; MBL, mannose binding lectin 2; MASPs, MBL/ficolin-associated serine proteases.
Several studies have suggested that low MBL2 levels may predispose patients to increased risk for infection 52-54. MBL2 deficiency is a common immunodeficiency with ~10% of the population known to be either deficient or functionally deficient in MBL2 55. In this regard, low MBL2 levels are not associated with increased risk of infection by STEC 56. However, results from the present study suggest that MBL2 sufficient patients admitted with STEC HUS may be more at risk for renal injury. Thus, it is possible that HUS patients with MBL2 deficiency may have a more favorable outcome and less renal injury. These data extend findings of other studies demonstrating that MBL2 levels are associated with other renal diseases/injuries 57,58. Thus, MBL2 inhibition may also result in decreased renal injury associated with STEC HUS.
In conclusion, we developed a mouse model of STEC HUS using humanized MBL2 expressing mice. With this novel model, we demonstrated a protective effect of a mAb against MBL2 on renal function in STEC HUS. Results from this study provide new implications for pathogenesis and treatment of STEC HUS. This novel STEC HUS model can be used to study the role of complement, particularly the MBL2/lectin pathway.
Materials and Methods
Animals
All procedures were reviewed and conducted according to the institute's Animal Care and Use Committee. All experiments were performed under the standards and principles set forth in the Guide for Care and Use of Laboratory Animals 59.
Mouse Expressing MBL2
Humanized mice that produce human MBL2 were raised on a C57BL/6 background. The MBL2+/+ Mbl1−/− Mbl2−/− (MBL2 KI) mouse line was created and published previously 29.
Male mice (8 - 10 weeks; 20 - 24 g) were used. Mice were housed under a 12-hour light-dark cycle and fed a standard diet ad libitum. Mice were assigned to several groups and the number of experimental mice used per group is listed in each Figure and/or the Figure Legend. Mice in the Sham/Control group were injected intraperitoneally with PBS (200 μl) and twelve hours later injected intraperitoneally again with PBS or toxoid (125 pg/g). The toxoid is a mutant form of Stx-2 produced in the same cells and purified exactly as Stx-2, thus controlling for any contaminating components 33,34. Endotoxin measured in Stx-2 and toxoid was less than 167 pg LPS/μg (Pierce LAL Chromogenic Endotoxin Quantitation Kit, Thermo Fisher Scientific, Rockford, IL). Mice in the Stx-2 groups were treated intraperitoneally with 200 μl of PBS,1C10 mAb (30 μg/g in PBS) or 3F8 mAb (30 μg/g in PBS) and twelve hours later injected intraperitoneally with Stx-2 (125 pg/g). The time of Stx2 injection was designated as Day 0. Mice were weighed every 24 hours thereafter. Before experimental procedures, mice were anesthetized with isoflurane.
The mouse monoclonal anti-human MBL2 antibodies (3F8 and 1C10) have been previously described 27,28,60. Clone 1C10 is an isotype control mAb that binds to MBL2 but does not inhibit MBL2 function. Previous studies from our laboratory have demonstrated in vivo and in vitro that 1C10 mAb is not functionally different from its vehicle, PBS 27. Stx-2 and toxoid were purchased from Phoenix Laboratory (Tufts Medical Center, Boston, MA, USA).
Mice were anesthetized with isoflurane and exsanguinated via cardiac puncture at the end of the four day observation period. The whole blood samples were allowed to clot for 2 hours at room temperature then placed at 4°C overnight. The following day, the clotted samples were centrifuged at 3000 × g for 10 min; the serum collected and stored at −80°C for future use. Samples for performance of RBC and platelet counts were collected into heparinized syringes.
Measurement of Serum MBL2 Activity
Functional MBL2 was measured as previously described 29,61. Briefly, mouse serum [diluted with veronal-buffered saline with Ca++ and Mg++ (VBS++)] was added to mannan coated 384-well microplates and incubated at 37°C for 30 m in. The plates were washed and incubated with IRDye® 800 labeled anti-MBL 2A9 antibody (1:500; Rockland Immunochemicals, Gilbertsville, PA, USA). After washing, MBL2 deposition was quantified with an Odyssey system (LiCor CLX, Lincoln, NE, USA).
Biochemical Characterization
Creatinine (Cr; Cayman, Ann Arbor, MI, USA), Cystatin C (CysC; R&D Systems, Minneapolis, MN, USA), and hemoglobin (Hgb; Sigma-Aldrich, St. Louis, MO, USA) were measured with commercially available kits.
Cell Counting
Red blood cell and platelet counts were measured with the Cellometer Auto M10 (Nexcelom Biosciences, Lawrence, MA, USA).
Determination of Glomerular Filtration Rate
Glomerular filtration rate (GFR) was determined by single-injection serum inulin clearance62. Inulin (50 mg/kg) was injected intravenously, followed by serial blood sampling at 30, 60, and 90 minutes. Inulin in serum was quantified with an ELISA using a FIT-GFR kit for Inulin (BioPAL, Worcester, MA). The serum inulin clearance curve was defined as the following single exponential function, according to the results of serum inulin concentration 63. C(t) = B*exp(−βt), where C(t) is the serum concentration of inulin at time t, B is the intercept at t=0 and β is the elimination constant. GFR (mg/min/kg) was calculated with the following equation.
where I is the amount of inulin injected, W is weight of the animal.
Immunohistochemistry
Fresh frozen renal tissue was collected and embedded in Optimal Cutting Temperature compound (OCT) and coded for blinded preparation and analysis. Sections (5 μm) in replicate for each mouse were dried for 15 minutes, washed twice with PBS, blocked with 20% goat serum for 30 minutes and incubated for one hour with rabbit anti-mouse C3d (Dako) or rabbit pre-immune IgG antibodies (ThermoFisher Scientific) at a dilution of 1:3000 in PBS/20% goat serum. The sections were washed thrice for three minutes each with PBS/20% goat serum and then incubated with goat anti-rabbit IgG AlexaFluor 555 (1:5000) for one hour. Sections were washed with PBS/20% goat serum thrice for three minutes each. The slides were covered and fixed with Aqua-Mount (Polysciences, Warrington, PA). Sections were examined using a Nikon Optiphot microscope using a 10x fluorescent objective and digital images recorded using a Photometrics CoolSnap HQ2 camera (4095 grey levels, Roper Scientific, Tucson, AZ), a Lumen 200 PRO light source (Prior), and MetaMorph Premier software (Molecular Devices, Inc.). Digital image analysis quantified C3d antigen as the total number of image pixels whose intensity was above threshold for a given image of 1,447,680 total pixels. Pixel counts of 150,000 to 250,000 pixels correspond to a percent surface area of ~11 to 22%. Replicate sections from an animal in each group were analyzed as follows: four fields of 0.101 mm2 each per renal section were studied, with three animals per group used for analysis.
Kidneys for microscopic evaluation were collected and fixed in 10% neutral buffered formalin (Sigma-Aldrich). Samples were embedded in paraffin and sectioned (3 μm). Tissue sections were deparaffinized using EZ-DeWax TM Solution (Biogenex, Fremont, CA, USA) and rehydrated through xylene and serial dilutions of ethanol to deionized water. For fibrin deposit evaluation, endogenous peroxidases and biotin were blocked with 0.3% H2O2. Endogenous IgG was blocked with goat anti-mouse IgG Fab fragments (MP Biomedicals, Solon, OH, USA; 1:100 in PBS/0.05% Triton X-100). Nonspecific antigen binding sites were blocked with normal goat serum. After blocking, the sections were incubated overnight at 4°C with primary antibody or isotype control antibody (GS1 64, anti-porcine C5a 10 μg/ml) and then for 1 hour at room temperature. Mouse β fibrin was localized with monoclonal antibody 59D8 [gift from Dr. Charles Esmon 65; 1:500 in PBS/0.05% Triton X-100] and goat anti-mouse IgG HRP conjugated (Jackson ImmunoResearch, West Grove, PA, USA; 1:700 in PBS/0.05% Triton X-100 for 30 min). The sections were incubated with 3,3'-diaminobenzidine (DAB) and fibrin deposition was visualized with a microscope (Nikon, Tokyo, Japan) and recorded with a digital CCD camera (Diagnostic Instruments, Sterling Heights, MI, USA). Quantitative area of fibrin deposition in the glomerulus was analyzed using a computer image analysis system as previously published using Image J (NIH, Bethesda, MD, USA) 66-68. Briefly, images of fibrin staining were changed from TIFF to RGB stack. The resulting three stack images were formed into a montage to form the grayscale image. The color threshold was adjusted to highlight the area stained by the anti-fibrin antibody. The percentage of the highlighted area was measured by the Measure command in the Image J software. Six glomeruli per mouse from each group and three mice per group were randomly and blindly selected and analyzed.
Statistical Analysis
All statistical analysis was performed with SigmaPlot 12.5 software (SPSS, Chicago, IL). Data are presented as mean ± SEM. Two-way repeated measures ANOVA and Student-Newman-Keuls test were used to demonstrate differences between the groups over time in Figure 1. One-way ANOVA followed by the Student-Newman-Keuls test was used to demonstrate differences between all groups in Figures 2, 4, 7, and 8; the Dunn's test in Figures 3 and 5 and Holm-Sidak in Figure 6. A p-value < 0.05 was considered statistically significant.
Acknowledgments
We acknowledge the expert technical assistance of Margaret Morrissey during the course of these studies.
Sources of Funding
This work was supported by AI089781 and HL056086.
Footnotes
Publisher's Disclaimer: This is a PDF file of an unedited manuscript that has been accepted for publication. As a service to our customers we are providing this early version of the manuscript. The manuscript will undergo copyediting, typesetting, and review of the resulting proof before it is published in its final citable form. Please note that during the production process errors may be discovered which could affect the content, and all legal disclaimers that apply to the journal pertain.
Disclosures
Dr. Stahl is listed as inventor on a patent for the use of mAb 3F8. The other authors report no conflicts.
References
- 1.Tarr PI, Gordon CA, Chandler WL. Shiga-toxin-producing Escherichia coli and haemolytic uraemic syndrome. Lancet. 2005;365:1073–1086. doi: 10.1016/S0140-6736(05)71144-2. [DOI] [PubMed] [Google Scholar]
- 2.O'Brien AD, LaVeck GD. Purification and characterization of a Shigella dysenteriae 1-like toxin produced by Escherichia coli. Infect Immun. 1983;40:675–683. doi: 10.1128/iai.40.2.675-683.1983. [DOI] [PMC free article] [PubMed] [Google Scholar]
- 3.Butler T. Haemolytic uraemic syndrome during shigellosis. Trans R Soc Trop Med Hyg. 2012;106:395–399. doi: 10.1016/j.trstmh.2012.04.001. [DOI] [PubMed] [Google Scholar]
- 4.Bitzan M. Treatment options for HUS secondary to Escherichia coli O157:H7. Kidney Int Suppl. 2009:S62–S66. doi: 10.1038/ki.2008.624. [DOI] [PubMed] [Google Scholar]
- 5.Spinale JM, Ruebner RL, Copelovitch L, et al. Long-term outcomes of Shiga toxin hemolytic uremic syndrome. Pediatr Nephrol. 2013;28:2097–2105. doi: 10.1007/s00467-012-2383-6. [DOI] [PubMed] [Google Scholar]
- 6.Sharma AP, Filler G, Dwight P, et al. Chronic renal disease is more prevalent in patients with hemolytic uremic syndrome who had a positive history of diarrhea. Kidney Int. 2010;78:598–604. doi: 10.1038/ki.2010.174. [DOI] [PubMed] [Google Scholar]
- 7.Walsh MJ, Dodd JE, Hautbergue GM. Ribosome-inactivating proteins: potent poisons and molecular tools. Virulence. 2013;4:774–784. doi: 10.4161/viru.26399. [DOI] [PMC free article] [PubMed] [Google Scholar]
- 8.Scotland SM, Willshaw GA, Smith HR, et al. Properties of strains of Escherichia coli belonging to serogroup O157 with special reference to production of Vero cytotoxins VT1 and VT2. Epidemiol Infect. 1987;99:613–624. doi: 10.1017/s0950268800066462. [DOI] [PMC free article] [PubMed] [Google Scholar]
- 9.Morigi M, Galbusera M, Gastoldi S, et al. Alternative pathway activation of complement by Shiga toxin promotes exuberant C3a formation that triggers microvascular thrombosis. J Immunol. 2011;187:172–180. doi: 10.4049/jimmunol.1100491. [DOI] [PubMed] [Google Scholar]
- 10.Endo Y, Tsurugi K, Yutsudo T, et al. Site of action of a Vero toxin (VT2) from Escherichia coli O157:H7 and of Shiga toxin on eukaryotic ribosomes. RNA N-glycosidase activity of the toxins. Eur J Biochem. 1988;171:45–50. doi: 10.1111/j.1432-1033.1988.tb13756.x. [DOI] [PubMed] [Google Scholar]
- 11.Grabowski EF, Liu B, Gerace MR, et al. Shiga toxin-1 Decreases Endothelial Cell Tissue Factor Pathway Inhibitor Not Co-localized with Tissue Factor on the Cell Membrane. Thromb Res. 2015;135:1214–1217. doi: 10.1016/j.thromres.2015.03.018. [DOI] [PubMed] [Google Scholar]
- 12.Grabowski EF, Kushak RI, Liu B, et al. Shiga toxin downregulates tissue factor pathway inhibitor, modulating an increase in the expression of functional tissue factor on endothelium. Thromb Res. 2013;131:521–528. doi: 10.1016/j.thromres.2013.03.006. [DOI] [PubMed] [Google Scholar]
- 13.Jandhyala DM, Thorpe CM, Magun B. Ricin and Shiga toxins: effects on host cell signal transduction. Curr Top Microbiol Immunol. 2012;357:41–65. doi: 10.1007/82_2011_181. [DOI] [PMC free article] [PubMed] [Google Scholar]
- 14.Noris M, Mescia F, Remuzzi G. STEC-HUS, atypical HUS and TTP are all diseases of complement activation. Nat Rev Nephrol. 2012;8:622–633. doi: 10.1038/nrneph.2012.195. [DOI] [PubMed] [Google Scholar]
- 15.Cameron JS, Vick R. Letter: Plasma-C3 in haemolytic-uraemic syndrome and thrombotic thrombocytopenic purpura. Lancet. 1973;2:975. doi: 10.1016/s0140-6736(73)92645-7. [DOI] [PubMed] [Google Scholar]
- 16.Robson WL, Leung AK, Fick GH, et al. Hypocomplementemia and leukocytosis in diarrhea-associated hemolytic uremic syndrome. Nephron. 1992;62:296–299. doi: 10.1159/000187063. [DOI] [PubMed] [Google Scholar]
- 17.Monnens L, Molenaar J, Lambert PH, et al. The complement system in hemolytic-uremic syndrome in childhood. Clin Nephrol. 1980;13:168–171. [PubMed] [Google Scholar]
- 18.Thurman JM, Marians R, Emlen W, et al. Alternative pathway of complement in children with diarrhea-associated hemolytic uremic syndrome. Clin J Am Soc Nephrol. 2009;4:1920–1924. doi: 10.2215/CJN.02730409. [DOI] [PMC free article] [PubMed] [Google Scholar]
- 19.Stahl AL, Sartz L, Karpman D. Complement activation on platelet-leukocyte complexes and microparticles in enterohemorrhagic Escherichia coli-induced hemolytic uremic syndrome. Blood. 2011;117:5503–5513. doi: 10.1182/blood-2010-09-309161. [DOI] [PubMed] [Google Scholar]
- 20.Lapeyraque AL, Malina M, Fremeaux-Bacchi V, et al. Eculizumab in severe Shiga-toxin-associated HUS. N Engl J Med. 2011;364:2561–2563. doi: 10.1056/NEJMc1100859. [DOI] [PubMed] [Google Scholar]
- 21.Kielstein JT, Beutel G, Fleig S, et al. Best supportive care and therapeutic plasma exchange with or without eculizumab in Shiga-toxin-producing E. coli O104:H4 induced haemolytic-uraemic syndrome: an analysis of the German STEC-HUS registry. Nephrol Dial Transplant. 2012;27:3807–3815. doi: 10.1093/ndt/gfs394. [DOI] [PubMed] [Google Scholar]
- 22.Menne J, Nitschke M, Stingele R, et al. Validation of treatment strategies for enterohaemorrhagic Escherichia coli O104:H4 induced haemolytic uraemic syndrome: case-control study. BMJ. 2012;345:e4565. doi: 10.1136/bmj.e4565. [DOI] [PMC free article] [PubMed] [Google Scholar]
- 23.Gulla KC, Gupta K, Krarup A, et al. Activation of mannan-binding lectin-associated serine proteases leads to generation of a fibrin clot. Immunology. 2010;129:482–495. doi: 10.1111/j.1365-2567.2009.03200.x. [DOI] [PMC free article] [PubMed] [Google Scholar]
- 24.Hess K, Ajjan R, Phoenix F, et al. Effects of MASP-1 of the complement system on activation of coagulation factors and plasma clot formation. PLoS One. 2012;7:e35690. doi: 10.1371/journal.pone.0035690. [DOI] [PMC free article] [PubMed] [Google Scholar]
- 25.La Bonte LR, Pavlov VI, Tan YS, et al. Mannose-binding lectin-associated serine protease-1 is a significant contributor to coagulation in a murine model of occlusive thrombosis. J Immunol. 2012;188:885–891. doi: 10.4049/jimmunol.1102916. [DOI] [PMC free article] [PubMed] [Google Scholar]
- 26.Pavlov VI, Skjoedt MO, Siow TY, et al. Endogenous and natural complement inhibitor attenuates myocardial injury and arterial thrombogenesis. Circulation. 2012;126:2227–2235. doi: 10.1161/CIRCULATIONAHA.112.123968. [DOI] [PMC free article] [PubMed] [Google Scholar]
- 27.Collard CD, Vakeva A, Morrissey MA, et al. Complement activation after oxidative stress: role of the lectin complement pathway. Am J Pathol. 2000;156:1549–1556. doi: 10.1016/S0002-9440(10)65026-2. [DOI] [PMC free article] [PubMed] [Google Scholar]
- 28.Zhao H, Wakamiya N, Suzuki Y, et al. Identification of human mannose binding lectin (MBL) recognition sites for novel inhibitory antibodies. Hybrid Hybridomics. 2002;21:25–36. doi: 10.1089/15368590252917610. [DOI] [PubMed] [Google Scholar]
- 29.Pavlov VI, Tan YS, McClure EE, et al. Human mannose-binding lectin inhibitor prevents myocardial injury and arterial thrombogenesis in a novel animal model. Am J Pathol. 2015;185:347–355. doi: 10.1016/j.ajpath.2014.10.015. [DOI] [PMC free article] [PubMed] [Google Scholar]
- 30.Keepers TR, Psotka MA, Gross LK, et al. A murine model of HUS: Shiga toxin with lipopolysaccharide mimics the renal damage and physiologic response of human disease. J Am Soc Nephrol. 2006;17:3404–3414. doi: 10.1681/ASN.2006050419. [DOI] [PubMed] [Google Scholar]
- 31.Sauter KA, Melton-Celsa AR, Larkin K, et al. Mouse model of hemolytic-uremic syndrome caused by endotoxin-free Shiga toxin 2 (Stx2) and protection from lethal outcome by anti-Stx2 antibody. Infect Immun. 2008;76:4469–4478. doi: 10.1128/IAI.00592-08. [DOI] [PMC free article] [PubMed] [Google Scholar]
- 32.Petruzziello-Pellegrini TN, Yuen DA, Page AV, et al. The CXCR4/CXCR7/SDF-1 pathway contributes to the pathogenesis of Shiga toxin-associated hemolytic uremic syndrome in humans and mice. J Clin Invest. 2012;122:759–776. doi: 10.1172/JCI57313. [DOI] [PMC free article] [PubMed] [Google Scholar]
- 33.Acheson DW, Jacewicz M, Kane AV, et al. One step high yield affinity purification of shiga-like toxin II variants and quantitation using enzyme linked immunosorbent assays. Microb Pathog. 1993;14:57–66. doi: 10.1006/mpat.1993.1006. [DOI] [PubMed] [Google Scholar]
- 34.Wen SX, Teel LD, Judge NA, et al. Genetic toxoids of Shiga toxin types 1 and 2 protect mice against homologous but not heterologous toxin challenge. Vaccine. 2006;24:1142–1148. doi: 10.1016/j.vaccine.2005.08.094. [DOI] [PubMed] [Google Scholar]
- 35.Sheerin NS, Risley P, Abe K, et al. Synthesis of complement protein C3 in the kidney is an important mediator of local tissue injury. FASEB J. 2008;22:1065–1072. doi: 10.1096/fj.07-8719com. [DOI] [PubMed] [Google Scholar]
- 36.Zhou WD, Marsh JE, Sacks SH. Intrarenal synthesis of complement. Kidney Int. 2001;59:1227–1235. doi: 10.1046/j.1523-1755.2001.0590041227.x. [DOI] [PubMed] [Google Scholar]
- 37.Porubsky S, Federico G, Muthing J, et al. Direct acute tubular damage contributes to Shigatoxin-mediated kidney failure. J Pathol. 2014;234:120–133. doi: 10.1002/path.4388. [DOI] [PMC free article] [PubMed] [Google Scholar]
- 38.Paixao-Cavalcante D, Botto M, Cook HT, et al. Shiga toxin-2 results in renal tubular injury but not thrombotic microangiopathy in heterozygous factor H-deficient mice. Clin Exp Immunol. 2009;155:339–347. doi: 10.1111/j.1365-2249.2008.03826.x. [DOI] [PMC free article] [PubMed] [Google Scholar]
- 39.Locatelli M, Buelli S, Pezzotta A, et al. Shiga toxin promotes podocyte injury in experimental hemolytic uremic syndrome via activation of the alternative pathway of complement. J Am Soc Nephrol. 2014;25:1786–1798. doi: 10.1681/ASN.2013050450. [DOI] [PMC free article] [PubMed] [Google Scholar]
- 40.Obrig TG. Escherichia coli Shiga Toxin Mechanisms of Action in Renal Disease. Toxins (Basel) 2010;2:2769–2794. doi: 10.3390/toxins2122769. [DOI] [PMC free article] [PubMed] [Google Scholar]
- 41.Gallegos KM, Conrady DG, Karve SS, et al. Shiga toxin binding to glycolipids and glycans. PLoS One. 2012;7:e30368. doi: 10.1371/journal.pone.0030368. [DOI] [PMC free article] [PubMed] [Google Scholar]
- 42.Arvidsson I, Stahl AL, Hedstrom MM, et al. Shiga toxin-induced complement-mediated hemolysis and release of complement-coated red blood cell-derived microvesicles in hemolytic uremic syndrome. J Immunol. 2015;194:2309–2318. doi: 10.4049/jimmunol.1402470. [DOI] [PubMed] [Google Scholar]
- 43.Stahl AL, Arvidsson I, Johansson KE, et al. A Novel Mechanism of Bacterial Toxin Transfer within Host Blood Cell-Derived Microvesicles. PLoS Pathog. 2015;11:e1004619. doi: 10.1371/journal.ppat.1004619. [DOI] [PMC free article] [PubMed] [Google Scholar]
- 44.van der Pol P, Schlagwein N, van Gijlswijk DJ, et al. Mannan-binding lectin mediates renal ischemia/reperfusion injury independent of complement activation. Am J Transplant. 2012;12:877–887. doi: 10.1111/j.1600-6143.2011.03887.x. [DOI] [PubMed] [Google Scholar]
- 45.Sandvig K, van DB. Entry of ricin and Shiga toxin into cells: molecular mechanisms and medical perspectives. EMBO J. 2000;19:5943–5950. doi: 10.1093/emboj/19.22.5943. [DOI] [PMC free article] [PubMed] [Google Scholar]
- 46.Gomez SA, Abrey-Recalde MJ, Panek CA, et al. The oxidative stress induced in vivo by Shiga toxin-2 contributes to the pathogenicity of haemolytic uraemic syndrome. Clin Exp Immunol. 2013;173:463–472. doi: 10.1111/cei.12124. [DOI] [PMC free article] [PubMed] [Google Scholar]
- 47.Tateishi K, Matsushita M. Activation of the alternative complement pathway by mannose-binding lectin via a C2-bypass pathway. Microbiol Immunol. 2011;55:817–821. doi: 10.1111/j.1348-0421.2011.00378.x. [DOI] [PubMed] [Google Scholar]
- 48.Iwaki D, Kanno K, Takahashi M, et al. The role of mannose-binding lectin-associated serine protease-3 in activation of the alternative complement pathway. J Immunol. 2011;187:3751–3758. doi: 10.4049/jimmunol.1100280. [DOI] [PubMed] [Google Scholar]
- 49.Tedesco F, Pausa M, Nardon E, et al. The cytolytically inactive terminal complement complex activates endothelial cells to express adhesion molecules and tissue factor procoagulant activity. J Exp Med. 1997;185:1619–1627. doi: 10.1084/jem.185.9.1619. [DOI] [PMC free article] [PubMed] [Google Scholar]
- 50.Endo Y, Nakazawa N, Iwaki D, et al. Interactions of ficolin and mannose-binding lectin with fibrinogen/fibrin augment the lectin complement pathway. J Innate Immun. 2010;2:33–42. doi: 10.1159/000227805. [DOI] [PubMed] [Google Scholar]
- 51.Hess K, Ajjan R, Phoenix F, et al. Effects of MASP-1 of the complement system on activation of coagulation factors and plasma clot formation. PLoS One. 2012;7:e35690. doi: 10.1371/journal.pone.0035690. [DOI] [PMC free article] [PubMed] [Google Scholar]
- 52.Bathum L, Hansen H, Teisner B, et al. Association between combined properdin and mannose-binding lectin deficiency and infection with Neisseria meningitidis. Mol Immunol. 2006;43:473–479. doi: 10.1016/j.molimm.2005.02.017. [DOI] [PubMed] [Google Scholar]
- 53.Berger SP, Daha MR. Emerging role of the mannose-binding lectin-dependent pathway of complement activation in clinical organ transplantation. Current Opinions in Organ Transplantation. 2011;16:28–33. doi: 10.1097/MOT.0b013e3283425509. [DOI] [PubMed] [Google Scholar]
- 54.Bouwman LH, Roos A, Terpstra OT, et al. Mannose binding lectin gene polymorphisms confer a major risk for severe infections after liver transplantation. Gastroenterology. 2005;129:408–414. doi: 10.1016/j.gastro.2005.06.049. [DOI] [PubMed] [Google Scholar]
- 55.Super M, Thiel S, Lu J, et al. Association of low levels of mannan-binding protein with a common defect of opsonisation. Lancet. 1989;2:1236–1239. doi: 10.1016/s0140-6736(89)91849-7. [DOI] [PubMed] [Google Scholar]
- 56.Proulx F, Wagner E, Toledano B, et al. Mannan-binding lectin in children with Escherichia coli O157:H7 haemmorrhagic colitis and haemolytic uraemic syndrome. Clin Exp Immunol. 2003;133:360–363. doi: 10.1046/j.1365-2249.2003.02231.x. [DOI] [PMC free article] [PubMed] [Google Scholar]
- 57.van der Pol P, Schlagwein N, van Gijlswijk DJ, et al. Mannan-binding lectin mediates renal ischemia/reperfusion injury independent of complement activation. Am J Transplant. 2012;12:877–887. doi: 10.1111/j.1600-6143.2011.03887.x. [DOI] [PubMed] [Google Scholar]
- 58.Roos A, Rastaldi MP, Calvaresi N, et al. Glomerular activation of the lectin pathway of complement in IgA nephropathy is associated with more severe renal disease. J Am Soc Nephrol. 2006;17:1724–1734. doi: 10.1681/ASN.2005090923. [DOI] [PubMed] [Google Scholar]
- 59.National Research Council (US) Committee for the Update of the Guide for the Care and Use of Laboratory Animals . Guide for the Care and Use of Laboratory Animals. 8th edition National Academies Press (US); Washington (DC): 2011. [Google Scholar]
- 60.Walsh MC, Bourcier T, Takahashi K, et al. Mannose-binding lectin is a regulator of inflammation that accompanies myocardial ischemia and reperfusion injury. J Immunol. 2005;175:541–546. doi: 10.4049/jimmunol.175.1.541. [DOI] [PubMed] [Google Scholar]
- 61.Walsh MC, Shaffer LA, Guikema BJ, et al. Fluorochrome-linked immunoassay for functional analysis of the mannose binding lectin complement pathway to the level of C3 cleavage. J Immunol Methods. 2007;323:147–159. doi: 10.1016/j.jim.2007.04.004. [DOI] [PMC free article] [PubMed] [Google Scholar]
- 62.Sturgeon C, Sam AD, Law WR. Rapid determination of glomerular filtration rate by single-bolus inulin: a comparison of estimation analyses. J Appl Physiol (1985) 1998;84:2154–2162. doi: 10.1152/jappl.1998.84.6.2154. [DOI] [PubMed] [Google Scholar]
- 63.O'Brien SP, Smith M, Ling H, et al. Glomerulopathy in the KK.Cg-A(y) /J mouse reflects the pathology of diabetic nephropathy. J Diabetes Res. 2013;2013:498925. doi: 10.1155/2013/498925. [DOI] [PMC free article] [PubMed] [Google Scholar]
- 64.Tofukuji M, Stahl GL, Agah A, et al. Anti-C5a monoclonal antibody reduces cardioplegia-induced coronary endothelia dysfunction. J Thorac Cardiovasc Surg. 1998;116:1060–1068. doi: 10.1016/S0022-5223(98)70059-5. [DOI] [PubMed] [Google Scholar]
- 65.Weiler-Guettler H, Christie PD, Beeler DL, et al. A targeted point mutation in thrombomodulin generates viable mice with a prethrombotic state. J Clin Invest. 1998;101:1983–1991. doi: 10.1172/JCI2006. [DOI] [PMC free article] [PubMed] [Google Scholar]
- 66.Rangan GK, Tesch GH. Quantification of renal pathology by image analysis. Nephrology (Carlton ) 2007;12:553–558. doi: 10.1111/j.1440-1797.2007.00855.x. [DOI] [PubMed] [Google Scholar]
- 67.Lo TH, Tseng KY, Tsao WS, et al. TREM-1 regulates macrophage polarization in ureteral obstruction. Kidney Int. 2014;86:1174–1186. doi: 10.1038/ki.2014.205. [DOI] [PubMed] [Google Scholar]
- 68.Satake K, Shimizu Y, Sasaki Y, et al. Serum under-O-glycosylated IgA1 level is not correlated with glomerular IgA deposition based upon heterogeneity in the composition of immune complexes in IgA nephropathy. BMC Nephrol. 2014;15:89. doi: 10.1186/1471-2369-15-89. [DOI] [PMC free article] [PubMed] [Google Scholar]


