

Abstract
Resistance limits the effectiveness of receptor tyrosine kinase (RTK)-targeted therapies. Combination therapies targeting resistance mechanisms can considerably improve response, but will require an improved understanding of when particular combinations will be effective. One common form of resistance is bypass signaling, wherein RTKs not targeted by an inhibitor can direct reactivation of pathways essential for survival. While this mechanism of resistance is well appreciated, it is unclear which downstream signaling events are responsible. Here, we apply a combined experimental- and statistical modeling-based approach to identify a set of pathway reactivation essential for RTK-mediated bypass resistance. Differences in the downstream pathway activation provided by particular RTKs lead to qualitative differences in the capacity of each receptor to drive therapeutic resistance. We identify and validate that the JNK pathway is activated during and strongly modulates bypass resistance. These results identify effective therapeutic combinations that block bypass-mediated resistance and provide a basic understanding of this network-level change in kinase dependence that will inform the design of prognostic assays for identifying effective therapeutic combinations in individual patients.
Keywords: Breast cancer, lung cancer, cell signaling, reversal of drug resistance, molecular pharmacology
Introduction
Therapies targeting aberrant receptor tyrosine kinase (RTK) signaling are effective in treating a subset of multiple malignancies, including breast carcinoma and lung adenocarcinoma (1,2). Despite transient effectiveness, the resulting survival benefit of these therapies is limited by resistance mechanisms that allow tumor cells to escape the effect of therapy. Resistance etiology varies widely, including mutation of the drug target to block the effect of therapy, amplification of the drug target to overcome inhibition, pharmacokinetic barriers that block trafficking of drug to tumor cells, and “bypass” switching to alternative pathways not targeted by therapy (3,4). In the case of RTK-targeted therapies, many non-targeted RTKs may become activated to provide bypass resistance (5). Two well studied combinations are the ability of HER3 to provide resistance to HER2-targeted therapy in breast carcinoma and the ability of Met to provide resistance to EGFR-targeted therapies in lung carcinoma (6–10). In each case the resistance-conferring receptors may contribute to innate or adaptive resistance and can become activated by multiple means, including ligand-mediated autocrine or paracrine induction, amplification, or mutation (8,11,12).
Combination therapy can effectively combat resistance but will require accurate identification of relevant combinations for individual tumors. However, many receptors exist that can cause resistance and are activated through both tumor cell-intrinsic and -extrinsic means. This dictates that a more fundamental understanding of network-level bypass, and methods to identify effective combinations for individual tumors, will be required (6). An improved understanding of exactly which pathways must become reactivated to provide resistance may also identify widely effective therapeutic combinations not dependent upon the particular RTK providing bypass signaling.
Here, we have undertaken a combined experimental and computational approach to understand bypass resistance. We examine four cell lines in which activation of a non-inhibited RTK can provide bypass resistance in order to develop a multi-pathway understanding of the process (6). Through modeling and validation experiments, we identify a core set of pathway activation that determines whether cells are ultimately viable. Individual RTKs activate these pathways to varying extents, and thus have varying ability to drive bypass resistance. This observation in turn explains why RTK expression alone poorly predicts resistance capacity. We therefore apply this model to identify therapeutic combinations that can block bypass resistance from multiple driving receptors simultaneously. This information will be valuable for a basic understanding of bypass resistance, development of prognostic tools to identify resistance mechanism, and design of effective therapeutic combinations.
Materials & Methods
Cell Culture
BT474, SKBR3, and HCC827 were obtained from ATCC in 2015, confirmed by STR profiling by the source, and have been passaged for fewer than 6 months. PC9 was obtained from Sigma-Aldrich in 2015, confirmed by STR profiling by the source, and has been passaged for fewer than 6 months. HOP-62, HOP-92, H322M, and H522 confirmed by STR profiling were obtained from Merrimack Pharmaceuticals in 2016. BT474 and PC9 identities were additionally confirmed in 2016 through RNA sequencing experiments. BT474 and SKBR3 were grown in DMEM, while PC9, HOP-62, HOP-92, H322M, H522, and HCC827 were grown in RPMI-1640, both supplemented with 10% fetal bovine serum and 1% penicillin/streptomycin, at 37°C and 5% CO2.
Viability measurements were performed using CellTiter Glo reagent according to the manufacturer’s protocol (Promega). Cells were seeded in 96 well plates at a density of 200 per well, and treated the next day with the indicated GFs (Peprotech) and inhibitors (LC Labs). After 72 hours, CellTiter Glo reagent was mixed with each well and luminescence was quantified.
Cell Signaling and Protein Abundance Quantitation
Cells were treated for 4 hours with the indicated GFs and inhibitors in serum free medium without prior stimulation, then lysed in 10 mM Tris-HCl pH 8.0, 1 mM EDTA, 1% Triton-X100, 0.1% Na deoxycholate, 0.1% SDS, and 140 mM NaCl, with protease and phosphatase inhibitor supplemented before use (BioRad). Protein concentration was normalized by bicinchoninic acid assay.
A bead-based multiplexed ELISA-based assay was used for signaling measurement (Bio-Rad). In all cases, pERK is ERK1/2 (pT185/pY187, pT202/pY204), pMEK is MEK pS217/221, pGSK3 is GSK3α/β pS21/9, pAkt is Akt pS473, pP38 is P38 pT180/pY182, pcJun is c-Jun pS63, pSTAT3 is STAT3 pY705, and pJNK is JNK pT183/pY185. RTK abundance was quantified by multiplexed ELISA (Millipore). Absolute quantification of receptor abundance was performed by comparison to recombinant standards of each receptor (R&D Systems). Lysates were incubated with beads overnight, and then the beads were washed with 0.1% v/v Tween-20 in TBS. Detection antibody and streptavidin-phycoerythrin were incubated for 60 min and 10 min, respectively. Signal was quantified from each bead set using a MagPix Luminex reader (BioRad).
For quantification of total cJun, cells were treated and lysed identically to those used in ELISA measurement. Lysates were normalized according to protein concentration, and then separated by SDS-PAGE and transferred to a nitrocellulose membrane. Each membrane was incubated overnight with antibodies against cJun (Cell Signaling Technology, cat#9165) or paxillin (BD Biosciences, cat#610052).
Partial Least-Squares Regression and Generalized Linear Modeling
Partial least squares regression was performed using MatLab (MathWorks). Phosphosignaling time courses for each condition were summarized either by calculating the area under the curve via trapezoidal integration, or the steady state levels by averaging the 2- and 4-hour time points. Z-scored phosphosignaling measurements were regressed against z-scored viability measurements. The standard deviation of the loadings were calculated by jackknife, leaving out individual GF/drug combination treatments (13).
Generalized linear regression (GLM) models were developed relating cell signaling as measured at four hours to viability measurements at 72 hours using R. Before regression, each phosphorylation and viability measurement was z-score normalized. GLM models were fit using glm using the formula Viab ~ pAkt + pErk + pGSK + pcJun + pJNK + pP38 + pAkt×pErk. For sampling the model parameters posterior distribution, MCMCglmm from the package of the same name was used without thinning, a burn-in of 1000 iterations, and sampling over 10,000 iterations. Markov chain mixing was achieved according to the Geweke diagnostic. A default model prior of each parameter normally distributed around 0 with a variance of 1 was used.
Bliss Synergy Calculation
The interaction between Mek and JNK inhibition was calculated according to the Bliss independence model. Viability measurements were normalized to the value with no inhibitor treatment and then inverted to be in the form of percent inhibition:
Where Ex,y is the percent inhibition effect of a particular combination, Vx,y is the viability measurement for a particular combination, and V0 is the viability measured in the absence of inhibitor. Thus, for a condition where the measured viability was 70% of what was measured without inhibitor, this would become an effect of 30%. The results of combination inhibitor treatment were then calculated by Bliss independence, using the equation:
Where Ex, Ey and Ex,y are the effects of the individual inhibitors and combination, respectively. For example, if one inhibitor decreased viability by 10% and the other by 20% when administered alone, the predicted combined effect would be 0.1+0.2 − (0.1 × 0.2) = 0.28, or 28%. The measured and predicted effects were then plotted on an inverted scale, so that positive effects (inhibition of viability) were negative, to aid comparison with the untransformed viability measurements. The effects and difference between that predicted and measured were plotted on the same color scale for ease of comparison.
Flow Analysis
AXL and a kinase dead variant K562R were amplified from previously used vectors (15). Met and PDGFRb were amplified from pDONR223-PDGFRB and pDONR223-MET from William Hahn and David Root (Addgene plasmids 23893 & 23889) (16). Each receptor was then cloned into IRES-EGFP2 (Clontech). Cells were seeded densely on 10 cm plates, and then transfected the next day with 5 μg of each plasmid with a corresponding amount of 5 μL Lipofectamine 2000 in OptiMEM according to manufacturer’s instructions. After 4 hours, the media was exchanged into full serum media lacking antibiotics.
For evaluation of resistance-mediated selection, the day after transfection cells were split into 6 well plates and, after adhering, were placed in serum free media with inhibitor and GF as indicated. The next and following day, wells were trypsinized, spun down, and then resuspended in PBS. Fluorescence, forward scatter, and side scatter were then immediately quantified on an Accuri C6 (BD Biosciences).
For evaluating receptor overexpression, cells were trypsinized the day after transfection and fixed in 4% PFA in PBS for 1 hour, blocked in Odyssey Blocking Buffer (Li-Cor) for 1 hour, then stained with antibodies against Met, AXL, or PDGFRb overnight. The next day, cells were repeatedly washed and stained with Alexa-594 conjugated anti-mouse antibodies for 1 hour. After additional washing, fluorescence, forward scatter, and side scatter were immediately quantified on an Accuri C6 (BD Biosciences).
Results
RTK expression is essential but not sufficient for bypass resistance
To better understand the process of bypass resistance and its relationship to signaling network state we first selected two HER2-overexpressing breast carcinoma cell lines, both studied before for their sensitivity to the HER2-targeted inhibitor lapatinib and their capacity for bypass resistance in the presence of HRG (6). We treated each cell line with 0, 1, or 5 μM of lapatinib either alone or in the presence of 50 ng/mL of different growth factors (GFs) (Figure 1A). Cells exhibited a dose-dependent decrease in viability measured at 72 hours strongly counteracted by simultaneous addition of HRG and partially by other GFs (Figure 1B). To expand our perspective beyond HER2-dependent signaling dysregulation, we additionally selected two EGFR-dependent lung adenocarcinoma cell lines, PC9 and HCC827, that are accordingly sensitive to the EGFR inhibitor erlotinib. We measured viability with 0 or 1 μM erlotinib in the presence of 50 ng/mL of different GFs (Figure 1C). Particular GFs counteracted the erlotinib-induced decrease in viability in a consistent pattern to that observed previously (6).
Figure 1. RTK abundance does not fully predict bypass signaling capacity.

(A) Schematic of the relevant RTKs, growth factors (GFs), cell lines and inhibitors. (B) Luminescence-based measurement of SKBR3 and BT474 cell viability 72 hours after treatment with 0, 1, or 5 μM lapatinib and 50 ng/mL of the indicated GFs. (C) Luminescence-based measurement of PC9 and HCC827 cell viability 72 hours after treatment with 0 or 1 μM erlotinib and 50 ng/mL of the indicated GFs. Gray and red horizontal shaded regions indicate standard error of control conditions in the absence or presence of drug, respectively. Bar colors indicate conditions with partial (blue) or full (red) resistance. Green indicates viability in the absence of inhibitor or GF. Error bars indicate standard error of biological replicates (N = 5). (D–E) Correlation between RTK abundance and capacity to provide bypass resistance with addition of the cognate GF. “None” point is viability in the presence of drug without exogenous GF. Correlation significance calculated using Student’s t distribution for a transformation of Pearson’s correlation. Grey arrow indicates erlotinib-induced change observed in ErbB3 abundance. (F) Normalized receptor expression in PC9 cells after the indicated period of cell starvation in the presence or absence of 1 μM erlotinib. Error bars indicate the standard error of biological replicates (N = 2). Grey region indicates changes of less than 2-fold. (G) Combined plot of RTK abundance and resistance promotion across four cell lines. The viability measurements for each cell line were normalized such that the viability in the absence of inhibitor or GF was equal to 1.0 and the viability in the presence of inhibitor and absence of GF was equal to 0.0. Dotted line indicates threshold of 2×10⁶ per cell. (H) Threshold effect for MET and IGF1R resistance promotion across cell lines. Probe values for gene expression were measured previously (18). Each cell line was binned into whether resistance occurred with cognate ligand treatment by (6). The cell lines and raw data used are listed in table S1.
Because of manifold bypass possibilities among RTKs and their critical function in diverse biological processes, prospective diagnostic measurements are needed to identify which among many targeted therapies would be most effective to apply in precise combination to overcome bypass resistance. A first notion might be to measure and focus on treating those receptors that are most abundant or most abundantly activated within a tumor (17). Therefore, we next sought to directly determine the relationship between receptor abundance and capacity to provide bypass resistance. We measured the absolute abundance of seven RTKs across four cell lines using a recombinant standard. RTK abundances varied across several orders of magnitude, and for many cases the RTK that provided primary drug sensitivity was not the most abundant receptor (Figure S1A). To test the relationship between RTK abundance and resistance-promoting capacity (viability with inhibitor and growth factor normalized to that with just inhibitor), we plotted viability in the presence of inhibitor against the abundance of different GF-activated RTKs (Figure 1D & 1E). Each data point indicates RTK abundance matched to the viability promoting effect upon treatment with each cognate GF (Figure 1A). The viability of cells in the absence of erlotinib or lapatinib was predominantly dependent on EGFR or HER2 signaling, respectively. Therefore, we plotted in green the abundance of the inhibitor-targeted RTK and cell viability in the absence of inhibitor. While abundance significantly correlated with resistance capacity in the case of three cell lines, no significant correlation was observed for the HCC827 (Figure 1D & 1E). Strikingly, in HER2-dependent cells, HER3-HRG was relatively potent in its resistance-conferring capacity (Figure 1D), while it was less potent than predicted in EGFR-dependent cell lines (Figure 1E).
We considered that drug treatment or sustained serum withdrawal may influence RTK expression and thus the correlations we observed. For example, if HER2/HER3 expression is lost by either manipulation in PC9 cells, the change would explain the relative resistance-promoting inefficiency of HRG. Thus, we examined the influence of each over 24 hours in PC9 cells (Figure 1F). Only HER3 changed in abundance more than 2-fold, increasing up to 7-fold at 24 hours. This change in fact exacerbates the discrepancy and removes the correlation between viability and abundance (Figure 1E, tan line; r = 0.84, p < 0.05 to r = 0.62, p > 0.05). While more modest in effect, EGFR and MET displayed a simultaneous decrease of roughly 2-fold in abundance by 24 hours with serum withdrawal, or increase of 50% in the presence of 1 μM erlotinib (Figure S1B). Therefore, inhibitor-induced changes in RTK abundance only reduced the correlation between RTK abundance and resistance-promoting capacity in the case of PC9 cells.
Despite mixed correlation between RTK abundance and resistance capacity within cell lines, we did observe a consistent threshold effect across all four cell lines, wherein all receptors that promoted resistance more than 30% were more abundant than 2×10⁶ per cell (Figure 1G). We defined resistance promotion as the GF-induced increase in viability, scaled between 0.0 and 1.0, in order to compare across cell lines. To examine whether some threshold of expression might be necessary but not sufficient for resistance, we explored the results of two previous studies examining expression and ligand-induced resistance across a large number of cell lines (6,18). Similarly, we observed that expression below a certain level correctly predicted that ligand-induced bypass resistance would not occur, but also that high receptor expression could not predict resistance-promoting capacity (Figure 1H). Therefore, the abundance of a particular RTKs is unlikely to accurately predict whether it is driving resistance.
RTK overexpression identifies qualitative differences in resistance-promoting capacity
The four cell lines of the present study were selected based on their sensitivity to an RTK-targeted therapy and ability to display resistance upon the addition of one or more GFs (6). These criteria may artificially select for an improved correlation between RTK abundance and resistance-conferring capacity since cell lines lacking a resistance-promoting bypass receptor would not have been included. Therefore, we took an orthogonal approach, overexpressing individual RTKs in PC9 cells and then determining the extent to which each receptor could promote resistance to erlotinib when highly abundant (Figure 2).
Figure 2. Validation of variation in RTK bypass resistance capacity.

(A) Schematic of the selection assay to quantify resistance modulation. (B) Plot of FACS quantification for AXL-transfected PC9 cells 60 hours after transfection and 48 hours after addition of 1 μM erlotinib. Gating used for EGFP expressing or non-expressing cells is indicated. FSC, SSC, and GFP indicate forward scatter, side scatter, and GFP fluorescence values respectively. The number of GFP+ cells is matched to aid visualization of GFP- population depletion. (C) Quantification of selection for AXL-expressing PC9 cells in the presence of erlotinib with or without AXL kinase activity. (D) Quantification of selection for Met-overexpressing PC9 cells in the presence of erlotinib. (E) Quantification of selection for PDGFRb-overexpressing PC9 cells in the presence of erlotinib. Error bars indicate SEM (N = 3).
Many cell lines exhibit clonal heterogeneity that is reflected in their response to targeted inhibition (19,20). To account for this, we took a short-term overexpression approach, transiently overexpressing RTKs within an IRES-EGFP vector, to minimize clonal selection within the population of cells (Figure 2A). If overexpression of a particular RTK improved the resistance capacity of the cells we expected to observe selection of transiently transfected cells in the presence of inhibitor. We first selected overexpression of the RTK AXL as an orthogonal control, as the receptor’s role in resistance to EGFR-targeted treatment, often without exogenous ligand, is well-appreciated (11,21). Selection of transfected cells was quantified by flow analysis (Figure 2B). We observed selection for AXL transfected cells in the presence of erlotinib, dependent upon kinase activity of the receptor, providing confidence in our approach (Figure 2C).
Our previous observations indicate that Met is inefficient (promotes viability less than its abundance would suggest) but capable of EGFR-associated bypass resistance (Figure 1C & 1E). In contrast, in previous work across a panel of cell lines, PDGFRb was never observed to promote resistance, though very few cell lines showed expression of the receptor (6). Overexpressing each of these receptors and then selecting among a mixed population with erlotinib, we observed selection of Met-expressing cells in the presence of erlotinib, but no selection of PDGFRb-positive cells even when overexpressed (Figure 2D & 2E). We verified as a control that PDGFRb was indeed being overexpressed in GFP-positive cells (Figure S2). Thus, receptor expression alone is insufficient to predict mechanism of resistance, and receptors qualitatively differ in their resistance-promoting capacity. Further, in this cell line PDGFRb is incapable of promoting resistance at any expression level obtained by transient overexpression.
Conserved RTK-specific signaling exists despite differences in bypass capacity
In order to examine the role of downstream pathway activation we measured a panel of phosphorylation sites for each of the four cell lines, four hours after treatment with inhibitor and GFs, to capture the signaling consequences of each treatment (Figure 3A & 3B). Basic analysis of these signaling measurements captured known pathway associations. For example, pAkt and pGSK were clustered together in three of the four cell lines. For SKBR3, BT474, and HCC827, resistant conditions clustered with those in the absence of erlotinib (Figure 3A & 3B). For PC9 cells all of the conditions with erlotinib clustered separately from those without (Figure 3B). Overall clustering profiles were still quite distinct between cell lines, likely a reflection of different receptor and intracellular component expression levels (Figure 3A & 3B).
Figure 3. Generalized linear regression identifies core bypass resistance pathway components.

(A) Phosphorylation measurement of SKBR3 and BT474 cells at 4 hours after treatment with either 0 (no bar) or 1 μM (black bar) lapatinib and 50 ng/mL of the indicated growth factors (GFs). (B) Phosphorylation measurement of PC9 and HCC827 cells at 4 hours after treatment with either 0 (no bar) or 1 μM (black bar) erlotinib and 50 ng/mL of the indicated GFs. Conditions are colored according to the criteria in Figure 1A & 1B. (C) Generalized linear regression models of signaling and viability in each and combinations of the cell lines. (D) Fold change in each phosphorylation measurement observed upon treatment with indicated inhibitor. Data is derived from Figures 3A & 3B. Error bars indicate SEM propagated from each individual measurement in biological triplicate.
We applied generalized linear regression modeling, regressing our phosphorylation measurements against viability, to understand which phosphorylation sites could predict the particular GF conditions leading to resistance. In order to capture dependencies on coordinate pathway activation, we included an interaction term of Akt and Erk. We elected to not include other interaction terms, or more complex relationships, due to less prior evidence implicating the other pathways measured. In the EGFR-dependent cell lines PC9 and HCC827, pcJun (and pErk for HCC827) was identified as particularly important (Figure 3C & S3). A model combining measurements from both EGFR-dependent cell lines, with only significantly non-zero parameters shown, and 95% confidence intervals shown in parentheses, was: Viability = 0.17 (0.01−0.33) pErk + 0.75 (0.57−0.92) pcJun. Positive weighting of pcJun and pErk suggests that further phosphorylation contributes positively to resistance (Figure 3C & S3). In contrast, the regression models for the HER2-dependent cell lines SKBR3 and BT474 positively weighted pAkt but negatively weighted pcJun (Figure 3C & S3), indicating greater pcJun measurement corresponded to conditions with less viability. A model combining measurements from both HER2-dependent cell lines, with only significantly non-zero parameters shown, and 95% confidence intervals shown in parentheses, was Viability = 1.00 (0.69−1.32) Akt − 0.30 (0.51−0.09) cJun. The parameters identified as important by each model correlated with which phosphorylation sites were most inhibited by inhibitor treatment (Figure 3D, Wilcoxon signed rank test, p < 0.01). Model parameters were similar among but not between EGFR- or HER2-dependent cell lines, indicating that this influenced which pathway activation changes were essential for resistance (Figure S3). In total, this regression modeling identified that multiple pathway activation measurements are essential to predicting resistance conditions, and formed novel hypotheses as to the contribution of JNK pathway activation.
EGFR bypass resistance requires sustained JNK pathway signaling
Complex signaling dynamics can govern cellular phenotypic response to extracellular cues (22). Therefore, we wished to examine whether the inclusion of pcJun in our models of EGFR inhibitor bypass resistance might be due to incompletely capturing the complete dynamic response to ligand and inhibitor treatment. To determine this, we measured a dense timecourse of pErk, pMek, pcJun, and pAkt response in PC9 cells without erlotinib treatment, with simultaneous inhibitor treatment, or with 4-hour pretreatment (Figure 4A). These phosphosites were chosen as Akt and Mek/Erk reactivation are widely implicated in bypass resistance (6), and were the four phosphosites repeatedly selected in models based on a single time point (Figure 3C). As expected, the responses at shorter timescales were often distinct from the sustained responses observed. Similar to the measurements at 4 hours, these dynamic responses showed that each pathway was inhibited by erlotinib treatment, usually quite rapidly. While the responses to HGF stimulation changed little with addition of erlotinib, the bypass effects of other GFs were more complex. For example, addition of IGF entirely restored pAkt levels, but not pMEK or pcJun. FGF restored pcJun levels, but not pAkt or pMEK. Also, while HRG strongly activated all pathways in the absence of erlotinib, its response was dependent upon EGFR activity. These differences all highlight a potential source of variation in the resistance capacity of particular RTKs.
Figure 4. EGFR bypass resistance relies upon sustained JNK pathway signaling.

(A) Time-course measurement (0, 5, 10, 30, 60, 120, 240 mins) of pathway activation in PC9 cells. The red, blue and green lines indicate growth factor stimulation without drug, with simultaneous administration of 1 μM erlotinib, or with 4-hour drug pre-treatment, respectively. (B) pcJun and pMek with respect to viability at distinct timescales. Shapes indicate the administered growth factor, and colors indicate the viability measurement of the corresponding treatment. (C) pcJun and pErk1/2 with respect to viability at distinct timescales. (D) Percent variance in viability explained by reduced PLSR models based on area under the curve or sustained pathway measurement. The sustained measurement was calculated as the mean of the 2 and 4-hour time points. (E) Loadings of each phosphorylation measurement (X) and viability (Y) for the 2-component model with the sustained phosphosite measurements. Error bars indicate the standard deviation of each loading as calculated by bootstrap.
In order to examine the relationship between pcJun, Erk pathway activation, and bypass resistance over differing timescales, we plotted both pathways with viability measurements from each condition (Figure 4B & 4C). Regardless of whether pMek or pErk measurements were used, conditions separated by their eventual viability only at later time points (Figure 4B & 4C; 2–4 hrs). In both cases pcJun was required for separation, again demonstrating that pcJun is required to predict viability. To further evaluate the contribution of signaling at different timescales, we summarized the response of each condition using the area under the curve (AUC) of each phosphorylation time course, capturing early response, as well as the sustained (>2 hr) measurement. Using partial least squares regression, models could accurately predict the response of PC9 cells with the sustained (>2 hr) measurement (Figure 4D & 4E). pcJun was required for predictive capacity, but all earlier time points (AUC) were dispensable (Figure 4D). Sustained pMek/pErk was positively weighted with viability along principal component 1, while pcJun was weighted with viability along both principal components (Figure 4E), consistent with our earlier modeling (Figure 3C). In total, these results indicate that measurement of sustained pcJun and Erk pathway activation is necessary for accurate prediction of bypass resistance in PC9 cells.
Validation of the bypass resistance model identifies combination therapy approaches
With confidence that pcJun and Erk pathway activation were coordinately necessary for predicting bypass resistance development in PC9 cells, we sought to determine whether this interaction might suggest effective therapeutic combinations. We first measured the pathways influenced by treatment with a Mek inhibitor U0126 to ensure that pcJun was not simply responding to Erk activation. While Erk1/2 phosphorylation was completely abrogated by Mek inhibition, cJun phosphorylation was only modestly reduced in PC9, and not at all in HCC827 (Figure 5A & S4A). pcJun was most reliably and strongly abrogated by JNK inhibition (Figure S4A), however total cJun levels also varied, indicating this phosphorylation measurement is likely a measure of both protein abundance and phosphorylation changes (Figure S5). Thus, pcJun is most prominently modulated by JNK activity in these cells but is also influenced by Erk activity.
Figure 5. Model validation identifies points of effective combination therapy.

(A) pAkt, pMek, pErk1/2, and pcJun measurement of PC9 cells with 3 μM U0126 treatment. (B) Viability measurement of PC9 cells with combination Mek (U0126) and JNK (SP600125) inhibition. (C) Viability measurement of PC9 cells with combination Mek and JNK inhibition in the presence of 1 μM erlotinib. The y-axis is the same as that in (B). (D) pAkt, pMek, and pcJun measurement with erlotinib, erlotinib/HGF, and erlotinib/HGF/Dasatinib treatment. (E) Measurement of the viability increase conferred by HGF stimulation in the presence of 1 μM erlotinib combined with Src/Abl (Dasatinib) and Mek inhibition. (F) Measurement of the viability increase conferred by HGF stimulation in the presence of 1 μM erlotinib combined with Mek and JNK inhibition. (G) Viability measurement of BT474 cells with JNK inhibition in the presence and absence of 1 μM lapatinib. (H) pSTAT3 measurement in SKBR3 (top) and BT474 (bottom) cells with 1 μM lapatinib and/or EGF treatment. (I) pAkt measurement with EGF or HRG, with or without 1 μM lapatinib treatment. (J) Measurement of the viability increase conferred by EGF or HRG in the presence of 1 μM lapatinib combined with JNK inhibition. Error bars indicate SEM (N >= 3).
A first prediction of our model is that Erk and JNK inhibition would have additive effectiveness in decreasing PC9 viability (Figure 3D). Indeed, we observed that combination treatment with a JNK (SP600125) and Mek inhibitor coordinately reduced PC9 viability in the absence (Figure 5B) or presence (Figure 5C) of erlotinib. We observed the same coordinate reduction in viability with JNK and Mek inhibition across a panel of HCC827 and four other lung carcinoma cell lines, as well as with another JNK inhibitor JNK-IN-7 (Figure S4B & S4C). We used the Bliss independence model to examine the nature of combination Mek and JNK inhibition on viability (Figure S6A). This model recapitulated the results of the combination inhibitor treatments, consistent with an additive interaction between both inhibitors (Figure S6B & S6C).
Next, we predicted that bypass resistance via Met is coordinated through activation of JNK and Erk. Previous studies suggested that activation of JNK by Met occurs via Src family kinases (23). Indeed, Met-mediated pcJun, but not pMek, was blocked by Src inhibition (Dasatinib) (Figure 5D). Consistent with this and our model’s prediction of the coordinate importance of Erk/JNK activation to bypass resistance, Src (Figure 5E & S4D) or JNK (Figure 5F & S4E) inhibition cooperated with Mek inhibition to block increases in Met-induced viability.
In contrast to the case with EGFR-dependent cells, our models of signaling-viability relationship for HER2-dependent cell lines indicated that JNK inhibition should in fact increase viability (Figure 3D). To test this, we first examined the effect of JNK inhibition on viability in the presence or absence of lapatinib, and as predicted observed a dose-dependent increase (Figure 5G). We wondered if this effect could modulate the ability of particular GFs to provide resistance in HER2-dependent cell lines. In particular, while lapatinib is thought to be an EGFR/HER2 dual-targeting inhibitor, we observed potent STAT3 phosphorylation suggestive of EGFR activation with EGF-treatment in each HER2-dependent cell line, and an increase in STAT3 phosphorylation with lapatinib treatment (Figure 5H). This indicated that some amount of EGFR signaling must be maintained in the presence of lapatinib. With respect to Akt phosphorylation, while more modest than HRG treatment, EGF treatment increased Akt phosphorylation roughly 4-fold in the presence of lapatinib (Figure 5I). We predicted that this increase in Akt phosphorylation may have more pronounced effects in the presence of JNK inhibition. While EGF treatment only lead to a modest increase in viability in the absence of JNK inhibition, with JNK inhibition the GF was able to make BT474 cells completely resistant to lapatinib (Figure 1B & 5J). This indicates that JNK pathway activity strongly modulates the bypass signaling response of cells, and that our model accurately captures these effects through measurement of pcJun.
Discussion
While targeted therapies lead to survival benefits in patients, these benefits are usually short-lived due to resistance mechanisms. Many studies have focused on various mechanisms of resistance with the notion that identifying particular resistance mechanisms would lead to widely efficacious treatment combinations. These have left us with panoply mutations, expression changes, and tumor-extrinsic factors that can contribute to resistance, but little in the way of a unified understanding of these processes.
Here, we have focused on a family of resistance mechanisms that arise due to redundancy in the cellular signaling machinery. By a combined experimental and computational approach, we observe that bypass resistance can be predicted by coordinate measurement of multiple pathways. The pathways that must be reactivated for resistance in each case, however, depend on which RTK, and thus signals, have been therapeutically targeted. Due to the pathway dependencies, and particular RTKs being biased in their relative pathway activation, not all RTKs are similar in their capacity to provide resistance to a particular therapy (Figures 6 & 1). Previous works have similarly recognized that pathway reactivation must occur for bypass resistance, but have not attempted to capture what those signaling changes might be beyond Erk and Akt activation (5,6,11). Contribution of other pathways such as JNK would explain why Erk/Akt activation is not always entirely predictive of resistance (6).
Figure 6. Pathway bias underlies differences in bypass resistance capacity.
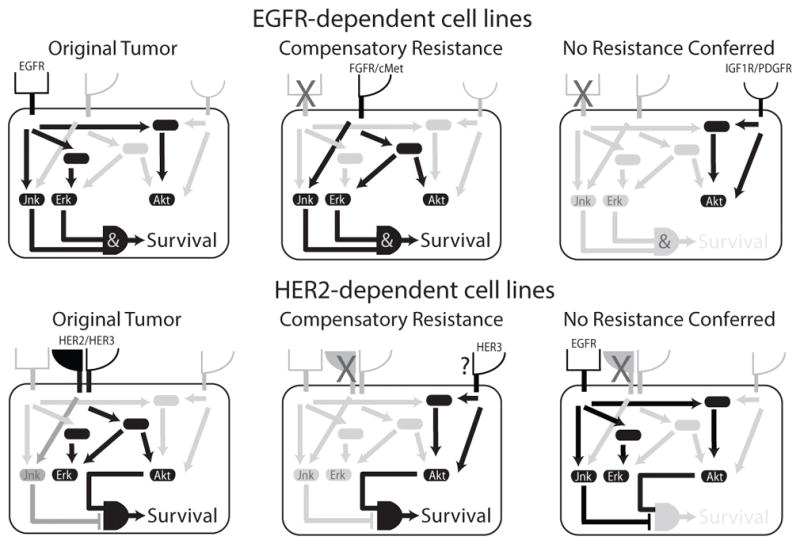
In RTK-driven tumors, essential signals are transduced from the receptor to various kinases. Upon blocking the original cancer driver, resistance can be conferred by an untargeted receptor. Some receptors, however, do not provide the full complement of essential resistance signals, or simultaneously activate pathways that inhibit cell viability. Differences in the required complement of downstream pathway activation results in particular receptors being more or less capable of driving bypass resistance. Understanding these pathway dependencies will identify points for therapeutic intervention and better methods to identify which receptor is driving resistance.
Our results indicate that the effects of JNK pathway activation—whether promoting or inhibiting resistance—depend upon the cellular context and/or the original RTK inhibited. The effects of the JNK pathway have similarly shown opposing effects on cell survival, apoptosis, and proliferation dependent upon cellular context, as well as activation duration and intensity, in many other cases (24). For example, surviving melanoma cells after Raf/Mek inhibitor treatment are enriched for higher JNK activation, and Raf/JNK dual inhibitor treatment is synergistic (25). On the other hand, positive feedback in JNK signaling response predicts neuroblastoma patient survival, and JNK inhibition drives tumor growth in a MYCN-driven spontaneous neuroblastoma model (26). In breast cancer, our observed negative relationship between cell survival/proliferation and JNK activity is supported by the oncogenic role of dominant-negative MAP2K4 mutants (27). However, dissecting the exact contexts in which JNK activity promotes or inhibits resistance will require more detailed study of the pathway’s diverse effects.
The widespread nature of redundancy-mediated resistance means we need precise and prognostic ways of identifying combination therapies. Just among RTK-targeted therapies, inhibitors for cMET, IGF1R, PDGFRb, EGFR, HER3, AXL, and HER2 have entered clinical trials. How will patients be matched to effective combinations of these therapies, while avoiding toxicity? A most basic approach might be to quantify the abundance of various RTKs within tumor cells, and selectively target those with highest abundance or activation (17). Our results, however, indicate that receptors display qualitative differences in their resistance capacity (Figure 1 & 2), suggesting this approach would be poorly predictive of effective therapeutic combinations. Rather, a more effective approach might be to identify receptors providing the particular pathway activation essential to conferring resistance. It was recently shown that selective measurement of Grb2-EGFR interaction could prognostically predict therapeutic response, moreso than abundance or phosphorylation of EGFR (28). Similarly, our results indicate that if different receptors rely on the same adapter proteins for essential pathway reactivation, assays might be developed to evaluate which receptor is interacting with a particular adapter, identifying the particular RTK mediating resistance.
In which cases does resistance in essence represent reestablishment of the same signaling state as opposed to fundamentally different requirements for cancer cell survival? Our results suggest that RTK bypass resistance often corresponds to reactivation of the particular pathways lost by inhibitor treatment, resembling intracellular signaling in the absence of inhibitor (e.g. HRG in BT474 & SKBR3, Figure 3A). Particular RTKs can provide measurable signaling responses and yet fail to produce resistance due to mismatch between the requisite and provided signaling changes (Figure 4A). An outstanding question is whether more global transcriptional mechanisms of resistance, such as epithelial-mesenchymal transition, operate through fundamental changes in the pathways relied on for survival, or if other factors such as RTK expression changes still lead to activation of the same survival pathways (29). The many pathways involved in the development of resistance will necessitate modeling approaches such as those undertaken here to address these mechanisms.
Supplementary Material
Acknowledgments
Financial Support: This work was supported by NIH 1-DP5-OD019815-01 to A.S. Meyer and in part by the Koch Institute Support (core) Grant P30-CA14051 from the National Cancer Institute.
The authors would like to thank Douglas Lauffenburger, Forest White, Allison Claas, Sarah Schrier, and Annelien Zweemer for helpful discussions. This work was supported by NIH 1-DP5-OD019815-01 to A.S.M. and in part by the Koch Institute Support (core) Grant P30-CA14051 from the National Cancer Institute.
Footnotes
Disclosure of Conflicts of Interest
The authors declare no potential conflicts of interest.
References
- 1.Shepherd FA, Rodrigues Pereira J, Ciuleanu T, Tan EH, Hirsh V, Thongprasert S, et al. Erlotinib in previously treated non-small-cell lung cancer. N Engl J Med. 2005;353:123–32. doi: 10.1056/NEJMoa050753. [DOI] [PubMed] [Google Scholar]
- 2.Baselga J, Cortés J, Kim S-B, Im S-A, Hegg R, Im Y-H, et al. Pertuzumab plus trastuzumab plus docetaxel for metastatic breast cancer. N Engl J Med. 2012;366:109–19. doi: 10.1056/NEJMoa1113216. [DOI] [PMC free article] [PubMed] [Google Scholar]
- 3.Ercan D, Xiao Y, Capelletti M, Rogers A, Brown A, Lee C, et al. Amplification of EGFR T790M causes resistance to an irreversible EGFR inhibitor. Oncogene. 2010;29:2346–56. doi: 10.1038/onc.2009.526. [DOI] [PMC free article] [PubMed] [Google Scholar]
- 4.Provenzano PP, Cuevas C, Chang AE, Goel VK, Hoff Von DD, Hingorani SR. Enzymatic Targeting of the Stroma Ablates Physical Barriers to Treatment of Pancreatic Ductal Adenocarcinoma. Cancer Cell Elsevier Inc. 2012;21:418–29. doi: 10.1016/j.ccr.2012.01.007. [DOI] [PMC free article] [PubMed] [Google Scholar]
- 5.Niederst MJ, Engelman JA. Bypass mechanisms of resistance to receptor tyrosine kinase inhibition in lung cancer. Sci Signal AAAS. 2013;6:re6–re6. doi: 10.1126/scisignal.2004652. [DOI] [PMC free article] [PubMed] [Google Scholar]
- 6.Wilson TR, Fridlyand J, Yan Y, Penuel E, Burton L, Chan E, et al. Widespread potential for growth-factor-driven resistance to anticancer kinase inhibitors. Nature. 2012;487:505–9. doi: 10.1038/nature11249. [DOI] [PMC free article] [PubMed] [Google Scholar]
- 7.Tao JJ, Castel P, Radosevic-Robin N, Elkabets M, Auricchio N, Aceto N, et al. Antagonism of EGFR and HER3 Enhances the Response to Inhibitors of the PI3K-Akt Pathway in Triple-Negative Breast Cancer. Sci Signal. 2014;7:ra29–9. doi: 10.1126/scisignal.2005125. [DOI] [PMC free article] [PubMed] [Google Scholar]
- 8.Turke AB, Zejnullahu K, Wu Y-L, Song Y, Dias-Santagata D, Lifshits E, et al. Preexistence and Clonal Selectionof MET Amplification in EGFR Mutant NSCLC. Cancer Cell Elsevier Ltd. 2010;17:77–88. doi: 10.1016/j.ccr.2009.11.022. [DOI] [PMC free article] [PubMed] [Google Scholar]
- 9.Wilson TR, Lee DY, Berry L, Shames DS, Settleman J. Neuregulin-1-mediated autocrine signaling underlies sensitivity to HER2 kinase inhibitors in a subset of human cancers. Cancer Cell. 2011;20:158–72. doi: 10.1016/j.ccr.2011.07.011. [DOI] [PubMed] [Google Scholar]
- 10.Hutcheson IR, Knowlden JM, Hiscox SE, Barrow D, Gee JMW, Robertson JF, et al. Heregulin beta1 drives gefitinib-resistant growth and invasion in tamoxifen-resistant MCF-7 breast cancer cells. Breast Cancer Res BioMed Central Ltd. 2007;9:R50. doi: 10.1186/bcr1754. [DOI] [PMC free article] [PubMed] [Google Scholar]
- 11.Zhang Z, Lee JC, Lin L, Olivas V, Au V, LaFramboise T, et al. Activation of the AXL kinase causes resistance to EGFR-targeted therapy in lung cancer. Nat Genet. 2012;44:852–60. doi: 10.1038/ng.2330. [DOI] [PMC free article] [PubMed] [Google Scholar]
- 12.Szerlip NJ, Pedraza A, Chakravarty D, Azim M, McGuire J, Fang Y, et al. Intratumoral heterogeneity of receptor tyrosine kinases EGFR and PDGFRA amplification in glioblastoma defines subpopulations with distinct growth factor response. Proc Natl Acad Sci USA. 2012;109:3041–6. doi: 10.1073/pnas.1114033109. [DOI] [PMC free article] [PubMed] [Google Scholar]
- 13.Efron B, Gong G. A leisurely look at the bootstrap, the jackknife, and cross-validation. Am Stat. 1983;37:36–48. [Google Scholar]
- 14.Greco WR, Bravo G, Parsons JC. The search for synergy: a critical review from a response surface perspective. Pharmacol Rev. 1995;47:331–85. [PubMed] [Google Scholar]
- 15.Meyer AS, Zweemer AJM, Lauffenburger DA. The AXL Receptor is a Sensor of Ligand Spatial Heterogeneity. Cell Syst. 2015;1:25–36. doi: 10.1016/j.cels.2015.06.002. [DOI] [PMC free article] [PubMed] [Google Scholar]
- 16.Johannessen CM, Boehm JS, Kim SY, Thomas SR, Wardwell L, Johnson LA, et al. COT drives resistance to RAF inhibition through MAP kinase pathway reactivation. Nature. 2010;468:968–72. doi: 10.1038/nature09627. [DOI] [PMC free article] [PubMed] [Google Scholar]
- 17.Kothari V, Wei I, Shankar S, Kalyana-Sundaram S, Wang L, Ma LW, et al. Outlier Kinase Expression by RNA Sequencing as Targets for Precision Therapy. Cancer Discovery. 2013 doi: 10.1158/2159-8290.CD-12-0336. [DOI] [PMC free article] [PubMed] [Google Scholar]
- 18.Barretina J, Caponigro G, Stransky N, Venkatesan K, Margolin AA, Kim S, et al. The Cancer Cell Line Encyclopedia enables predictive modelling of anticancer drug sensitivity. Nature. 2012;483:603–7. doi: 10.1038/nature11003. [DOI] [PMC free article] [PubMed] [Google Scholar]
- 19.Fallahi-Sichani M, Honarnejad S, Heiser LM, Gray JW, Sorger PK. Metrics other than potency reveal systematic variation in responses to cancer drugs. Nature Chemical Biology Nature Publishing Group. 2013;9:708–14. doi: 10.1038/nchembio.1337. [DOI] [PMC free article] [PubMed] [Google Scholar]
- 20.Bhang H-EC, Ruddy DA, Krishnamurthy Radhakrishna V, Caushi JX, Zhao R, Hims MM, et al. Studying clonal dynamics in response to cancer therapy using high-complexity barcoding. Nat Med. 2015:1–13. doi: 10.1038/nm.3841. [DOI] [PubMed] [Google Scholar]
- 21.Meyer AS, Miller MA, Gertler FB, Lauffenburger DA. The receptor AXL diversifies EGFR signaling and limits the response to EGFR-targeted inhibitors in triple-negative breast cancer cells. Sci Signal. 2013;6:ra66–6. doi: 10.1126/scisignal.2004155. [DOI] [PMC free article] [PubMed] [Google Scholar]
- 22.Behar M, Barken D, Werner SL, Hoffmann A. The Dynamics of Signaling as a Pharmacological Target. Cell Elsevier Inc. 2013;155:448–61. doi: 10.1016/j.cell.2013.09.018. [DOI] [PMC free article] [PubMed] [Google Scholar]
- 23.Garcia-Guzman M, Dolfi F, Zeh K, Vuori K. Met-induced JNK activation is mediated by the adapter protein Crk and correlates with the Gab1-Crk signaling complex formation. Oncogene. 1999;18:7775–86. doi: 10.1038/sj.onc.1203198. [DOI] [PubMed] [Google Scholar]
- 24.Wagner EF, Nebreda AR. Signal integration by JNK and p38 MAPK pathways in cancer development. Nat Rev Cancer. 2009;9:537–49. doi: 10.1038/nrc2694. [DOI] [PubMed] [Google Scholar]
- 25.Fallahi-Sichani M, Moerke NJ, Niepel M, Zhang T, Gray NS, Sorger PK. Systematic analysis of BRAFV600E melanomas reveals a role for JNK/c-Jun pathway in adaptive resistance to drug-induced apoptosis. Mol Syst Biol. 2015;11:797–7. doi: 10.15252/msb.20145877. [DOI] [PMC free article] [PubMed] [Google Scholar]
- 26.Fey D, Halasz M, Dreidax D, Kennedy SP, Hastings JF, Rauch N, et al. Signaling pathway models as biomarkers: Patient-specific simulations of JNK activity predict the survival of neuroblastoma patients. Sci Signal. 2015;8:ra130–0. doi: 10.1126/scisignal.aab0990. [DOI] [PubMed] [Google Scholar]
- 27.Kan Z, Jaiswal BS, Janakiraman V, Bhatt D, Stern HM, Yue P, et al. Diverse somatic mutation patterns and pathway alterations in human cancers. Nature. 2010;466:869–73. doi: 10.1038/nature09208. [DOI] [PubMed] [Google Scholar]
- 28.Smith MA, Hall R, Fisher K, Haake SM, Khalil F, Schabath MB, et al. Annotation of human cancers with EGFR signaling-associated protein complexes using proximity ligation assays. Sci Signal. 2015;8:ra4–ra4. doi: 10.1126/scisignal.2005906. [DOI] [PMC free article] [PubMed] [Google Scholar]
- 29.Thomson S, Petti F, Sujka-Kwok I, Mercado P, Bean J, Monaghan M, et al. A systems view of epithelial-mesenchymal transition signaling states. Clin Exp Metastas. 2011;28:137–55. doi: 10.1007/s10585-010-9367-3. [DOI] [PMC free article] [PubMed] [Google Scholar]
Associated Data
This section collects any data citations, data availability statements, or supplementary materials included in this article.