Abstract
In this study, the synthesis of SBA-15/Ag nanocomposite materials with different amounts of silver (2.5, 5, and 10 %) has been investigated under acidic conditions by using P123 as a template via the direct method. The nanocomposites of SBA-15 were synthesized by the same method and by the addition of silver salt. Finally, the nanocomposite materials were examined for the removal of mercury ions from wastewater as an adsorbent by the reverse titration method. Characterization was carried out through x-ray diffraction analysis (XRD), scanning electron microscopy (SEM), transmission electron microscopy (TEM), and N2 adsorption-desorption (Brunauer–Emmett–Teller). XRD spectra confirmed the presence of silver nanoparticles within the amorphous silica matrix of SBA-15. The Barrett–Joyner–Halenda analysis showed that SBA-15 and SBA-15/Ag have a narrow pore size distribution. SEM images demonstrated that the morphology of the matrix of SBA-15 is in spherical state. Furthermore, wavelength dispersive x-ray spectroscopy identified the presence and distribution of silver nanoparticles inside the pore channels and outside of them. Typical TEM images of SBA-15 and SBA-15/Ag (5 wt.%) indicated a regular hexagonal pore structure with long-range order and long channels. In SBA-15/Ag (5 wt.%) sample, the nanoparticles of silver was found into the pores and outside of them. The removal of mercury ions from wastewater using mesoporous silica nanocomposite containing silver nanoparticles was studied by the reverse titration analysis. The best capacity of adsorption of mercury ions from wastewater was obtained for SBA-15/Ag (5 wt.%) sample, which was equal to 42.26 mg/g in 20 min at pH of 7. The Freundlich model was used to explain the adsorption characteristics for the heterogeneous surface, and (adsorption capacity) and n (adsorption intensity) were determined for Hg (II) ion adsorption on SBA-15/Ag nanocomposite materials with different amounts of silver (2.5, 5, and 10 %). The value of R2 was about 0.99, 0.99, 0.98, and 0.98 and Kf was about 42, 48, 58, and 58 mg/g for SBA-15/Ag, SBA-15/Ag (2.5 %), SBA-15/Ag (5 %), and SBA-15/Ag (10 %), respectively. Furthermore, the values of n >1 show a favorable adsorption process for Hg (II) ion adsorption on SBA-15/Ag nanocomposite materials. Moreover, the Langmuir isotherm model evaluation showed that the correlation coefficients for all concentrations were R2 >0.99, indicating that Hg (II) ions were adsorbed on the surface of SBA-15/Ag via chemical and physical interaction. Additionally, the analytic hierarchy process (AHP) and Technique of Order Preference Similarity to the Ideal Solution (TOPSIS) methods that depend on the criteria of the surface area, amount of adsorbent, pore volume, and cost of synthesis were used. The evaluation of results showed that the best sample was SBA-15/Ag (5 wt.%). Furthermore, the research work highlighted the antibacterial nanocomposite with suitable adsorption of Hg (II) ions from water solutions and supported its potential for environmental applications. This nanocomposite can be used in the absorption domain of Hg (II) ions from water solutions.
Keywords: Mesoporous silica, Nanocomposite, Silver nanoparticles, Removal of mercury ions, Wastewater
Introduction
Heavy metals are enrolled into the surface and groundwater due to various activities such as paint and pigment manufacturing, and electroplating. Heavy metals such as mercury, lead, copper, cadmium, zinc, and nickel are the most common metallic contaminants in wastewaters. The removal of heavy metals from industrial effluents due to their toxicity and tendency to bioaccumulation before discharge into the environment is required to mitigate any impact on plants, animals, and humans. These metals are toxic for organisms and humans even at low concentrations. Mercury is one of the most important heavy metal pollutants in the environment. It is a heavy metal and there is in three chemical forms, namely, elemental, inorganic, and organo(alkyl) mercury [1, 2]. The source of this metal is in natural water, sediment, draining water in urban areas, and industrial waste. Many industries directly or indirectly contribute to the discharge of mercury into the environment. However, some types of natural resources create toxic metals. There is elemental mercury in the chemical structure of some types of fluorescent and plastic dyes. The presence of mercury in pesticides, insecticides, disinfectants, and batteries is often inorganic, and the presence of mercury in waste of some factories is often organic (http://www.usgs.gov./themes/factsheet/146–00/index.html). The inorganic form of mercury is absorbed about 10 % by the gastrointestinal tract and enters the blood less than the metallic form. The lung is the main goal when humans are exposed to mercury vapor. Elemental mercury is soluble in fat and can enter the blood after inhalation.
Currently, the possibility of the presence of these pollutants in water is rising day by day. This element not only causes direct harm to human health but also accumulates in the fish bodies and can affect human health indirectly. Nervous disorder, depression, nausea, vomiting, chest pain, shortness of breath, or pulmonary and renal dysfunction can be noted as the major effects of mercury on the human body [3]. Due to its high toxicity effects, the World Health Organization (WHO) has set the maximum allowable concentration (MCL) of mercury in drinking water equal to 0.5–1.5 mg/L, which is less than the allowable limit that is considered for other metals [4]. Currently, there are various methods to reduce water pollutions such as filtration, adsorption, oxidation, chemical precipitation as hydroxides, carbonates or sulfides and subsequent liquid–solid separation, ion exchange, membrane processes, reverse osmosis, electrolytic recovery, and liquid–liquid extraction. However, several of these methods are often time consuming with high costs, low efficiency, and disposal of the secondary toxic sludge. Furthermore, these technologies are ineffective when the toxic metal is present in wastewaters at low concentrations. Therefore, a few of them are just accepted for many pollutants. In recent years, adsorption technique has been considered more due to its simplicity, cheapness, convenience, and effectiveness for the treatment of wastewater. In this method, an adsorbent is used for the treatment of wastewater, which has been widely investigated for the removal of heavy metals from water solution [5]. A successful adsorption procedure is related to the adsorption ability of the adsorbents. To remove various contaminants from water, several adsorbents have been reported such as activated carbon, zeolites, clays, metal hydroxides, metal oxides, bentonite, and agricultural residues. However, their important disadvantages are their low adsorption capacities, their relatively weak interactions with metallic ions, and difficulties of their separation and reusability from wastewater. To improve these limitations, organic-inorganic hybrid materials have been used for the removal of toxic ions from wastewater [6–13]. Furthermore, silica gel, modified alumina nanoparticles, chitosan, carbon nanomaterials [6–13], nanoporous materials, carbonated tricalcium silicate, silica gel containing sulfur, nitrogen, and oxygen, functionalized silica [6–13], and modified nanoporous materials such as silica nanoparticles have been studied as adsorbent for heavy metal ion adsorption from aqueous and non-aqueous solutions [13–34]. Mesoporous silica materials are known as promising materials for adsorption applications. The synthesis of these materials via hydrothermal method is simple and inexpensive. Moreover, they are inert and non-toxic materials from a physiological viewpoint. Mesoporous silica materials are porous with pore diameters in the range of 2–50 nm. Because of their higher surface area and greater active sites for interaction with pollutants, pore volume, adjustable pore diameter, easy surface modification, and excellent biocompatibility, these materials are useful in the field of adsorption and separation. Mesoporous silica nano-based composites with different porosity characteristics such as size, shape, and relationship between porosity and with different morphologies have been widely described in the literature [35, 36]. Among this family of materials, MCM-41 and SBA-15 types of mesoporous silica containing one- and two-dimensional cylindrical channels have mostly been studied. On the other hand, several studies have been performed on the interaction between silver nanoparticles and mercury ions [34, 37]. In adsorption applications, a uniform dispersion of silver nanoparticles and effective control of the size and amount of nanoparticles are usually required. However, nanoparticles have a tendency to aggregate to bulk-like materials, which decreases the adsorption capacity and selectivity if the silver nanoparticle amount selected is more than 10 %. Therefore, the silver nanoparticle must be doped in an ordered mesoporous silica uniformly. Thus, the silver nanoparticle amount must be selected between 2.5 and 10 % [38]. In this case, the SBA-15 modified by silver nanoparticles such as a new antibacterial nanocomposite material has been studied for the removal of mercury ions from wastewater at room temperature (27 ± 1 °C). The silver nanoparticles have been used for the purification of tap water in filter devices to inhibit the growth of microorganisms. Because Ag+ ions are adsorbed to the negatively charged bacterial cell wall, the inactivation enzymes inhibited cell growth [38]. Since the reduction potential of silver (Ag++e−⟶Ag) and the reduction potential of mercury (Hg2++2e−⟶Hg) are E0 = 0.08 V and 0.085 V, respectively, a high reactivity of Hg2+ with bulk silver should not be expected. However, nanoscale silver is expected to be more reactive because there is a decrease in reduction of potential by reducing the size of silver particles [39]. When absorbents of the SBA-15 containing silver nanoparticles are used for the removal of mercury ions from wastewater, Hg2+ is reduced to Hg. Thus, the reduced Hg on the surface of silver nanoparticles reacts and creates an alloy compound [39, 40]. There are many factors affecting the adsorption process such as the chemical form of metals, metal type, type of adsorbent, metal concentration, the amount of adsorbent, pH, temperature, etc. In this study, SBA-15/Ag nanocomposite has been employed as an adsorbent. Furthermore, the effect of various parameters such as initial Hg (II) concentration, contact time, pH, adsorbent dose, and stirring rate on the adsorption has been studied. In the end, Langmuir and Freundlich isotherms have been investigated to understand the mechanism of the adsorption, and the best sample for mercury adsorption from wastewater has been selected by analytic hierarchy process (AHP) and Technique of Order Preference Similarity to the Ideal Solution (TOPSIS) method.
Materials and methods
Reagents and materials
Pluronic 123 (P123, EO20PO70EO20, MW = 5800; Merck), tetraethylorthosilicate (TEOS; Merck), and silver nitrate (AgNO3, 99.8 wt.%; Merck) were used as surfactant, silica source, and silver source, respectively.
The synthesis of SBA-15 and SBA-15/Ag materials
SBA-15 and SBA-15/Ag materials were synthesized by the method reported by Zhu [41]. The details are described below:
For SBA-15 preparation, first 4 g of P123 was dissolved in the solution containing 120 g of deionized water and 12 g of nitric acid with stirring state at 35 °C. Then, 6.52 g of TEOS was added drop by drop and the mixture was stirred at 35 °C for 20 h, and aging treatment was performed without stirring at 100 °C for 48 h. The white solid product was filtered, washed with deionized water, dried at room temperature, and heated in air at 500 °C for 5 h. Following the synthesis of the mesoporous SBA-15/Ag sample, in the first step, 2 g of P123, 60 g of deionized water, and 6 g of nitric acid were mixed and stirred for 1 h at 35 °C until a homogenous solution is formed under acidic conditions. While stirring, 0.15, 0.30, and 0.60 g of silver nitrate were added to the solution and stirred for 1 h at the same temperature in the closed chamber to obtain SBA-15/Ag nanocomposite with 2.5, 5, and 10 wt.% of silver, respectively. Then, 4.26 g of TEOS was added to the solution and stirred for 20 h at 35 °C in the closed chamber. The obtained solution was aged without stirring at 100 °C for 48 h in the closed chamber. The product was filtered and washed with deionized water for several times to remove the unnecessary silver nitrate. Finally, the products were heated at 530 °C for 5 h in air, removing the P123 and decomposing the AgNO3, to obtain the Ag nanoparticles.
Experimental
Small-angle x-ray scattering, a Philips X’pert powder diffractometer system with Cu Kα (λ = 1.541 Å) radiation, was used for x-ray investigations. XRD analysis was done from 0.5 to 3.0°. The high-angle powder x-ray diffraction (XRD) patterns of SAB-15/Ag were analyzed using an x-ray diffractometer D8 advance powder diffractometer with Cu Kα radiation. Diffraction patterns were obtained at 0–90° with Cu Kα radiation and a scan rate of 0.02°. The nitrogen adsorption and desorption isotherms at about −196 °C were used to determine the total pore volume via a relative pressure (P/P0). The specific surface area was calculated using the Brunauer–Emmett–Teller (BET) standard method for adsorption data in the relative adsorption range of 0.05–01.4. Pore size distributions were calculated by the Barrett–Joyner–Halenda (BJH) method using the desorption branch of the isotherm. Transmission electron micrographs (TEM) and electron microscopy images (SEM) equipped with wavelength dispersive x-ray spectroscopy (WDS) were taken on a Zeiss EM10C electron microscope operating at 200 kV and on a Philips model XL30 at 20 kV. Finally, the removal of mercury ions from wastewater using mesoporous silica nanocomposites containing variable amounts of silver nanoparticles was studied. In order to determine, the mercury adsorption isotherms were examined by multiple sets of batch experiments. Single runs were done under stirring 50 mg of SAB-15/Ag in 100 ml HgCl2 solutions at 27 °C to obtain the equilibrium time. Then, solutions were filtered with a paper filter of 0.5 μm, and the filtered solutions were evaluated. Furthermore, the effect of pH solution, contact time, stirring rate, adsorbent dose, and initial concentration of mercury ions were examined on the adsorption amount of Hg2+ from an aqueous solution. Finally, mercury adsorbed amount was calculated by the difference between initial and final metal concentrations in the solution using back-titration analysis.
Back titration is a titration done in reverse; instead of titrating the original sample, a known excess of standard reagent is added to the solution, and the excess is titrated. Back titration is useful if the endpoint of the reverse titration is easier to identify than the endpoint of the normal titration, as with precipitation reactions. Back titrations are also useful if the reaction between the analyte and the titrant is very slow or when the analyte is in a non-soluble solid. The details of back titration were discussed in the literature [42]. Additionally, experimental data were studied to recognize the mechanism of the adsorption and AHP and TOPSIS methods to find the optimum condition of the adsorbent.
Results and discussion
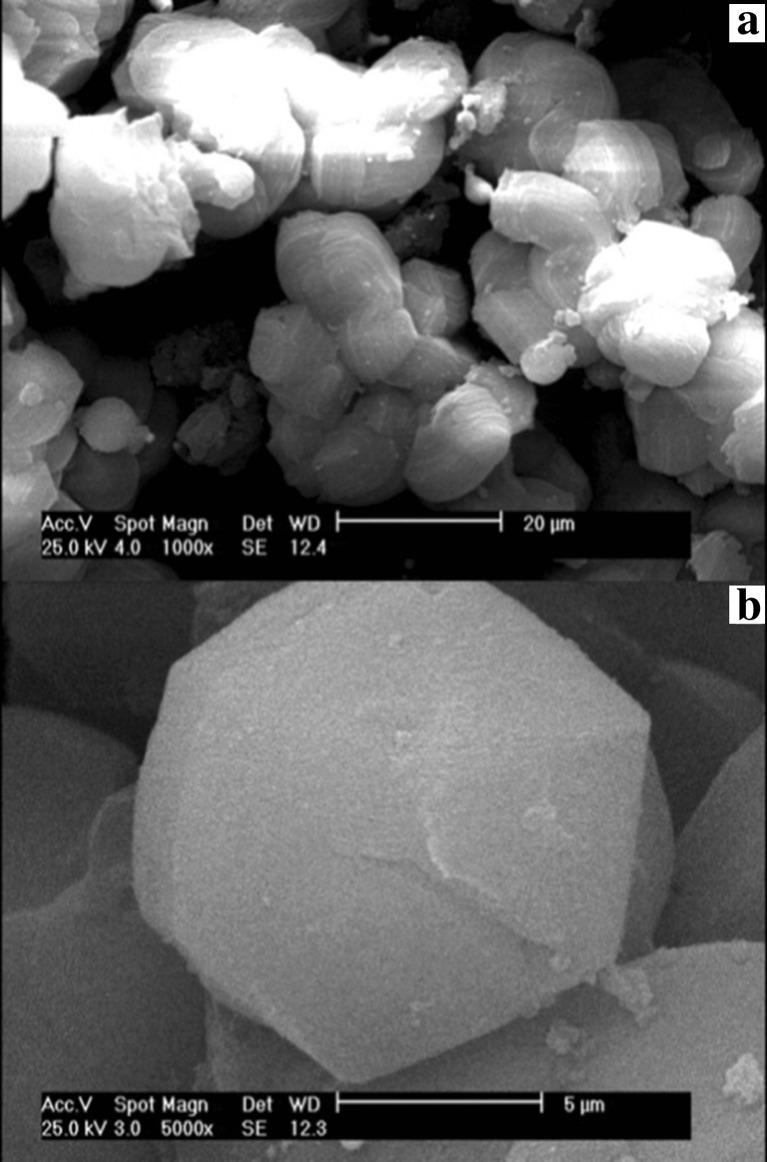
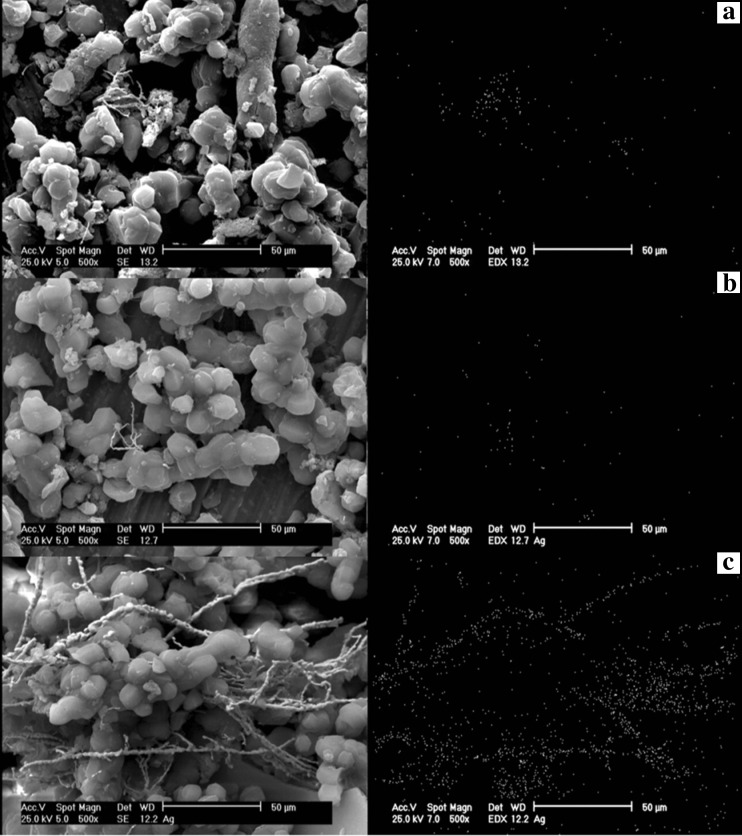
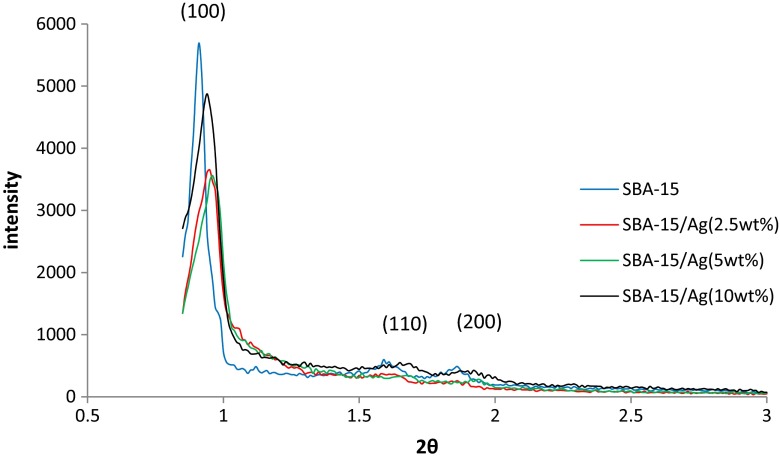
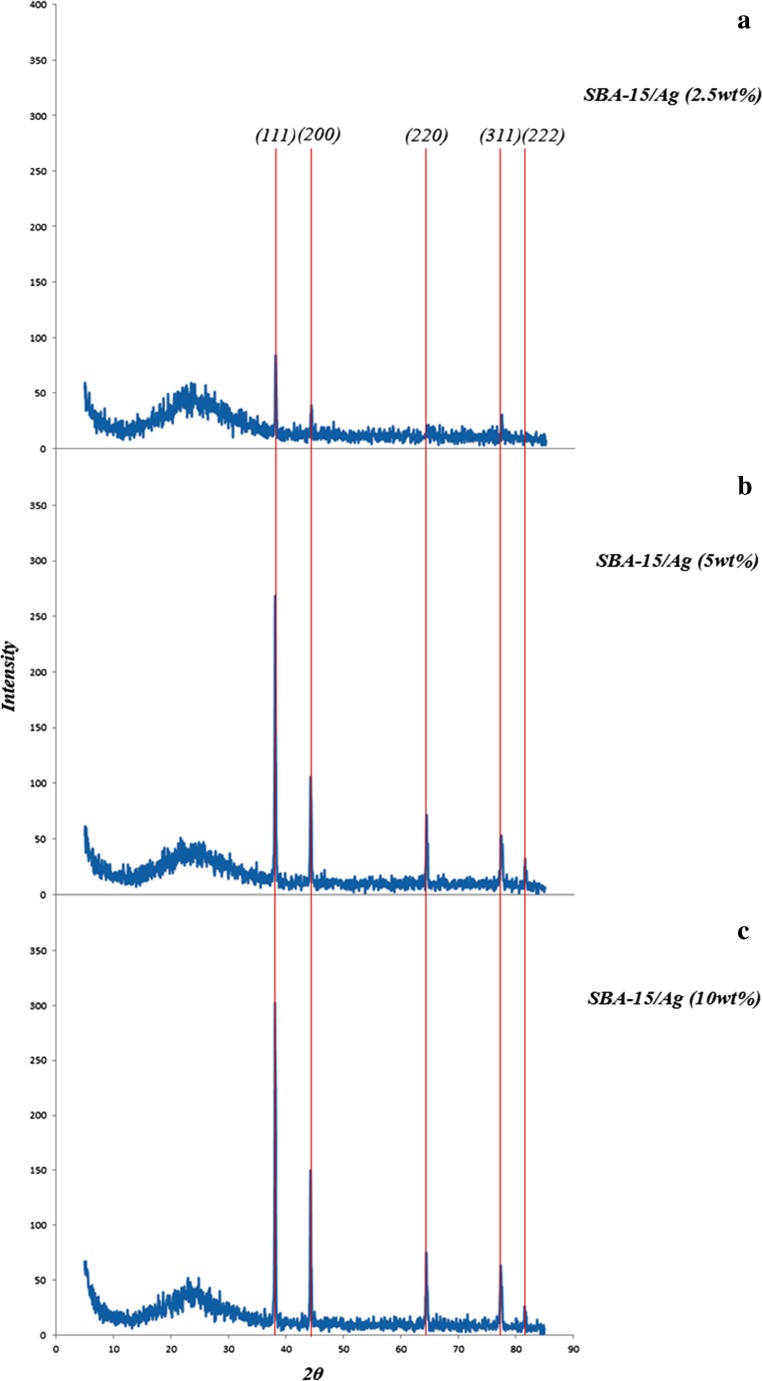
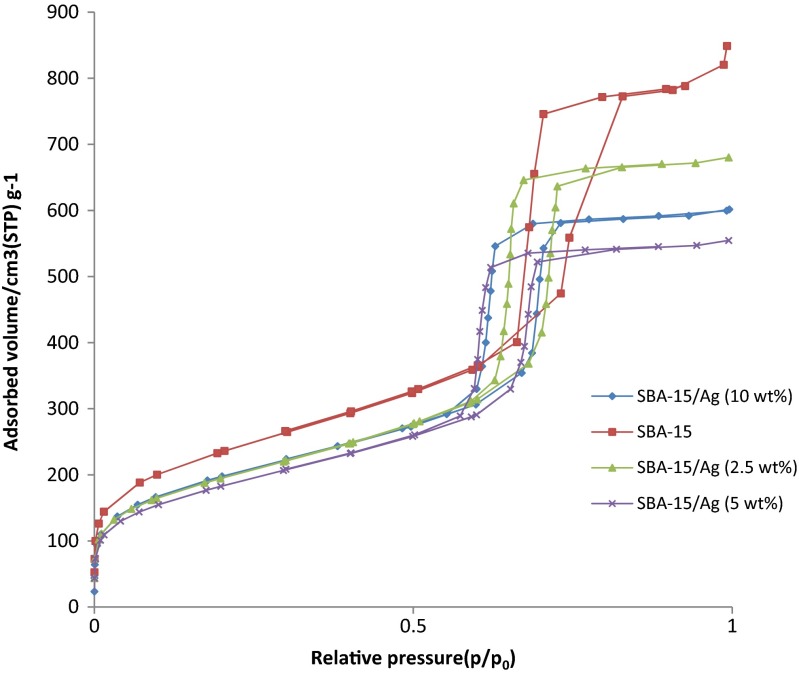
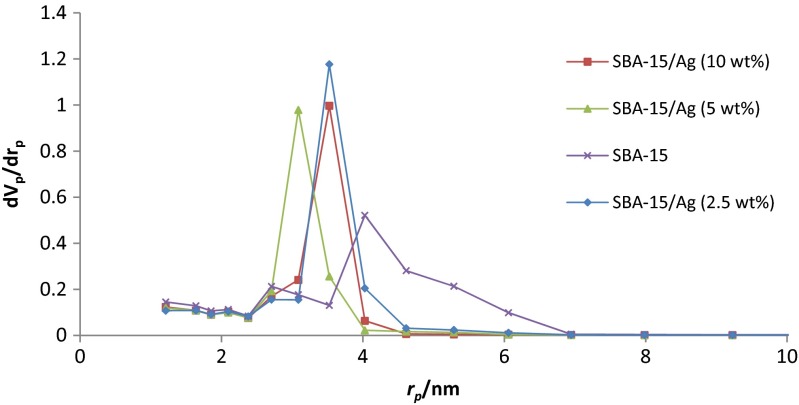
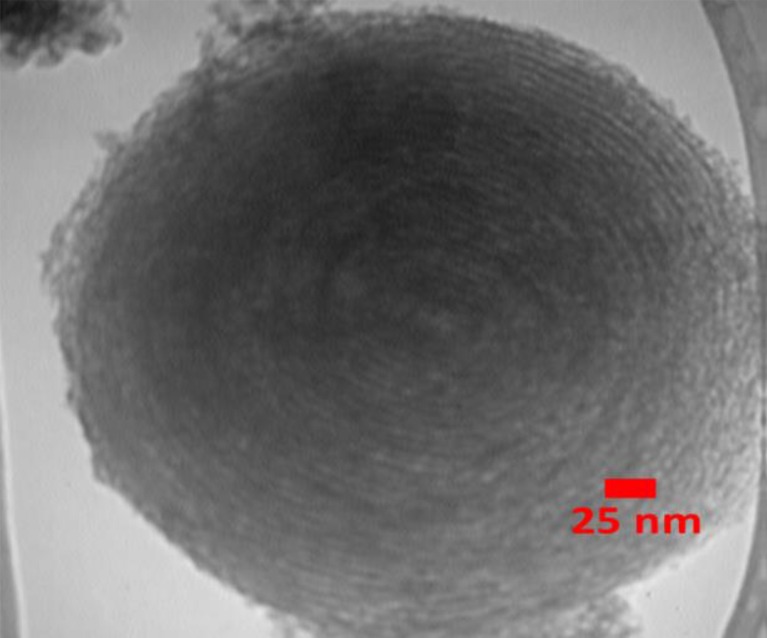
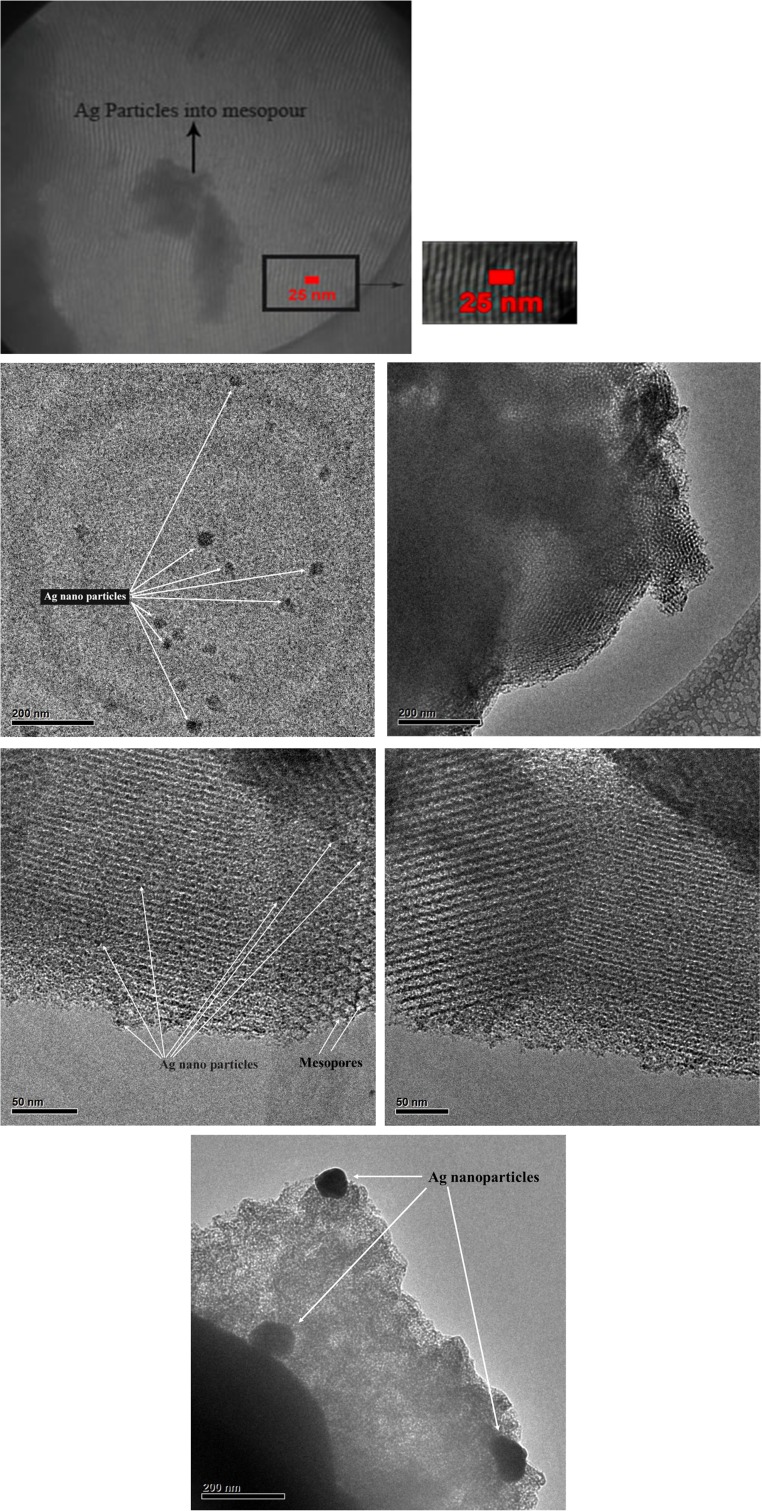
The SEM results of synthesized SBA-15 samples are presented in Fig. 1 with different magnifications. It can be noted that the particle morphology of synthesized SBA-15 is hexagonal in shape. As shown in Fig. 2, the morphology of SBA-15/Ag particles with different amounts of silver is spherical. In addition, the light points in Fig. 2 are related to silver particles that are formed inside and outside of the mesoporous materials, which are able to reach onto the surface. This is because more Ag nanoparticles are incorporated inside the mesoporous SBA-15 matrix and a few Ag nanoparticles are outside the mesoporous matrix, which are wire-like and spherical in structure. Furthermore, it is observed that by increasing the percentage of silver from 5 to 10 wt.%, more light points are observed than outside of the mesostructure. To confirm this result, WDS is given in Fig. 2 as well. WDS analysis helps us to see the distribution of silver in the samples. In Fig. 2, the dispersion of silver particles in the sample of SBA-15/Ag (5 wt.%) is shown, which is more uniform than the other samples. The low-angle and high-angle powder x-ray diffraction patterns of the heated mesoporous SBA-15 and SBA-15/Ag materials are shown in Figs. 3 and 4. The high-angle XRD pattern of SBA-15/Ag (2.5 wt.%), SBA-15/Ag (5 wt.%), and SBA-15/Ag (10 wt.%) confirmed the presence of silver nanoparticles within the amorphous silica matrix of SBA-15. From the XRD spectra, according to the (111), (200), (220), (311), and (222) lattice planes of the crystalline cubic phase of Ag, five intensive diffraction peaks were observed, respectively (Fig. 4), which confirmed the presence of silver in the samples. The broad peak in range of 2θ ≈ 15–30° is related to the amorphous silica. From the low-angle XRD pattern of all materials, it is observed that the sharp peak indexed with (100) peak and the other two weak peaks indexed with (110) and (200) peaks for all nanocomposites (Fig. 3). Therefore, by adding the silver to the SBA-15 matrix, the order of silica matrix is maintained. Furthermore, by increasing the silver amount to 10 wt.%, the intensity of main peak decreases that shows the order of silica structure. The intense peak (100) of SBA-15/Ag (2.5 wt.%), SBA-15/Ag (5 wt.%), and SBA-15/Ag (10 wt.%) shows d spacing of 9.64, 9.12, 9.06, and 9.34 nm, which were related to a large unit-cell parameter (a0 = 11.13, 10.53, 10.47, and 10.84 nm), respectively. In addition, the XRD patterns indicated that the materials prepared by this method were composed of both Ag and mesoporous silica with a 2D hexagonal (p6mm) structure (Figs. 5 and 6). Nitrogen adsorption–desorption isotherm analysis of pure SBA-15, SBA-15/Ag (2.5 wt.%), SBA-15/Ag (5 wt.%), and SBA-15/Ag (10 wt.%) showed type-IV isotherm with type-H1 hysteresis loop according to the IUPAC classification (Fig. 5), which was a characteristic of a special mesoporous material of SBA-15 with cylindrical pore channels as already reported [43]. The existence of a sharp sorption step in adsorption curves, close to a P/P0 value of 0.5, illustrates that the solid possesses a well-defined array of regular mesoporous structure. There is a deep variation of the molecular sieve between relative pressure P/P0 = 0.5 and 1.0, which shows the uniformity of the pore distribution due to the capillary condensation. This behavior confirms that the isotherm for the SBA-15/Ag is similar in shape to that of SBA-15, and the Ag nanoparticles are dispersed uniformly inside the pores. Furthermore, the slope of the curves happens at a very low relative, which indicates the microporous structures in SBA-15/Ag. The samples loaded with Ag adsorb lower nitrogen gas amounts than pure SBA-15, which presents the filling of pores by silver. The shape of hysteresis loops demonstrates that only some parts of micropore channels are closed by the silver nanoparticles and some of them are opened. The analysis of pores distribution in Fig. 6 shows that the silver nanoparticles are placed on the inner surfaces of the channels, which leads to a shift in pore size distribution to smaller pore diameters. This phenomenon is also associated with a decrease in BET surface area. Physical parameters of the synthesized materials by nitrogen gas adsorption analysis results are summarized in Table 1. According to Table 1, it can be noted that SBA-15 has a higher surface area and pore volume than other samples. The BET surface area of molecular sieve on SBA-15, SBA-15/Ag (2.5 wt.%), SBA-15/Ag (5 wt.%), and SBA-15/Ag (10 wt.%) is around 818, 689, 647, and 692 m2/g, respectively. The BJH mean pore diameter of SBA-15, SBA-15/Ag (2.5 wt.%), SBA-15/Ag (5 wt.%), and SBA-15/Ag (10 wt.%) is 4.03, 3.08, 3.53, and 3.53 nm, respectively. Figure 6 shows the pore distribution of molecular sieve. The results confirm that the pores of 4.03, 3.08, 3.53, and 3.53 nm diameter occupied most part of the pore volume of the SBA-15, SBA-15/Ag (2.5 wt.%), SBA-15/Ag (5 wt.%), and SBA-15/Ag (10 wt.%). Furthermore, it illustrates that pores of the samples are very uniform. These results suggest that the silver nanoparticles are located inside the host channels of pure SBA-15. However, increasing the Ag loading amount decreased the surface area and pore volume in the Ag-loaded samples [44]. Figure 7 represents TEM images of pure SBA-15 that confirm long-range order pore structure. The diameter of pores is estimated around 7 nm that is close to the pore diameter calculated by the BJH method. Figure 8 shows the TEM image of SBA-15/Ag (5 wt.%) sample, which shows the structure as orderly as SBA-15 structure. Moreover, darker regions in the images show the formation of silver nanoparticles within the channels without destruction of structure. Pore diameter and wall thickness are estimated to be about 7 and 2 nm, respectively. These results are acceptable according to BET results. The Ag nanoparticles are almost entirely confined inside the channels of host SBA-15, which confirms that the Ag nanoparticles grow along the pore channels rather than on the outer surface of the channels of host SBA-15. In addition, Fig. 8 indicates that Ag particles with a mean size of around 7 nm in diameter are dispersed in the amorphous silica with a nearly spherical shape. It was found that the mean size of Ag particles were around 10–100 nm and with the tendency to aggregate (Fig. 7). The Ag nanoparticles doped by porous matrix have a smaller size and more narrow size distribution than those formed outside of the pores. Furthermore, it has been studied that when Ag nanoparticles are dispersed inside the SBA-15 matrix, Ag cations are released when the functionalized SBA-15 matrix interacts with an aqueous solution. These Ag cations are responsible for the adsorption of mercury ions from wastewater. The mechanism of the adsorption of Ag+ ions contains the binding of Ag+ ions to the hydrated mercury ions from wastewater or an aqueous solution [45]. At pH ≈ 7, Ag+ ions interact with oxygen atoms of –OH groups of SBA-15 adsorbent. This behavior is related to the stronger interactions between metal ions and –OH groups of SBA-15 matrix. Therefore, the functionalized SBA-15/Ag can interact with Hg2+ ions in water solutions.
Fig. 1.
Scanning electron micrographs of SBA-15 material: a magnification ×1000, b magnification ×5000
Fig. 2.
Scanning electron microscope images with magnification ×500 with a WDS analysis: a SBA-15/Ag (2.5 wt.%), b SBA-15/Ag (5 wt.%), c SBA-15/Ag (10 wt.%)
Fig. 3.
Low angle powder XRD patterns of the calcined Ag/silica mesoporous materials
Fig. 4.
The high-angle x-ray diffraction pattern of Ag/silica mesoporous materials. a SBA-15/Ag (2.5 wt.%), b SBA-15/Ag (5 wt.%), c SBA-15/Ag (10 wt.%)
Fig. 5.
N2 adsorption–desorption isotherms of SBA-15, SBA-15/Ag (2.5 wt.%), SBA-15/Ag (5 wt.%), and SBA-15/Ag (10 wt.%)
Fig. 6.
The pore size distribution of SBA-15, SBA-15/Ag (2.5 wt.%), SBA-15/Ag (5 wt.%), and SBA-15/Ag (10 wt.%)
Table 1.
Physical parameters of the materials obtained by means of N2 adsorption–desorption analysis
| Samples | S BET a (m2/g) | V p b (cm3/g) | Pore size (nm) |
|---|---|---|---|
| SBA-15 | 818.80 | 1.29 | 6.34 |
| SBA-15/Ag (2.5 wt.%) | 689.90 | 1.05 | 6.09 |
| SBA-15/Ag (5 wt.%) | 647.97 | 0.86 | 5.29 |
| SBA-15/Ag (10 wt.%) | 692.55 | 0.93 | 5.37 |
aBET specific surface area
bTotal pore volume deduced from nitrogen adsorbed volumes measured at the beginning of the plateau after the capillary condensation step
Fig. 7.
TEM images of pure SBA-15
Fig. 8.
TEM (above images) and HRTEM (below images) of SBA-15/Ag (5 wt.%) sample
Effect of pH
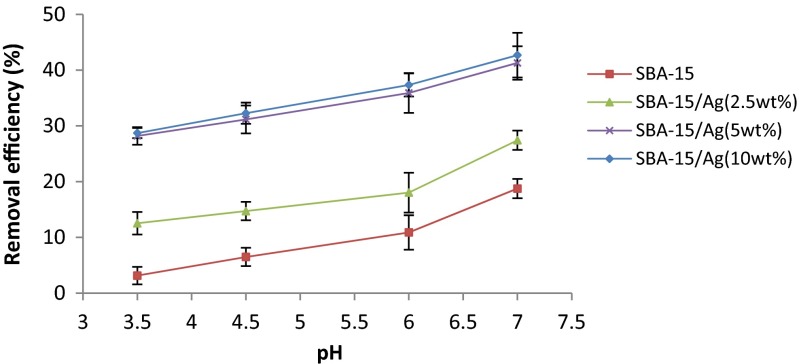
The pH factor is one of the most important factors in the process of mercury adsorption from water solution that significantly influences the surface charge, the protonation degree of the adsorbent, and the conversion of mercury compounds. Hg (II) ion separation from water solution is related to the pH value of the solution. The effect of pH on mercury ion adsorption by the mesoporous SBA-15/Ag is given in Fig. 9. In this study, the amount of adsorbent (0.05 g), stirring rate (220 rpm), initial concentration (100 ppm), and contact time (5 min) were considered constant for all the samples. The tests are done in the pH range of 3.5 to 7. The pH of each solution was set by the addition of 1 M HCl and NaOH. It is observed that the removal efficiency of Hg (II) increases with increasing of pH solution up to 7. Figure 9 shows the maximum amount of Hg ion absorption that occurs at a pH of 7. Furthermore, at a lower pH of 6, mercury ions are at the free form of Hg2+, and the positively charged hydrogen ions compete with the Hg2+ for binding sites on the surface of the SAB-15/Ag adsorbent. If the surface of the SAB-15/Ag adsorbent is protonated, the electrostatic interaction will decrease. This behavior is not favorable for Hg2+ reaction with the surface of the SAB-15/Ag. The surface charge is an important factor for the adsorption of metal ions and very much depends on the pH of the solution. In fact, since the H+ and OH− ions are strongly adsorbed on the surface of SBA-15/Ag, they can change the surface charge of SBA-15/Ag. At low pH, the amounts of H+ ions are greater. Therefore, the SBA-15/Ag surface charge can change to positive and the competition between metal ions adsorbed on the adsorbent surface (SBA-15/Ag) and the repulsive force of Hg2+ ions with positive charge causes the reduction of absorption by the SBA-15/Ag. The increase of metal removal with the increase of pH up to 7 can be explained on the basis of a decrease in competition between proton and metal cation for the same functional groups. Thus, a decrease in positive surface charge induces a lower electrostatic repulsion between the surface and the metal ions. As a result, a decrease in adsorption at higher pH (pH more than 7) due to the formation of soluble hydroxyl complexes occurs [46]. Finally, the test was not carried out at pH more than 7. Because the precipitates were formed in the solution, it was impossible to continue the experiment. In addition, the hexagonal structure of SBA-15/Ag is damaged above pH 8, which decreases the amount of Hg (II) ion adsorption [47]. As a result, the optimum pH in this study was considered equal to 7.
Fig. 9.
Effect of pH on removal of mercury. Adsorber amount equal to 0.05 g, t = 5 min, stirring rate = 220 rpm, and initial concentration = 100 ppm
Effect of contact time
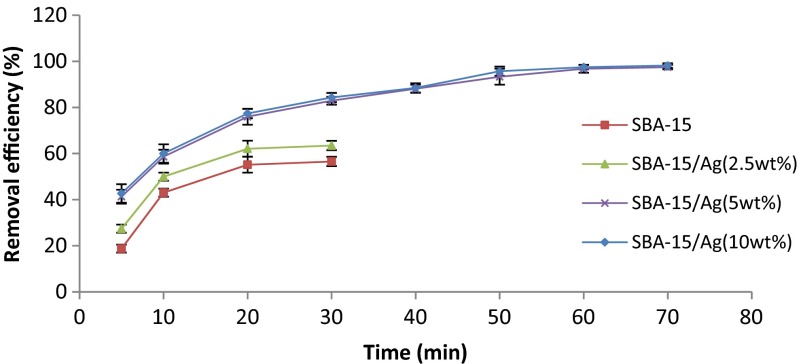
The adsorption of Hg (II) ions by SBA-15 and Ag/SBA-15 adsorbents based on contact time is illustrated in Fig. 10. It can be seen that the amount of adsorbed Hg (II) ions increases with contact time up to 70 min for Ag/SBA-15 adsorbent with 2.5, 5, and 10 wt.% of silver and contact time up to 20 min, and after 20 min the maximum removal of Hg ions is obtained and remained in a constant amount. On the other hand, for all the samples, the amount of adsorbed mercury ions increases with an increase in contact time in the initial stages (0–20 min) and then has a gradual enhancement to reach to approximately up to 70 min. This increase is due to the probability of further collisions of mercury ions with silver particles into the pores and on the surface of pores in the long time contact. It can be seen that a further increase in contact time beyond 20 min has a negligible effect on the amount of ion absorption. The equilibrium time was found to be independent on the initial concentration. Based on these results, the stirring time was adjusted to 20 min for the rest of the batch experiments to make sure that the equilibrium was reached. In addition, it can also be the result when initially all the active sites on the surface of adsorbents were empty and mercury ion concentration gradient was relatively high. Thus, by increasing the contact time, the extent of ion uptake decreases according to the reduction rate of the unfilled sites on the adsorbent surface remarkably.
Fig. 10.
Effect of contact time on percent removal of mercury. Adsorber amount equal to 0.05 g, pH = 7, stirring rate = 220 rpm, and initial concentration = 100 ppm
Effect of adsorbent dose
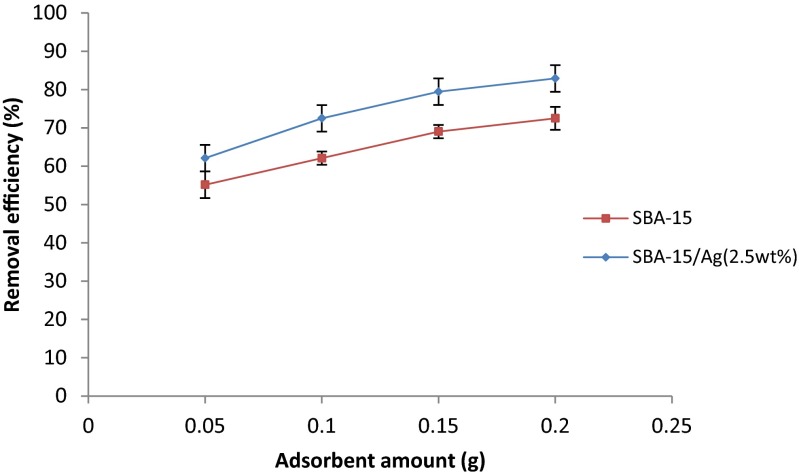
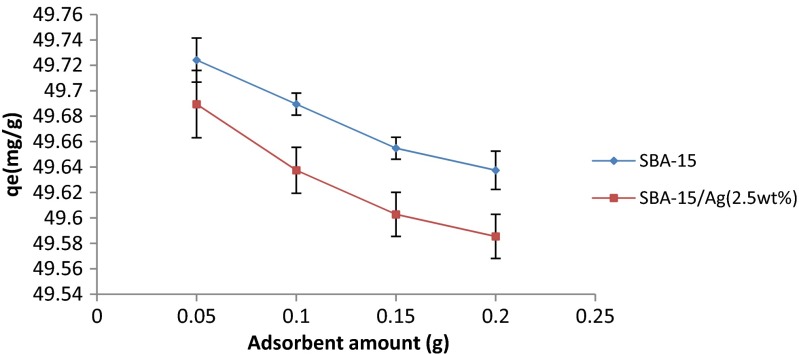
In Fig. 11, the effect of adsorbent amount on the adsorption of mercury ions from water is observed. In this experiment, pH = 7, initial concentration of 100 ppm, optimum time of 20 min, and stirring rate of 220 rpm are selected. Increasing the number of available adsorbing sites leads to the increase in the efficiency of the adsorbent for the removal of mercury ions. Thus, in high adsorbent dose, the concentration of mercury in solution reaches a minimum amount. As seen in Fig. 12, by increasing the amount of adsorbent, the adsorption capacity per unit mass decreases because active sites are not saturated in the adsorption process. The adsorbent amount on the adsorption of mercury ions from water was calculated by reverse titration. In Fig. 12, it is observed that there are different error bars because in reverse titration, there is human error. Thus, it has no constant accuracy (Fig. 12).
Fig. 11.
Effect of adsorbent dose on percent removal of mercury, t = 5 min, pH = 7, stirring rate = 220 rpm, and initial concentration = 100 ppm
Fig. 12.
The effect of adsorbent dose on amount of mercury adsorption, t = 5 min, pH = 7, stirring rate = 220 rpm, and initial concentration = 100 ppm
Effect of stirring rate
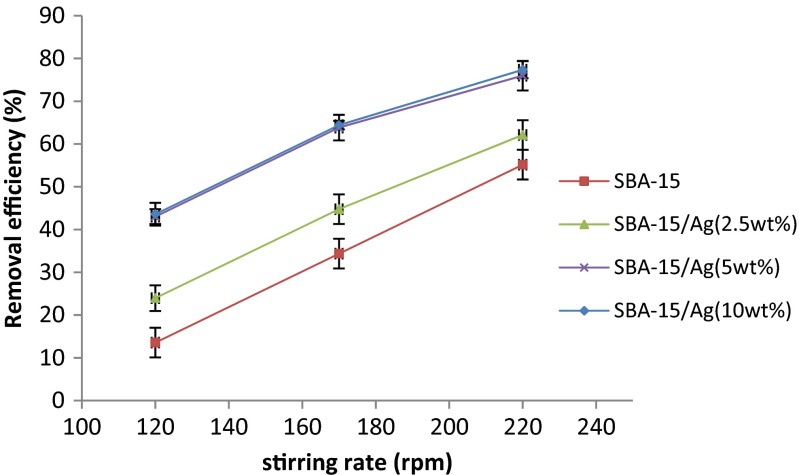
The results of the experiments on the effect of stirring speed on the adsorption rate for synthesized samples are observed in Fig. 13. In this experiment, pH = 7, the optimal time (20 min), initial concentration of Hg ions (100 ppm), and adsorbent dose (0.05 g) are considered constant for all the experiments. It is observed that when the stirring speed is increased from 120 to 220 rpm, the amount of adsorbed mercury ions using SBA-15/Ag silica-based structures increases. The reason can be related to the increase in the stirring rate and the number of available adsorption sites. Furthermore, high stirring rate causes the agglomerated powders to convert to dispersed powders. Therefore, it makes more active sites in the adsorbent to be available for adsorption of the mercury ions.
Fig. 13.
The effect of stirring rate on percent removal of mercury. Adsorber amount equal to 0.05 g, t = 5 min, pH = 7, and initial concentration = 100 ppm
Effect of initial mercury concentration
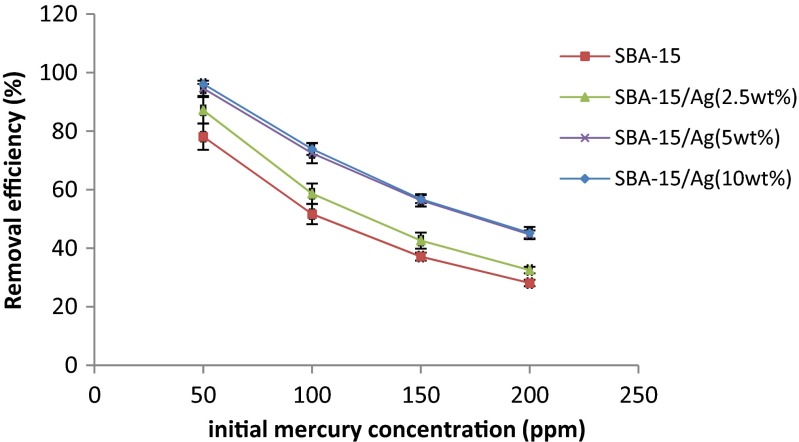
The initial concentration of mercury ion adsorption on silica-based structures in the range of 50 to 200 mg/L was investigated. The results are given in Table 2. In this experiment, the optimum time (20 min), stirring speed (220 rpm), and the amount of adsorbent (0.05 g) are constant for all the batches. According to the results, it was found that by increasing the initial concentration of mercury ions, adsorption decreases. At low concentrations, more effective adsorption sites are available for mercury ion adsorption, but in higher concentrations, the number of mercury ions is far greater than adsorption places. Therefore, it can be seen in Table 2 that the adsorption of mercury depends on its initial concentration, and when the initial concentration increases, the adsorption decreases. By increasing the initial concentration of mercury ions, the competition of mercury ions for reaction with the adsorbent surface becomes more and more. As a result, more active sites of adsorbent are saturated. Additionally, the number of collisions between mercury ions and adsorbent becomes greater, which increases the adsorption process [48]. This study on the variation of initial mercury concentration at a fixed amount of adsorbent (0.05 g) per 25 mL solution was carried out at room temperature (27 °C). The effect of initial mercury concentration on the amount of mercury adsorption is shown in Fig. 14. It is clear that there is a very mild increase in the adsorption when increasing the mercury concentration, especially in the lower concentration range, indicating high affinity performance [49]. The amount of mercury adsorption is calculated by:
| 1 |
Table 2.
Adsorbed amounts per unit weight for Hg (II) removal at 50, 100, 150, and 200 mg/L initial concentrations and 20 min time
| Samples | q e (mg/g) | |||
|---|---|---|---|---|
| 50 ppm | 100 ppm | 150 ppm | 200 ppm | |
| SBA-15 | 19.51 | 25.80 | 27.80 | 28.14 |
| SBA-15/Ag (2.5 wt.%) | 22.91 | 31.05 | 31.99 | 32.19 |
| SBA-15/Ag (5 wt.%) | 23.66 | 40.59 | 42.26 | 42.82 |
| SBA-15/Ag (10 wt.%) | 24.01 | 40.88 | 42.59 | 42.89 |
Fig. 14.
The effect of initial concentration on percent removal of mercury. Adsorber amount equal to 0.05 g, t = 5 min, pH = 7, and stirring rate = 220 rpm
where q (mg/g) is the amount of ion adsorption by the adsorbent phase, C0 and Ce are the initial and equilibrium concentrations of mercury ion (mg/L) in the solution, V is the volume of solution (L), and W is the weight of the adsorbent (g) in the mixture. Adsorbed amounts per unit weight for Hg (II) removal at 50, 100, 150, and 200 mg/L initial concentrations and 20 min time are listed in Table 2.
Comparison with other studies
In the present work, the best adsorption capacity of SBA-15, SBA-15/Ag (2.5 wt.%), SBA-15/Ag (5 wt.%), and SBA-15/Ag (10 wt.%) materials was determined as 25.80, 31.05, 40.59, and 40.88 mg/g for Hg2+, respectively. For comparison, the adsorption capacities for Hg2+ showed by different common adsorbents (reported in Zhang et al. 2013, Wang et al. 2011, Teng et al. 2011, Antochshuck et al. 2003, Olkhovyk et al. 2005, Aguado et al. 2005, Liu et al. 2010, Lee et al. 2001, Puanngam et al. 2006, and Showkat et al. 2007) were equal to 26.5 mg/g (SiO2/polyacrylamide (–NH2)), 59.2 mg/g (3-mercaptopropyl-functionalized MCM-41 (–SH)), 427 mg/g (mesoporous thioether-functionalized polyvinylpyrrolidone (PVP)/SiO2 composite (–S–)), 1000 mg/g (1-benzoyl-3-propylthiourea-functionalized MCM-41 (=N, =O, –NH–, and –NH2 groups)), 1700 mg/g (2,5-dimercapto-1,3,4-thiadiazole (–SH)), 288 mg/g (3-mercaptopropyl-functionalized SBA-15 (–SH)), 12.09 mg/g (silane and 9-(chloromethyl) anthracene (–SH)), 151 mg/g (3-aminopropyl and 3-mercaptopropyl bi-functionalized mesoporous silica (–SH)), 70.2 mg/g (chemically modified MCM-41 (–NH– and –NH2)), and 92.3 mg/g (N-propyl aniline-functionalized MCM-41 (–NH–)). It can be noted that the adsorption efficiency of 2,5-dimercapto-1,3,4-thiadiazole (–SH) > 1-benzoyl-3-propylthiourea-functionalized MCM-41(=N, =O, –NH–, and –NH2 groups) > mesoporous thioether-functionalized polyvinylpyrrolidone (PVP)/SiO2 composite (–S–) > 3-mercaptopropyl-functionalized SBA-15 (−SH) > 3-aminopropyl and 3-mercaptopropyl bi-functionalized mesoporous silica (–SH) > N-propyl aniline-functionalized MCM-41 (–NH–) > chemically modified MCM-41 (–NH– and –NH2) > chemically modified MCM-41 (–NH– and –NH2) > 3-mercaptopropyl-functionalized MCM-41 (–SH) > SBA-15/Ag (10 wt.%) > SBA-15/Ag (5 wt.%) > SBA-15/Ag (2.5 wt.%) > SBA-15 > silane and 9-(chloromethyl) anthracene (−SH) > SiO2/polyacrylamide (–NH2). Furthermore, if we consider the particular properties of the SBA-15 matrix (excellent textural stability, high hydrophilicity, their surface silanol groups can be easily functionalized by using various organic and inorganic components). Therefore, it can be deduced that the adsorbents based on modified SBA-15 mesoporous silica are interesting candidates for applications in Hg2+ metal ion removal from wastewater. It can be noted that mercury adsorption with the incorporation of thio-groups to the mesostructured silica materials increases because sulfur has a strong affinity toward mercury. In comparison with other mesostructured silica materials, SBA-15 matrix functionalized with silver has thicker pore walls, longer pore diameter ranging from 5 to 30 nm, and higher pore volumes. Then it can adsorb mercury from water solution. This is because SBA-15/Ag is a non-toxic adsorbent and antibacterial material and can be used to remove mercury ions from water solution for the preparation of drinking water. On the other hand, SBA-15/Ag is biocompatible. This is a very important factor for biologists despite the low adsorption capacity for removing mercury ions in comparing with other adsorbents which may be toxic partially due to the incorporation of the organic groups inside the adsorbent matrix. Another advantage of SBA-15/Ag is the higher affinity performance in the lower initial concentration of Hg (II) ions.
Adsorption isotherm
The equilibrium adsorption isotherms are one of the most useful data to recognize the mechanism of the adsorption. Several isotherm equations are available, and two important isotherms are selected in this study, which are namely the Freundlich and Langmuir isotherms [50].
Freundlich model
The Freundlich model is used to explain the adsorption details for the heterogeneous surface and the interactions between the adsorbed compounds. The model of heterogeneous solids accepts a definite distribution of adsorption sites on the surface. The exponential and linear forms of Freundlich model are given in Eqs. (2) and (3)–(4), respectively [51].
| 2 |
| 3 |
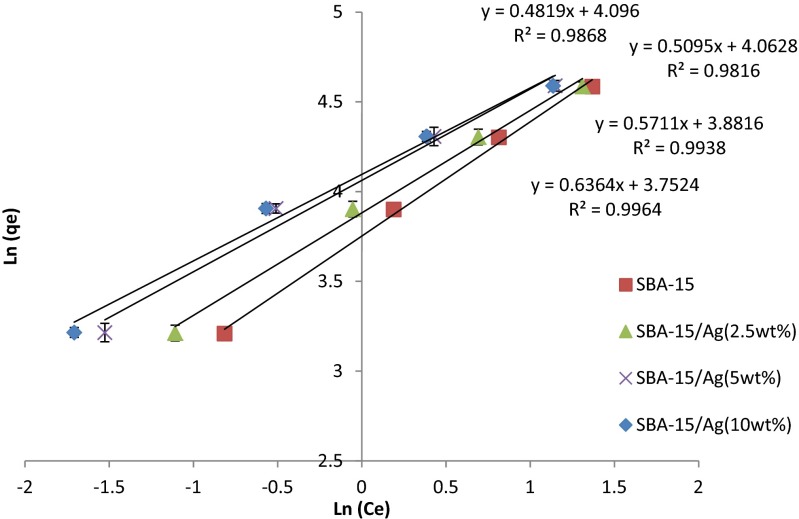
where and n are Freundlich constants that are related to adsorption capacity and adsorption intensity, is the equilibrium concentration of mercury ions (mg/L), and (mg/g) is the amount of ion adsorption by the adsorbent phase. Furthermore, 1/n is a function of the strength of the adsorption. The plot of the adsorption of Hg (II) on SBA-15/Ag is shown in Fig. 15. It can be seen that the model gives a good fit to the experimental data with the correlation coefficients listed in Table 3. Usually, for a good adsorbent, n is between 1 and 10 (1 < n < 10). A smaller value of n indicates better adsorption and formation of a relatively strong bond between adsorbate and adsorbent. The values of n >1 show favorable adsorption process. If n is equal to 1, the ratio between the two phases are not related to the concentration. The value of 1/n < 1 shows a normal adsorption, when 1/n > 1 shows a cooperative adsorption. Therefore, in this study, the value of 1/n is 0.6, 0.6, 0.5, and 0.5 indicating a favorable adsorption process of Hg (II) on SBA-15/Ag, SBA-15/Ag (2.5 %), SBA-15/Ag (5 %), and SBA-15/Ag (10 %). The value of R2 is 0.99, 0.99, 0.98, and 0.98 and Kf is 42, 48, 58, and 58 mg/g adsorption capacity of SBA-15/Ag, SBA-15/Ag (2.5 %), SBA-15/Ag (5 %), and SBA-15/Ag (10 %).
Fig. 15.
Freundlich plot of Hg (II)
Table 3.
Parameters of the kinetic models for adsorption of Hg (II) on adsorbents
| samples | Model | Parameters | R 2 |
|---|---|---|---|
| SBA-15 | Langmuir |
q
m=156.25 b = 0.421 |
0.9967 |
| Freundlich |
K
f = 42.62 n = 1.57 |
0.9964 | |
| SBA-15/Ag (2.5 wt.%) | Langmuir |
q
m=140.85 b = 0.607 |
0.9961 |
| Freundlich |
K
f=48.50 n = 1.75 |
0.9938 | |
| SBA-15/Ag (5 wt.%) | Langmuir |
q
m=126.85 b = 1.068 |
0.9953 |
| Freundlich |
K
f = 58.14 n = 1.96 |
0.9816 | |
| SBA-15/Ag (10 wt.%) | Langmuir |
q
m=121.95 b = 1.242 |
0.9937 |
| Freundlich |
K
f = 58.14 n = 1.96 |
0.9864 |
Langmuir model
The adsorption kinetics are useful for adsorption studies to predict the rate at which Hg (II) is removed from aqueous solutions and to provide valuable data for understanding the mechanism of adsorption and the reaction pathways. In this work, the Langmuir isotherm model was used to investigate the mechanisms of Hg (II) ion adsorption on SBA-15/Ag. The conformity between experimental results and the model predicted values can be expressed by the correlation coefficients (R2). Relatively high correlation coefficients indicated that the model successfully describes the kinetics of the adsorption. The Langmuir adsorption isotherm is given by the following equation [52]:
| 4 |
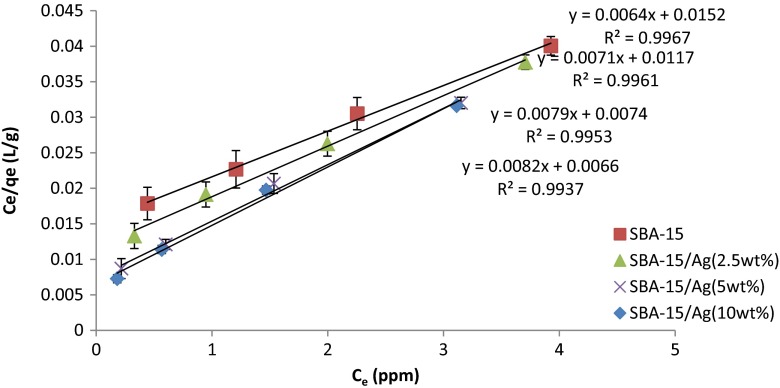
In the Langmuir isotherm model, qm (mg/g) is the maximum theoretical monolayer adsorption capacity, amount of Hg (II) adsorption by absorbent, Ce is the equilibrium concentration (mg/L = ppm) of Hg (II) in solution, qe is the amount of Hg (II) ions adsorbed (mg/g) at equilibrium, and b (L/mg) is the Langmuir equilibrium constant (L/mg) related to the affinity of adsorption sites. When is plotted via Ce, a straight line with the slope of is obtained (Fig. 16), which indicates that the adsorption of mercury follows the Langmuir isotherm. In the present work, the values of Langmuir constants qm and b were computed from the slope and intercept of the plot and are listed in Table 3. Table 3 shows the correlation coefficient (R2). From the data of our work, the adsorption capacity qm was determined by linear Langmuir equation to be 156.25, 140.85, 126.58, and 121.95 mg/g of Hg (II) on SBA-15, SBA-15/Ag (2.5 wt.%), SBA-15/Ag (5 wt.%), and SBA-15/Ag (10 wt.%), respectively, and b of 0.421, 0.607, 1.068, and 1.242 L/mg, respectively, with the R2 value of 0.99 showing that the adsorption data fitted well to the isotherm model. We find that the correlation coefficients for all concentrations are R2 >0.99), which have been listed in Table 3. Therefore, there is a fairly good fit to the experimental data, the Langmuir adsorption process follows the Langmuir isotherm model, and Hg (II) ions were adsorbed on the surface of SBA-15/Ag via chemical and physical interaction. Furthermore, the Freundlich and Langmuir constants were obtained from the plots, and their values are given in Table 3 for comparison. It is seen that the Langmuir model is better than the Freundlich model. It should be noted that RL value indicates the type of isotherm. RL values between 0 and 1 suggest favorable adsorption [50]:
| 5 |
Fig. 16.
Langmuir plot of Hg (II)
where b is the Langmuir constant and C0 is the initial metal-ion concentration (mg/L). RL values of mercury presented in Table 4 are between 0 and 1 for all concentrations at 27 °C, indicating favorable adsorption. RL is a characteristic parameter of Langmuir isotherm that can be shown in terms of dimensionless equilibrium parameter. Furthermore, RL is known as separation factor. The value of RL indicates the kind of isotherm and the nature of the adsorption process. It shows the adsorption nature to be either unfavorable (RL > 1), linear (RL = 1), favorable (0 < RL < 1), and irreversible (RL is zero). From the data summarized in Table 4, it shows that the RL is between 0 and 1 and that the adsorption nature is favorable.
Table 4.
Fitted isotherm models for the adsorption of Hg (II) on adsorbents
| Samples | R L | |||
|---|---|---|---|---|
| 50 ppm | 100 ppm | 150 ppm | 200 ppm | |
| SBA-15 | 0.0450 | 0.0319 | 0.0184 | 0.0159 |
| SBA-15/Ag (2.5 wt.%) | 0.0232 | 0.0162 | 0.0093 | 0.0080 |
| SBA-15/Ag (5 wt.%) | 0.0156 | 0.0109 | 0.0062 | 0.0053 |
| SBA-15/Ag (10 wt.%) | 0.0117 | 0.0082 | 0.0047 | 0.0040 |
Using AHP and TOPSIS method to select the optimal condition for Hg removal
AHP method
Analytical Hierarchy Process or AHP is one of the most efficient techniques used to determine the optimal condition for Hg removal. It was first proposed in 1980 by Thomas L. Hour. It is based on paired comparisons and is a useful method for the analysis of various types of rational decision-making positions in various [53]. AHP is mainly used to solve multi-criteria decision-making positions containing uncertainty. Due to the ease and simplicity of its use and its flexibility, this method is widely used [54]. Here, we use this technique to obtain the weights of the criteria and then continue with TOPSIS method to choose the best candidate. In Table 5, the decision matrix is given for all the samples according to the criteria of the surface area, the amount of adsorption, the pore volume, and the cost of synthesis. As it can be seen, the cost criterion was expressed as a qualitative measure. Table 6 has been used to determine its quantitative values. After that, the final Decision Matrix is given in Table 7. Then, to find the relative weight, paired comparisons are carried out. In Table 8, importance scales are specified by numbers from 1 to 9 according to the paired comparisons matrix similar to the matrix given in the table below (Table 9).
Table 5.
Decision matrix for candidate materials
| Candidate materials | Material selection criteria | |||
|---|---|---|---|---|
| S BET a | ABSb | V P c | C d | |
| SBA-15 | 818.8 | 55.16 | 1.29 | Low |
| SBA-15/Ag (2.5 wt.%) | 689.9 | 76 | 1.05 | Average |
| SBA-15/Ag (5 wt.%) | 647.97 | 98.42 | 0.86 | High |
| SBA-15/Ag (10 wt.%) | 692.55 | 98.5 | 0.93 | Very high |
aBET specific surface area
bAmount of absorption
cTotal pore volume deduced from nitrogen adsorbed volumes measured at the beginning of the plateau after the capillary condensation step
dCost
Table 6.
Value of material selection attributes into fuzzy scores [28]
| Linguistic term | Crisp score |
|---|---|
| Exceptionally low | 0.045 |
| Extremely low | 0.135 |
| Very low | 0.225 |
| Low | 0.335 |
| Below average | 0.41 |
| Average | 0.5 |
| Above average | 0.59 |
| High | 0.665 |
| Very high | 0.745 |
| Extremely high | 0.865 |
| Exceptionally high | 0.955 |
Table 7.
Decision matrix for candidate materials
| Candidate materials | Material selection criteria | |||
|---|---|---|---|---|
| S BET a | ABSb | V P c | C d | |
| SBA-15 | 818.8 | 55.16 | 1.29 | 0.335 |
| SBA-15/Ag (2.5 wt.%) | 689.9 | 76 | 1.05 | 0.5 |
| SBA-15/Ag (5 wt.%) | 647.97 | 98.42 | 0.86 | 0.665 |
| SBA-15/Ag (10 wt.%) | 692.55 | 98.5 | 0.93 | 0.745 |
aBET specific surface area
bAmount of absorption
cTotal pore volume deduced from nitrogen adsorbed volumes measured at the beginning of the plateau after the capillary condensation step
dCost
Table 8.
Nine-point intensity of importance scale
| Description | Relative importance (a ij) |
|---|---|
| Equal importance | 1 |
| Moderate importance | 3 |
| Strong importance | 5 |
| Very strong importance | 7 |
| Absolute importance | 9 |
| Intermediate values | 2, 4, 6, 8 |
Table 9.
Fuzzy pairwise comparison matrix
| Criteria | S BET a | ABSb | V P c | C d |
|---|---|---|---|---|
| BET | 1 | 1/3 | 1 | 1/3 |
| ABS | 3 | 1 | 5 | 3 |
| V P | 1 | 1/5 | 1 | 1/3 |
| C | 3 | 1/3 | 3 | 1 |
aBET specific surface area
bAmount of absorption
cTotal pore volume deduced from nitrogen adsorbed volumes measured at the beginning of the plateau after the capillary condensation step
dCost
The relative normalized weight (Wi) of each factor is obtained by calculating the i-th row geometric mean and the rows normalized geometric mean from the comparison matrix (Eqs. (6) and (7)) [55–63]:
| 6 |
| 7 |
According to the calculations, the relative weight of each factor is given in Table 10.
Table 10.
Weight of each criterion obtained with AHP
| Criteria | GM | W | X = A·W | CV |
|---|---|---|---|---|
| BET | 0.577 | 0.108 | 0.468 | 4.33 |
| ABS | 2.94 | 0.551 | 2.086 | 3.78 |
| V P | 0.508 | 0.0952 | 0.395 | 4.15 |
| C | 1.31 | 0.245 | 1.038 | 4.23 |
TOPSIS method
TOPSIS is defined as “a technique for ordering preferences with regard to its resemblance to the ideal solution.” This means that you should choose the shortest distance from the ideal solution, yet far from the negative ideal solution. TOPSIS algorithm is a very technical and strong decision-making method for prioritizing options through simulating the ideal solution. The selected option from this method should have the shortest distance from the positive ideal and the farthest distance from the negative ideal. TOPSIS process includes the following steps [55–63]. Decision matrix with the weight of the found factors in “AHP method” section is given in Table 11. The first step is normalizing the decision matrix. This process tries to omit the scale from the decision matrix. Thus, each of the measurement values corresponding to the index is divided. Each element rij of the normalized decision matrix r of Eq. (8) is calculated as follows:
| 8 |
Table 11.
Decision matrix for candidate materials
| Candidate materials | Material selection criteria | |||
|---|---|---|---|---|
| S BET a | ABSb | V P c | C d | |
| SBA-15 | 818.80 | 55.16 | 1.29 | 0.335 |
| SBA-15/Ag (2.5 wt.%) | 689.90 | 76 | 1.05 | 0.5 |
| SBA-15/Ag (5 wt.%) | 647.97 | 98.42 | 0.86 | 0.665 |
| SBA-15/Ag (10 wt.%) | 692.55 | 98.5 | 0.93 | 0.745 |
| Weight | 0.108 | 0.551 | 0.0952 | 0.245 |
aBET specific surface area
bAmount of absorption
cTotal pore volume deduced from nitrogen adsorbed volumes measured at the beginning of the plateau after the capillary condensation step
dCost
In the second step, the obtained weight in above paragraph is assigned to the normalized decision matrix (Eq. (9).
| 9 |
Here, wj is the j-th criterion weight.
In the third step, the ideal (A+) and non-ideal (A−) options are determined by the relations (10) and (11). For the price index, against the other criteria, the ideal is minimal because lower synthesis costs are better.
| 10 |
| 11 |
In the fourth step, the distances of each alternative from the ideal and non-ideal options are calculated respectively by Eqs. (12) and (13):
| 12 |
| 13 |
In the fifth step, the relative distance from the ideal solution according to Eq. (14) is calculated as:
| 14 |
Finally, the best option with the highest value (Ri) is selected as the final option for the shortest distance from the ideal value [63]. Final results of TOPSIS are presented in Table 12. It eventually becomes clear that SBA-15/Ag (5 wt.%) sample has a minimum distance from the ideal (Ri = 0.773) and is the best sample according to the criteria of the surface area, optimal adsorption, pore volume, and cost (Tables 1 and 13).
Table 12.
TOPSIS results
| Candidate materials | Material selection criteria | ||||||
|---|---|---|---|---|---|---|---|
| S BET a | ABSb | V P c | C d | R i | |||
| SBA-15 | 0.0610 | 0.308 | 0.058 | 0.07 | 0.240 | 0.088 | 0.268 |
| SBA-15/Ag (2.5 wt.%) | 0.0520 | 0.424 | 0.047 | 0.105 | 0.130 | 0.125 | 0.49 |
| SBA-15/Ag (5 wt.%) | 0.0489 | 0.551 | 0.039 | 0.139 | 0.071 | 0.243 | 0.773 |
| SBA-15/Ag (10 wt.%) | 0.0520 | 0.551 | 0.040 | 0.156 | 0.087 | 0.242 | 0.735 |
| v + | 0.0610 | 0.551 | 0.058 | 0.070 | |||
| v − | 0.0489 | 0.308 | 0.039 | 0.156 | |||
aBET specific surface area
bAmount of absorption
cTotal pore volume deduced from nitrogen adsorbed volumes measured at the beginning of the plateau after the capillary condensation step
dCost
Table 13.
Descending order of the candidate materials obtained with TOPSIS method
| Candidates | R i | Ranking |
|---|---|---|
| SBA-15/Ag (5 wt.%) | 0.773 | 1 |
| SBA-15/Ag (10 wt.%) | 0.735 | 2 |
| SBA-15/Ag (2.5 wt.%) | 0.490 | 3 |
| SBA-15 | 0.268 | 4 |
Conclusions
In the present study, SBA-15/Ag nanocomposites were prepared by using a direct synthesis method, and the x-ray diffraction analysis of high angle confirmed the formation of amorphous silica and silver crystal phases. BET analysis showed the surface area of pure silica mesoporous material and mesoporous silica–silver nanocomposites (2.5, 5, and 10 %) was 818.8, 689.9, 647.97, and 692.55 m2/g, respectively. The pore size distribution curves obtained from BJH indicated narrow pore size distribution in the mesoporous range for all compounds. Moreover, the adsorption behavior is well described by the Langmuir isotherm model. The adsorption results revealed the feasibility of using a new effective adsorbent (SBA-15 and SBA-15/Ag) for the removal of mercury from aqueous solutions. Also, the TOPSIS method confirmed the above findings.
Acknowledgments
The authors thank Semnan University and Nanonafez Pishroo Kavir Company for supporting some of the experimental procedures.
References
- 1.F. Zahir, S.J. Rizwi, S.K. Haq, and R.H. Khan (2005) Environ Toxicol Pharmacol 20:351 [DOI] [PubMed]
- 2.W.H. Schroeder, J. Munthe (1998) Atmos Environ 32:809
- 3.P. Holmes, K.A.F. James, L.S. Levy (2009) Sci Total Environ 408:171 [DOI] [PubMed]
- 4.R.C. Srivastava (2004) Centre for Environmental Pollution Monitoring and Mitigation, India
- 5.L.Y. Blue, M.A.V. Aelstyn, M. Matlock, D.A. Atwood (2008) Water Res 42:2025 [DOI] [PubMed]
- 6.A S. Tawfik (2016) Desalination Water Treat 57:10730
- 7.A.S. Tawfikh, A.A. Abdulaziz (2015) Surf Interface Anal 47:785
- 8.A.S. Tawfih (2015) J Water Supply: Res Technol AQUA 64:892
- 9.A.S. Tawfik (2015) Environ Sci Pollut Res 22:16721
- 10.W.H. Chen (2012) Rsc Adv 2:6380
- 11.T. Bao, T. Chen, M.L Wille, X. Zou, R.L Frost, C. Qing, D. Chen (2016) Desalination Water Treat 57:19216
- 12.A.S. Tawfik, R.A. Khalid, S.A.A. Mohammed (2015) J Taiwan Inst Chem Eng 55:159
- 13.I. Uzun, F. Güzel (2000) Turk J Chem 24:291
- 14.B. Biskup, B. Subotic (2004) Sep Purif Technol 37:17–31
- 15.A. Cincotti, A. Mameli, A.M. Locci, R. Orru, G. Cao (2006) Ind Eng Chem Res 45:1074
- 16.S. Gier, W.D. Johns (2000) Appl Clay Sci 16:289
- 17.M.H. Koppelman, J.G. A. Dillard (1977) Clays Clay Miner 25:457
- 18.D.W. O’Connell, C. Birkinshaw, T.F. O’Dwyer (2008) Bioresour Technol 99:6709 [DOI] [PubMed]
- 19.V.B.H. Dang, H.D. Doan, T. Dang-Vuc, A. Lohi (2009) Bioresour Technol 100:211 [DOI] [PubMed]
- 20.T.M. Zewail, S.A.M. El-Garf (2010) Desalin Water Treat 22:363
- 21.R.K. Nagarale, G.S. Gohil, V.K. Shahi (2006) Adv Colloid Interface Sci 119:97 [DOI] [PubMed]
- 22.L. Wang, X.L. Wu, W.H. Xu, X.-J. Huang, J.H. Liu, A.W. Xu (2012) Appl Mater Interfaces 4:2686 [DOI] [PubMed]
- 23.A.S. Özcan, A. Özcan (2004) J Colloid Interf Sci 276:39 [DOI] [PubMed]
- 24.S.S. Ahluwali, D. Goyal (2005) J Eng Life Sci 5:158–162
- 25.F. Granados-Correa, J. Jiménez-Becerril (2009) J Hazard Mater 162:1178 [DOI] [PubMed]
- 26.Z. Shahmohammadi, H. Moazed, H. Jafarzadeh, H.N. Haghighat, P. Jou (2008) J Water Wastewater 67:27
- 27.M. Ezoddin, F. Shemirani, K.H. Abdi, M. Khosravi Saghezchi, M.R. Jamali (2010) J Hazard Mater 178:900 [DOI] [PubMed]
- 28.B. Geng, Z. Jin, T. Li, X. Qi (2009) J Chemosphere 75:825 [DOI] [PubMed]
- 29.J.P. Ruparelia, S.P. Duttagupta, A.K. Chatterjee, S. Mukherji (2008) J Desalination 232:145
- 30.R. Fouladi Fard, A. Azimi, N. Bidhendi (2008) J Water Wastewater 67:2
- 31.E. Pehlivan, G. Arslan (2007) J Fuel Process Technol 88:99
- 32.O. Hakami, Y. Zhang, J. Charles (2012) J Banks Water Res 46:3913 [DOI] [PubMed]
- 33.E.M. Johansson (2010) Nanostruc Mater Divis sweden 91:305
- 34.O.C. Gobin, S. Kaliaguine 2006 Laval University, Ste-Foy, Quebec, Canada
- 35.B.Naik, S. Hazra, V.S. Prasad, N.N. Ghosh (2011) Catal Commu 12:1104
- 36.N. Pradhan, A. Pal, T. Pal (2002) Collo Surf A 196:247–257
- 37.E. Sumesh, M.S. Bootharaju, I. Anshup, A. Pradeep (2011) J Hazard Mater 189:450 [DOI] [PubMed]
- 38.R.J. Kalbasi, N. Mosaddegh, A. Abbaspourrad (2012) App Catal A: Gen 78:423–424
- 39.W. Zhu, Y. Han, L. An (2005) Microp Mesop Mater 80:221
- 40.K.S.W. Sing, D.H. Everett, R.A.W. Haul, L. Moscou, R.A. Pierotti, J. Rouquerol, T. Siemieniewska (1985) Pure Appl Chem 57:603
- 41.S. Besson, T. Gacoin, C. Ricolleau, J.P. Boilot (2003) Chem Commun 360 [DOI] [PubMed]
- 42.J. Kenkel (2003) Analytical Chemistry for Technicians, 1 (3 ed.). CRC Press, pp 108–109
- 43.Y. Sharma, V. Srivastava, S. Mukherjee (2010) J Chem Eng Data 55:2390
- 44.B.H. Hameed (2009) J Hazard Mater 162:939 [DOI] [PubMed]
- 45.B. Naika, V. Desaib, M. Kowshikb, V.S. Prasadc, G.F. Fernandod, N. Nath Ghosh (2011) Particuology 9:243
- 46.R. Kumar, N.R. Bishnoi, K.G. Bishnoi (2008) J Chem Eng 135:202
- 47.M. Liu, L. Hou, B. Xi, Y. Zhao, X. Xia (2013) App Surf Sci 273 706 [DOI] [PMC free article] [PubMed]
- 48.K.R. Hall, L.C. Eagleton, A. Acrivos, T. Vermeulen (1966) In Eng Chem Fundam 5:212
- 49.H.M.F. Freundlich (1906) Phys Chem 57:384
- 50.I. Langmuir (1918) J Am Chem Soc 40:1361
- 51.R.V. Rao (2004) J Mater Process Technol 152:71
- 52.E. Albayrak (2004) J Intell Manuf 15:491–503
- 53.M. Dagdeviren, S. Yavuz, N. Kılınç (2009) Expert Syst Appl 36:8143
- 54.M. Yousefpour, A. Rahimi (2014) Mater Des 54:382
- 55.S.J. Chen, C.L. Hwang (1992) Springer, Berlin
- 56.C.L. Hwang, K. Yoon (1981) Springer, Berlin Heidelberg
- 57.J.W. Wang, C.H. Cheng, K.C. Huang (2009a) Appl Soft Comput 9:37
- 58.J.F. Ding (2011) J Mar Sci Techn 19:341
- 59.S. Jakovljevi, W. Hendrix, D. Havermans, J. Meneve (2009) Wear 206:417
- 60.S. Perez-Vega, S. Peter, I. Salmeron-Ochoa, A. Nieva-de la Hidalga, P.N. Sharratt (2011) Proc Saf Environ Prot 89:261
- 61.D. Dalalah, F. AL-Oqla, M. Hayajneh, (2010) Jordan J Mech Ind Eng 4
- 62.R. Khorshidi, A. Hassani, A. Honarbakhsh Rauof, M. Emamy (2013) Mater Des 46:442
- 63.M. Dag˘deviren, S. Yavuz, N. Kılınc (2009) Expert Syst Appl 36:143


