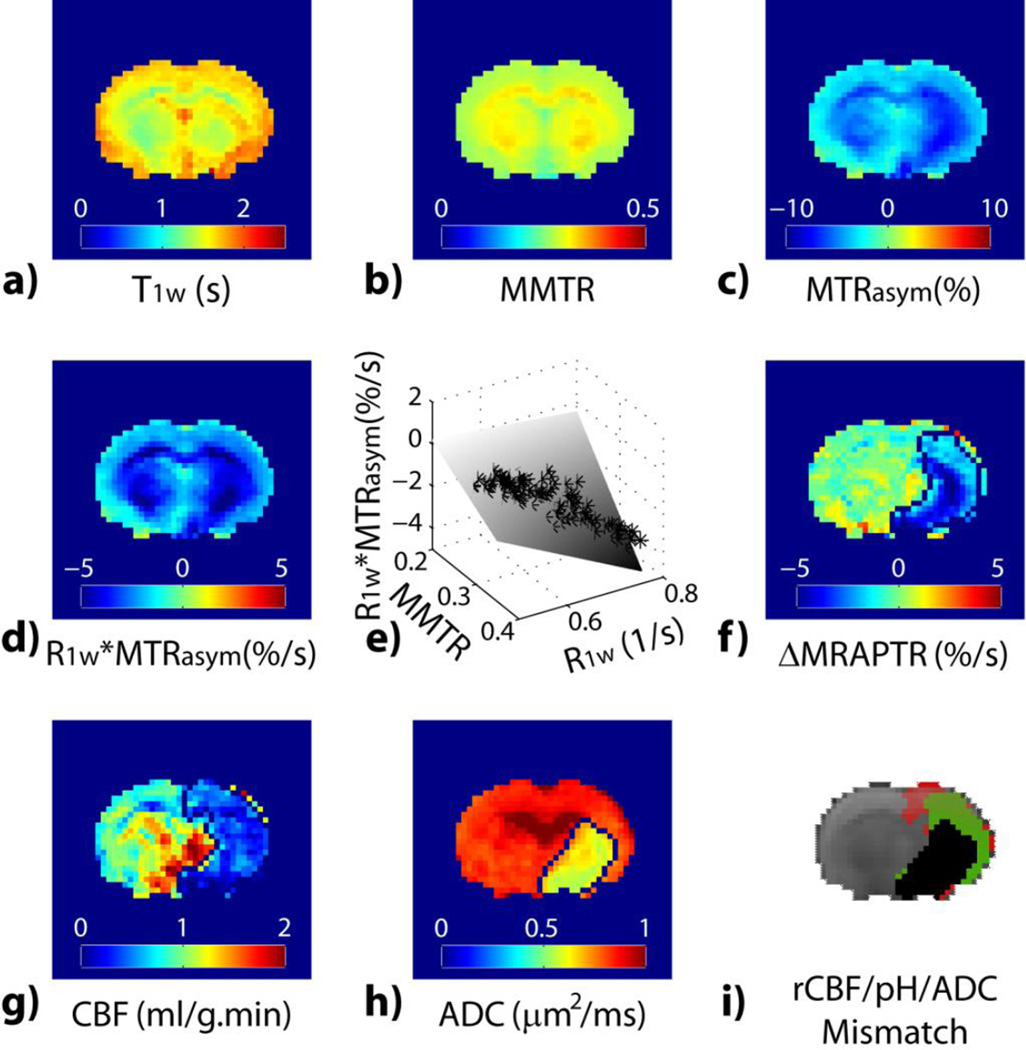
Fig. 4.
MRAPT MRI analysis from a representative acute stroke rat. a) Parametric T1w map. b) MMTR image c) pH-weighted MTRasym image. d) pH-weighted R1w*MTRasym image. e) Multiple regression analysis of R1w*MTRasym as a function of R1w and MMTR. f) pH-sensitive ΔMRAPTR image. g) CBF map. h) ADC map. i) Color-coded perfusion (red), pH (green) and diffusion (black) lesions.

