Significance
We present a mechanism-free formula that predicts effects of multiple drugs at all doses based on measurements of drug pairs at a few doses. The formula bypasses the combinatorial explosion problem by greatly reducing the number of measurements needed to design optimal cocktails for cancer and infection.
Keywords: drug combinations, drug cocktails, cancer treatment, mechanism-free formula, predictive formula
Abstract
Finding potent multidrug combinations against cancer and infections is a pressing therapeutic challenge; however, screening all combinations is difficult because the number of experiments grows exponentially with the number of drugs and doses. To address this, we present a mathematical model that predicts the effects of three or more antibiotics or anticancer drugs at all doses based only on measurements of drug pairs at a few doses, without need for mechanistic information. The model provides accurate predictions on available data for antibiotic combinations, and on experiments presented here on the response matrix of three cancer drugs at eight doses per drug. This approach offers a way to search for effective multidrug combinations using a small number of experiments.
To kill cancer cells or bacteria, combination therapy can be more effective than individual drugs (1–6). Combination therapy is thought to allow increased efficacy at low doses, thus reducing side effects and toxicity; it is also believed to minimize the chances of resistance (7–9), a pressing problem in treating cancer and infectious diseases.
Much work has been devoted to classifying how pairs of drugs interact (10–14). Across systems, a good first approximation is the Bliss independence model (15, 16), in which the pair effect is the product of the individual drug effects: If the effect of the drugs are g1 and g2, the effect of the combination is g12 = g1 · g2. The Bliss model ignores interactions in which drugs enhance each other effects—synergism—or inhibit each other’s effects—antagonism. Some drugs even inhibit each other so much that the combined effect is lower than either drug alone, an effect called hyperantagonism (17–21).
Going beyond drug pairs has been difficult. Experimentally testing high-order combinations beyond pairs in a systematic way is challenging because it requires an exponentially large number of experiments (22–25): For N drugs at D doses, one needs DN experiments. For N = 10 drugs and D = 8 doses, this means ∼109 measurements. The combinatorial explosion makes exhaustive testing of drug dose combinations unfeasible. This problem is especially acute in cases where material is scarce, such as testing of patient-derived samples (26–29). Hence, models for predicting high-order effects are essential.
Apart from detailed simulations of particular systems (22, 30, 31), there has been little study of general mechanism-independent models for multiple drugs. An exception is the elegant study by Wood et al. (32) that showed that combinations of antibiotics can be predicted by an Iserliss-like formula that uses pair effects to predict the effects of higher-order mixtures. For example, the effect of a drug triplet is modeled as . This formula has not been tested on cancer drug mixtures, to the best of our knowledge.
Another line of research uses machine learning algorithms to make predictions based on a small number of measurements (23, 33–37). Such approaches use regression to extrapolate from data, and often require iteration cycles of prediction and experiment to home in on solutions. Such machine learning approaches can benefit from a predictive formula that can make the search less prone to experimental error and can help avoid local maxima.
Here we study how multiple cancer drugs interact to affect cells by measuring the response matrix of three cancer drugs at eight doses per drug. We find that existing approaches do not accurately predict the response matrix. We therefore introduce a relatively simple model for drug mixtures. This model predicts high-order combination effects at all doses, based on measurements on single drugs and drug pairs at a small number of doses. The model provides accurate predictions for the three anticancer drug dose–response matrix measured in this study, and available data on antibiotic effects on bacterial growth rate (32), even in cases where synergy and antagonism is strong. This model is especially noise-resistant because it interpolates between dose measurements. The present model may be used to make accurate predictions of multiple drugs, based on only a few measurements of single and pair effects, thus bypassing the need for an exponentially large number of measurements.
Results
Current Approaches Do Not Describe the Response Matrix of Three Cancer Drugs.
We experimentally measured the dose–response matrix for eight doses of three commonly used chemotherapy drugs—doxorubicin, taxol, and cisplatin—on survival of A549 human lung cancer cells. Survival was measured using a cell viability assay (Methods).
The single-drug dose curves are given by the response matrix when the dose of the two other drugs is zero. The dose–response curves were well fit by Hill curves (10, 38, 39), characterized by a steepness parameter (Hill coefficient) n and a halfway point , equal to the drug concentration of 50% effect
| [1] |
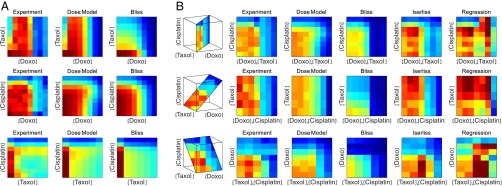
When combined, the drugs show a relatively complex interplay, which can be visualized by 2D slices through the response matrix (Fig. 1). Some slices show nonmonotonic behavior where survival is highest at intermediate doses.
Fig. 1.
Response matrix of three chemotherapy drugs at eight doses shows nonmonotonic behavior that is well captured by the dose model but not by other models. (A) Survival of A549 lung cancer cells when treated with the three pairs of drugs (taxol−doxorubicin, cisplatin−doxorubicin, cisplatin−taxol) at eight doses each: (Left) the measured response, (Middle) the predicted response using the present dose model, and (Right) the predicted response by Bliss independence. (B) Slices of the three-drug dose–response matrix. The first column is the measured response, followed by the prediction of the three drugs’ interactions using different models. Note that the Isserlis and regression models apply only to triplets and above, not to pairs.
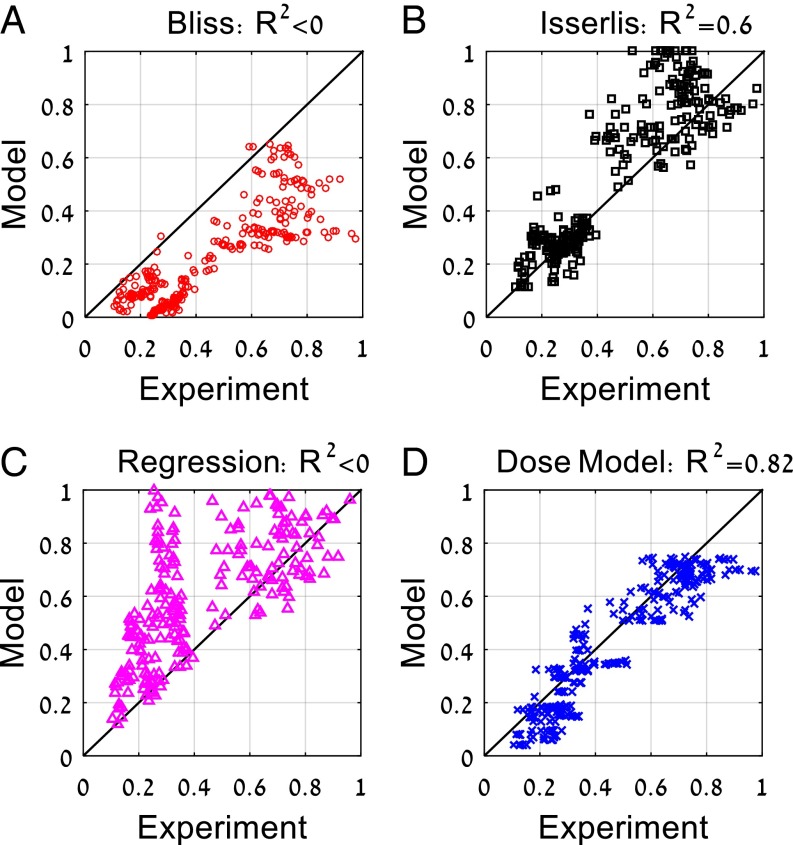
To evaluate synergy and antagonism, we computed the Bliss approximation, given by the product of the single-drug response curves . The Bliss approximation differs significantly from the measured response matrix (Figs. 1 and 2A). The drug combinations show reduced effect compared with Bliss, which means that they show antagonism (Fig. 2A). Antagonism is partly due to cell cycle effects where taxol tends to prevent entry of cells into the S phase in which the other two drugs are most effective (40–42).
Fig. 2.
Response of three cancer drug mixtures at multiple doses is best captured by the present dose model. Experimental measurements of the mixture of the three anticancer drugs taxol, doxorubicin, and cisplatin at all dose combinations compared with (A) Bliss independence, (B) Isserlis predictions, (C) regression model, and (D) present dose model predictions. R2 = 1 − ∑(Model − Experiment)/var(Experiment) can yield negative values when the mean model prediction is different from the mean experimental measurement, indicating a very poor fit.
We next compared the data to the Isserlis formula . We find that the Isserlis model does better than Bliss but still explains only 60% of the variance, R2 = 0.6 (Fig. 2B). One reason for this relative lack of fit is experimental noise: The Isserlis model depends sensitively on errors in the three input pairs g12, g13, and g23 and the three single-effect data points g1, g2, and g3.
We also performed regression similar to that used in machine learning approaches (36, 37, 43), which results in the formula (Methods). This regression formula shows poor performance (Fig. 2C). We conclude that an improved formula is needed to describe the present three-drug response matrix.
A Simple Dose Model for Drug Combinations.
We present a simple model for drug combinations. This is a model for three or more drugs, based on measurements of the response of single drugs and drugs pairs at a few dose combinations.
The model extends the Bliss formula; it is based on the product of the effects of all drugs in the mixture, not at their true doses but rather at effective doses that differ from the true doses due to interactions with the other drugs in the mixture. This interaction is modeled by introducing interaction terms between drug pairs (14). In the model, the effective dose of each drug, Dieff, is its true dose Di times a product of the Michaelis−Menten-like terms for all of the other drugs
| [2] |
The functions gi are Hill functions appropriate to each single drug (Eq. 1) with steepness ni and halfway point . They are evaluated from the single-drug response curve. The aij interaction parameters are computed from two-drug data (Methods). This model assumes that the effects of drugs on each other’s effective doses are multiplicative, and that one can neglect third-order and higher interactions (44).
To test this model, we begin by considering two-drug response surfaces (3, 45, 46). Thus, we consider Eq. 2 with only two drugs. The response surface in the model is a product of Hill functions gi of the effective doses D1eff and D2eff
| [3] |
Each effective dose is modeled as the true dose divided by a Michaelis−Menten-like factor of the effective dose of the other drug in units of its halfway point
| [4] |
This model has two free parameters for the interaction, a12 and a21, which are fit from the pair data (Methods).
The model captures all three pairs of cancer drugs studied here with high accuracy (Fig. 1A). It shows R2 = 0.87, 0.91, and 0.86 for the pairs doxorubicin−taxol, doxorubicin−cisplatin, and taxol−cisplatin, respectively. For comparison, Bliss independence gives R2 = 0.16, 0.83, and 0.7. All three pairs of drugs show antagonism (aij > 0), with the antagonism of taxol and doxorubicin being most significant.
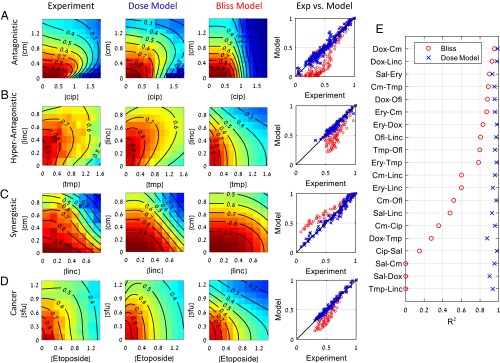
For drug pairs, there exists an additional wealth of published data to test the model. The model fits well all interactions of 20 antibiotic pairs and two pairs of anticancer drugs measured in ref. 14 (Fig. 3 and Fig. S1A). The model captures almost all of the variation in the data (<R2> = 0.95). For comparison, the Bliss independence model gives <R2> = 0.58. The model is even capable of capturing hyperantagonism (47), where the pair has a lower effect than either of the two single drugs [such as the pair trimethoprim−lincomycin (Fig. 3B)].
Fig. 3.
The present dose model accurately describes response surfaces of antibiotic and chemotherapy drug pairs. Examples of response surfaces for antibiotic pairs that are (A) antagonistic (B) hyperantagonistic, and (C) synergistic. (D) Interactions of anticancer drug pairs also well described by the model. (E) R2 values of the 20 drug pairs considered here for Bliss independence (o), and the present dose model of Eqs. 3 and 4 (x). Experimental data from Wood et al. (14). Cip, ciprofloxacin; Cm, chloramphenicol; Dox, doxycycline; Ery, erythromycin; Linc, lincomycin; Ofl, ofloxacin; Sal, salicylate; Tet, tetracycline; Tmp, trimethoprim (see also Fig. S1A).
Fig. S1.
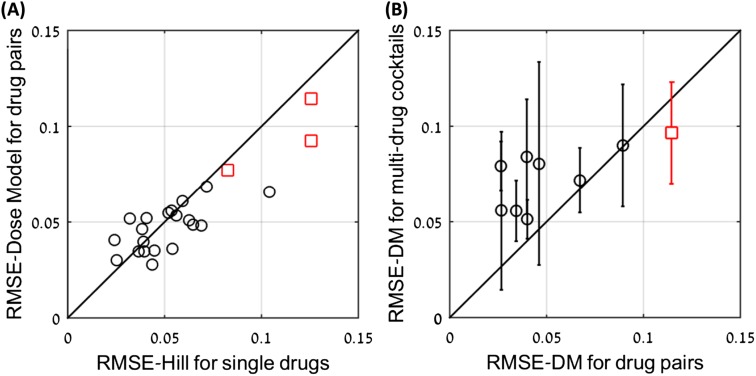
The errors of the dose model seem to result mainly from experimental noise. (A) RMSE of the dose model for 20 drug pairs (o) as a function of the maximal RMSE of the Hill model for the single drugs. The correlation between the two shows that much of the error in the dose model errors can be attributed to noise. Similar results for three anticancer drugs are also presented (□). (B) RMSE of the dose model for three- and four-drug combinations as a function of the maximal RMSE of the dose model for the pairs of drugs in the combination (o). The correlation between the two suggests that much of the dose model error can be attributed to noise. Similar results for three anticancer drugs are also presented (□).
Importantly, the present dose model requires only a few measurements to accurately fit the entire dose surface of a drug pair, because it has only two (or one) free parameters. In all cases considered here, 10 measurements on pairs of doses suffice to provide an excellent fit to the entire experimental dose surface of a drug pair (Fig. S2).
Fig. S2.
Accuracy analysis suggests that a single interaction parameter suffices for the pair model in most cases, and that only about 10 measurements suffice to specify the pair parameters. (A) The loss of accuracy (ΔRMSE) when using only one parameter (a12 or a21) to describe pair interactions. The best results (lower RMSE) out of the two options are presented. In most cases, the loss of accuracy is small (<0.5%). In the case of superantagonism (Tmp-Ofl), the loss of accuracy is large, because both interaction terms are needed to describe the effect. (B) The loss of accuracy as a function of the number of pairs of doses measured to estimate the parameters of a given pair of drugs. Accuracy is relative to the measurement of all dose pairs in the dataset (∼100). For 10 measurements, the loss of accuracy is about 0.5%.
The model can be made even simpler in many cases: For many drug pairs, setting one of the two interaction parameters a12 or a21 to zero obtains a model with a single fitting parameter. This model reduction gives a loss of accuracy of less than 0.5% for 80% of the drug pairs (Fig. S2).
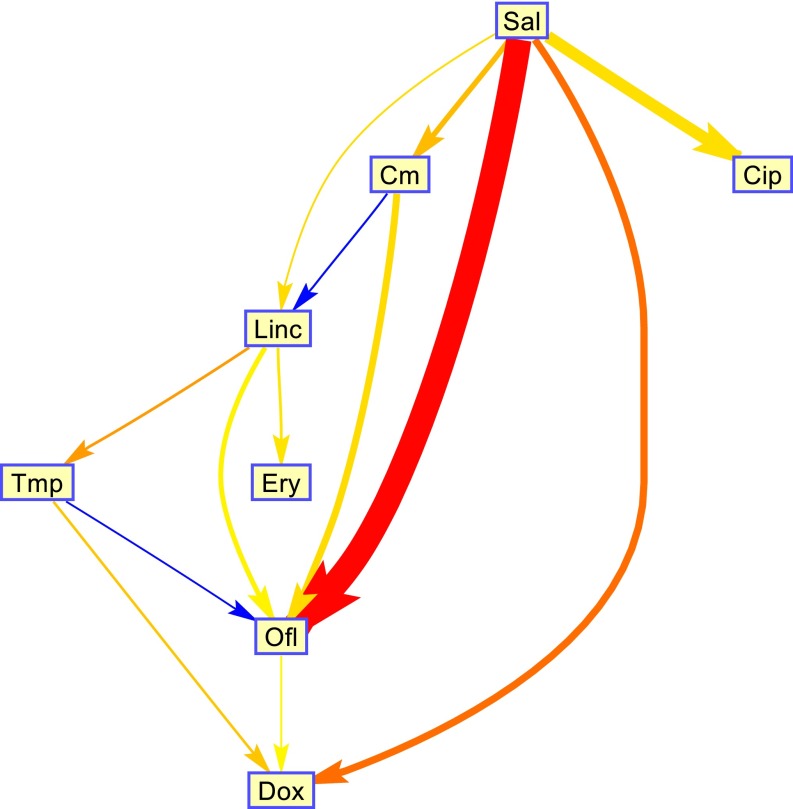
The finding that a single interaction parameter captures many of the pairs provides a picture of a hierarchy between the drugs: Drug 1 changes the effective dose of drug 2 but not vice versa (1→2). A hierarchy is obtained because we find that that these relations are transitive: If drug 1 affects drug 2 (1→2) and drug 2 affects drug 3 (2→3), then drug 1 will affect drug 3 (1→3) but not vice versa. The hierarchy between antibiotics is shown in Fig. 4. For example, salicylate is high on the hierarchy because it activates a multidrug efflux system that transports other drugs out of the bacterial cell (48) (Fig. S3).
Fig. 4.
A hierarchy between antibiotics. For most of the drug pairs, one of the two interaction parameters a12 or a21 can be set to zero without significant loss of fit quality, resulting in a single parameter for the interaction. In these cases, we can say that drug 1 changes the effective dose of drug 2 but not vice versa (1→2). We find that these relations are transitive: If drug 1 affects drug 2 (1→2) and drug 2 affects drug 3 (2→3), then drug 1 will affect drug 3 (1→3) but not vice versa. The direction of the interaction is transitive, but the absolute strength of the interaction is not always transitive. To quantify the strength of the hierarchy we use the goodness of fit (RMSE) difference in the case of a12 = 0 and a21 = 0. This quantity is indicated by the arrow thickness. The strength of the interaction is indicated by the color of the arrow (red, strong antagonistic; blue, strong synergistic). We plotted only interaction with nonnegligible hierarchy (∆RMSE > 0.005%). Note that 8 out of the 28 possible interactions were not present in the published dataset.
Fig. S3.
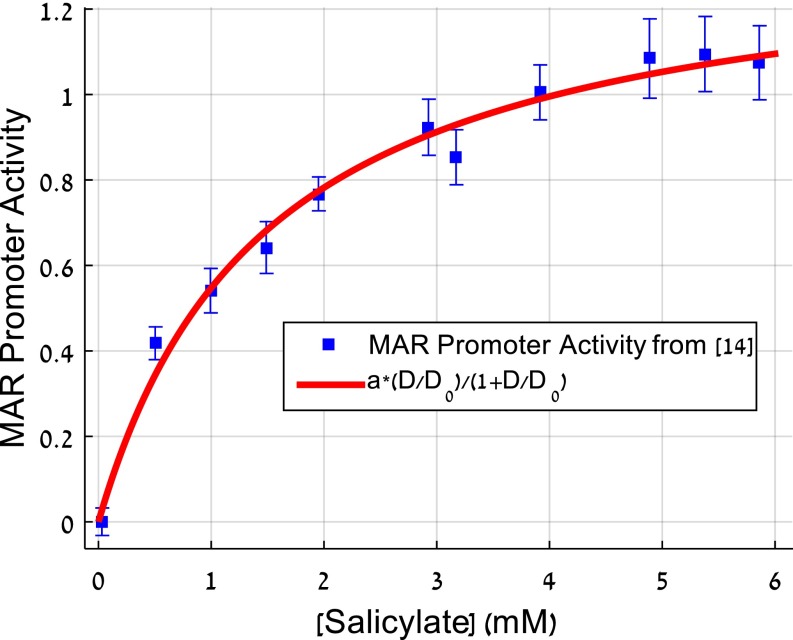
A mechanistic motivation for the two-drug interaction term based on drug efflux pump induction. We use the well-understood drug interaction mechanism in the mar system. In this system, salicylate and other drugs interact through the induction of the mar efflux system by salicylate. The efflux system exports the other drug and effectively reduces its dose (14). The figure shows data from ref. 14 on the promoter activity of the mar system as a function of salicylate dose. We find that this induction curve is fit very well by the present Michaelis–Menten-like interaction term between the two drugs salicylate and tetracycline. Additional mechanisms are probably at play in other cases.
The Dose Model Describes Combinations of Three and Four Antibiotics Using Only Pair Data.
We now turn to the anticancer drug triplet measured here. We used the aij interaction parameters for the three pairs in the triplet. We find that the dose model for three drugs (Eq. 2) describes the full three-drug interaction matrix very well (R2 = 0.82; Figs. 1 and 2).
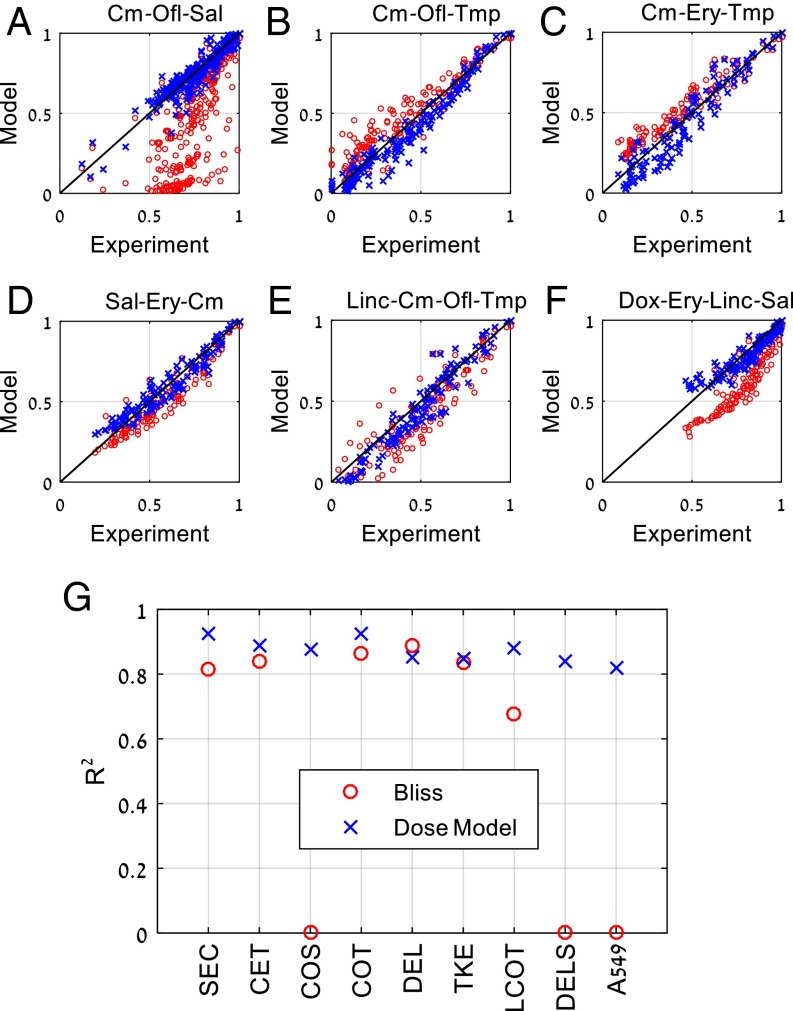
We further compared the model for triplets and quadruplets of antibiotics published previously (32). The dataset includes six triplets and two quadruplets at a total of 1,384 dose combinations. The drug pairs that make up these combinations have synergy and antagonism, and several of the triplet and quadruplets are markedly non-bliss-like, so that prediction is challenging. We find that the model of Eq. 2, with aij parameters fitted from drug pair data, works very well (R2 ∈ [0.85, 0.93]) for all of these combinations (Fig. 5 and Fig. S1B).
Fig. 5.
Combinations of three or four drugs are well described by the present dose model (x). Bliss independence (o) results are displayed for comparison. The three-drug combination Cm-Ofl-Sal shows strong antagonism (B) The three-drug combination Cm-Ofl-Tmp show synergism. (C) The three-drug combination Cm-Ery-Tmp shows synergism. (D) The three-drug combination Sal-Ery-Cm shows mild antagonism (E) The four-drug combination Linc-Cm-Ofl-Tmp shows complex interactions captured by the model. (F) The four-drug combination Dox-Ery-Linc-Sal shows antagonism. (G) R2 values for three- and four-drug combinations: Bliss model (o) and the present dose model (x). Antibiotic data are from Wood et al. (32); results for the present experiments on three anticancer drugs on A549 cells (Figs. 1 and 2) are also presented. Cm/C, chloramphenicol; Dox/D, doxycycline; Ery/E, erythromycin; Linc/L, lincomycin; Ofl/O, ofloxacin; Sal/S, salicylate; Tmp/T, trimethoprim. Isserlis model for quadruplets is g1234 = g12g34 + g13g24 + g14g23 − 2g1g2g3g4 (see also Fig. S1B).
For example, consider the antibacterial triplet chloramphenicol, ofloxacin, and salicylate. Salicylate is highest in the hierarchy and antagonistic to the other two antibiotics (48, 49). In the model, this antagonism is represented by the parameters a23 = 7.2 ± 0.4 and a13 = 2.8 ± 0.3. The remaining pair has mild antagonism (a21 = 0.5 ± 0.02). The triplet shows very strong antagonism predicted accurately by the model [R2 = 0.88; compare with Bliss R2 ≈ 0 (Fig. 5A)].
A second example that includes both synergy and antagonism is the triplet chloramphenicol, ofloxacin, and trimethoprim (Fig. 5B). Here ofloxacin and trimethoprim are synergistic (a23 = −0.8 ± 0.05) as are chloramphenicol and trimethoprim (a31 = −0.57 ± 0.08), whereas chloramphenicol and ofloxacin are antagonistic (a21 = 0.99 ± 0.07). Thus, a priori, it is difficult to predict the synergy/antagonism of the triplet. The model predicts overall synergy, and fits the experiment very well (R2 = 0.93 compared with Bliss R2 = 0.86).
The Dose Model May Be Used to Optimize Drug Combinations for Minimal Side Effects.
The dose model described here can be used to navigate the space of multidrug doses to find combinations of interest. As a schematic example, we consider the problem of finding a drug combination with a given efficacy that has minimal side effects. This example is meant to demonstrate a general approach, which can be made more realistic with accurate models for side effects or other features that need to be optimized.
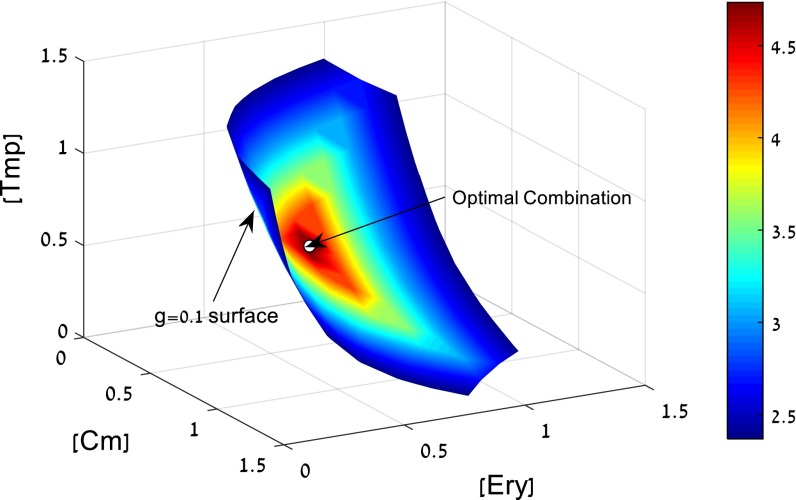
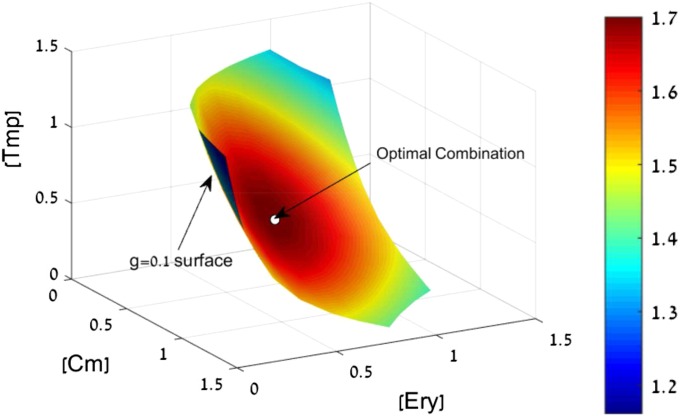
To illustrate this, we consider a triplet of antibiotics—chloramphenicol, erythromycin, and trimethoprim. The model allows calculating all dose combinations with a given effect, say a 10-fold growth reduction of the bacteria, g = 0.1. The dose combinations that give g = 0.1 form a surface in the 3D space of doses (Fig. 6).
Fig. 6.
Search for a mixture with high efficacy at low doses. We seek a combination of three antibiotics with a given large effect (g = 0.1). The doses that satisfy this condition form a surface in the 3D dose space for chloramphenicol (Cm), erythromycin (Ery), and trimethoprim (Tmp). On this surface, we seek the combination with minimal side effects. Assuming that side effects increase with drug doses, we can seek to minimize, for example, the maximal dose in the combination M = max(Di/D0i). The colors indicate the decrease in M relative to the lowest Di/D0i of the individual drugs. The optimal drug combination indicated by an arrow on the g = 0.1 surface has a fourfold-lower M than the best individual drug (see also Fig. S4).
On this surface, we seek the combination with minimal side effects. Assuming that side effects increase with drug doses, we can seek to minimize, for example, the sum of normalized doses S = Di/D0i (Fig. S4). Another possibility is to minimize the maximal dose in the combination M = max(Di/D0i). In both cases, an optimal drug combination is found that uses lower doses than the best individual drug (indicated by an arrow on the g = 0.1 surface in Fig. 6). The combination that minimizes summed doses has a twofold lower total dose than the best individual drug (Fig. S4). The combination that minimizes maximal dose has a fourfold lower dose than the best individual drug (Fig. 6).
Fig. S4.
Search for high efficacy at low dose combinations. We seek a combination with a given large effect (g = 0.1). The doses that satisfy this condition form a surface in the 3D dose space, for example, the g = 0.1 surface for the three antibiotics: Cm, Ery, and Tmp. On this surface, we seek the combination with minimal side effects. Assuming that side effects increase with drug doses, we can seek to minimize, for example, the sum of normalized doses S = Di/D0i. The color indicates the decrease in the side effects relative to the side effect of the best individual drug. The optimal drug combination, indicated by an arrow on the g = 0.1 surface, has an approximate twofold-lower dose than the best individual drug. Another possibility is to minimize the maximal dose in the combination M = max(Di/D0i) (Fig. 6).
Discussion
We presented a model for the effects of multidrug mixtures for anticancer drugs and antibiotics. The model does not require knowledge of the mechanism of drug action, and is based on relatively few measurements on drug pairs. The model accurately describes published data on antibiotic triplets and quadruplets, as well as experimental data presented here on dose–response of combinations of three cancer drugs.
The model has two interaction parameters for each pair, a12 and a21. These parameters describe how the effective dose of a drug is affected by the presence of the other drug. The parameters can be accurately estimated based on about 10 dose combinations for each pair. The use of several dose combination measurements to estimate the parameters helps reduce the effects of experimental noise, partly explaining why the present model is more accurate than previous mechanism-free models such as the Isserlis model and regression-based models (Fig. S5).
Fig. S5.
The Isserlis model agrees with the present model in the limit of weak interactions and low noise. (A) We generated synthetic data using the present model and fit the data using the Isserlis model. We used doses D/D0 = 0 to Dmax, where g(Dmax) = 0.2, Hill coefficients for the two simulated drugs were in the range n = 1–7, and interaction parameters aij in the range −1 to 6 (note that the smallest possible value for aij is −1). The models agree well when the interactions are weak (n < 2, |aij| < 3) (R2 > 0.9). Agreement breaks down when the interactions are stronger or Hill coefficients for at least one drug exceed 2. (B) The agreement breaks down even for weak interactions in the presence of noise. Here sigma is the SD of Gaussian noise added to the simulated log effect data. Hill coefficient for the two drugs in this example was n = 2. (C and D) We also tested a smoothed version of the Isserlis model on the present cancer drug dose–response matrix, in which the single and pair drug inputs to the Isserlis model are taken from the present model. Because the present model uses multiple dose measurements, this input has reduced noise. This smoothed Isserlis model fits the present cancer drug data better than the unsmoothed Isserlis model [R2 = 0.7 (C) vs. R2 = 0.6 (D)] but not as well as the present model (R2 = 0.82) (Fig. 2D). This indicates that part of the improvement in R2 is due to noise insensitivity (∼0.1) and part of it is systematic (∼0.1).
The fitted interaction parameters reveal a hierarchy between the drugs. Some drugs impact the effective dose of the other drug but not vice versa. This relationship is transitive and can offer clues about the mechanisms of synergy and antagonism. For example, a drug high in the hierarchy is likely to set off general drug resistance systems, as in the case of salicylate, which activates the mar system in bacteria (Fig. S3).
The present approach can overcome the combinatorial explosion problem in which the number of experiments rises exponentially with the number of drugs and doses, because it requires few measurements. Instead of DN measurements for N drugs and D doses, we can use the single-drug dose–response curves plus a sampling of the pair dose combinations to fit the interaction parameters aij. In total, this model requires only a quadratic number of measurements, N · D + cN(N − 1)/2, where c is ∼10. This means that for N = 6 drugs and D = 8 doses, we need only 198 measurements instead of DN ≈ 3 · 105. For N = 10 drugs and D = 8 doses, we need only 530 measurements instead of ∼109. This approach therefore potentially allows navigating the space of high-order drug combinations to search for mixtures with high efficacy at low dose.
Methods
Regression Model.
Machine learning approaches often use regression models. A commonly used regression formula employs the variables xi = 0 or 1 that denote the absence or presence of drug i in the mixture. The effect of the mixture g is described in the model as . The parameters bi and cij are fit from single and pair data. For triplets, the equivalent formula is . For quadruplets, .
Estimation of Model Parameters.
We determine the values and confidence intervals of the model parameters (ni, D0i, and aij) using the MATLAB function “fit.” We use the single-drug dose–response curve to estimate the values and uncertainty of ni and D0i for each drug. The interaction parameters aij are determined by the two-drug response matrix. In the process of fitting aij, we allow ni and D0i to change within their uncertainty estimated from the single-drug measurements.
Computation of Effective Doses in the Model.
In the general case aij ≠ 0, we determine the effective dose by numerically solving Eq. 2 using the MATLAB function “fmincon.” When there exists a hierarchy between the drugs in the combination and {aij = 0|aji = 0}, there is an analytic solution to Eq. 2 that one can use instead of a numerical solution
Cell Lines and Culture Conditions.
Measurements were performed by BioDuro (email bioduroinfo@bioduro.com). A549 (non-small cell lung cancer) cells were grown in 384-well plates (#3707; Corning) plated at 104 cells per well. Plates were incubated at 37°C and 5% (vol/vol) CO2 for 24 h in membrane-filtered growth media composed of RPMI (Roswell Park Memorial Institute) 1640 with l-glutamine (#11875093; Invitrogen) supplemented with 10% FCS [certified FBS, FBS (#SH30084.03; HyClone)], and 0.05% Penicillin-Streptomycin (#15140-122; Invitrogen). After 24 h, the drugs (taxol, doxorubicin, and cisplatin) were added (2.5 μL per well) to final concentrations of 20 μM, 10 μM, 3.3 μM, 1.1 μM, 370 nM, 123 nM, 41 nM, and 13.7 nM and two controls: 0.1% DMSO and 2.5 μL of regular media (untreated). Cells were incubated with drugs for 48 h, followed by a cell survival assay [3-(4,5-dimethylthiazol-2-yl)-2,5-diphenyltetrazolium bromide].
Cell Survival Assay.
The viability assay was done using an MTT-based in vitro toxicology assay (#C0009; Beyotime). Cells were incubated with reconstituted MTT for 4 h, and absorbance was measured at 570 nm.
Acknowledgments
U.A. is the incumbent of the Abisch-Frenkel Professorial Chair. Support was provided by the Clore-Katz-David Foundation and Fela Shapell Family Foundation, and the Israel National Center for Personalized Medicine (INCPM) Fund for Preclinical Studies.
Footnotes
The authors declare no conflict of interest.
This article is a PNAS Direct Submission.
See Commentary on page 10231.
This article contains supporting information online at www.pnas.org/lookup/suppl/doi:10.1073/pnas.1606301113/-/DCSupplemental.
References
- 1.Chait R, Vetsigian K, Kishony R. What counters antibiotic resistance in nature? Nat Chem Biol. 2011;8(1):2–5. doi: 10.1038/nchembio.745. [DOI] [PubMed] [Google Scholar]
- 2.DeVita VT, Jr, Young RC, Canellos GP. Combination versus single agent chemotherapy: A review of the basis for selection of drug treatment of cancer. Cancer. 1975;35(1):98–110. doi: 10.1002/1097-0142(197501)35:1<98::aid-cncr2820350115>3.0.co;2-b. [DOI] [PubMed] [Google Scholar]
- 3.Fitzgerald JB, Schoeberl B, Nielsen UB, Sorger PK. Systems biology and combination therapy in the quest for clinical efficacy. Nat Chem Biol. 2006;2(9):458–466. doi: 10.1038/nchembio817. [DOI] [PubMed] [Google Scholar]
- 4.Hopkins AL. Network pharmacology: The next paradigm in drug discovery. Nat Chem Biol. 2008;4(11):682–690. doi: 10.1038/nchembio.118. [DOI] [PubMed] [Google Scholar]
- 5.Lehár J, et al. Synergistic drug combinations tend to improve therapeutically relevant selectivity. Nat Biotechnol. 2009;27(7):659–666. doi: 10.1038/nbt.1549. [DOI] [PMC free article] [PubMed] [Google Scholar]
- 6.Xu L, et al. Combined EGFR/MET or EGFR/HSP90 inhibition is effective in the treatment of lung cancers codriven by mutant EGFR containing T790M and MET. Cancer Res. 2012;72(13):3302–3311. doi: 10.1158/0008-5472.CAN-11-3720. [DOI] [PMC free article] [PubMed] [Google Scholar]
- 7.Bock C, Lengauer T. Managing drug resistance in cancer: Lessons from HIV therapy. Nat Rev Cancer. 2012;12(7):494–501. doi: 10.1038/nrc3297. [DOI] [PubMed] [Google Scholar]
- 8.Holohan C, Van Schaeybroeck S, Longley DB, Johnston PG. Cancer drug resistance: An evolving paradigm. Nat Rev Cancer. 2013;13(10):714–726. doi: 10.1038/nrc3599. [DOI] [PubMed] [Google Scholar]
- 9.Hu C-MJ, Zhang L. Nanoparticle-based combination therapy toward overcoming drug resistance in cancer. Biochem Pharmacol. 2012;83(8):1104–1111. doi: 10.1016/j.bcp.2012.01.008. [DOI] [PubMed] [Google Scholar]
- 10.Chou T-C, Talalay P. Quantitative analysis of dose-effect relationships: The combined effects of multiple drugs or enzyme inhibitors. Adv Enzyme Regul. 1984;22:27–55. doi: 10.1016/0065-2571(84)90007-4. [DOI] [PubMed] [Google Scholar]
- 11.Held MA, et al. Genotype-selective combination therapies for melanoma identified by high-throughput drug screening. Cancer Discov. 2013;3(1):52–67. doi: 10.1158/2159-8290.CD-12-0408. [DOI] [PMC free article] [PubMed] [Google Scholar]
- 12.Schuldiner M, et al. Exploration of the function and organization of the yeast early secretory pathway through an epistatic miniarray profile. Cell. 2005;123(3):507–519. doi: 10.1016/j.cell.2005.08.031. [DOI] [PubMed] [Google Scholar]
- 13.Stylianou M, et al. Antifungal application of nonantifungal drugs. Antimicrob Agents Chemother. 2014;58(2):1055–1062. doi: 10.1128/AAC.01087-13. [DOI] [PMC free article] [PubMed] [Google Scholar]
- 14.Wood KB, Wood KC, Nishida S, Cluzel P. Uncovering scaling laws to infer multidrug response of resistant microbes and cancer cells. Cell Reports. 2014;6(6):1073–1084. doi: 10.1016/j.celrep.2014.02.007. [DOI] [PubMed] [Google Scholar]
- 15.Bliss CI. The toxicity of poisons applied jointly. Ann Appl Biol. 1939;26(3):585–615. [Google Scholar]
- 16.Bliss CI. The calculation of microbial assays. Bacteriol Rev. 1956;20(4):243–258. doi: 10.1128/br.20.4.243-258.1956. [DOI] [PMC free article] [PubMed] [Google Scholar]
- 17.Chait R, Craney A, Kishony R. Antibiotic interactions that select against resistance. Nature. 2007;446(7136):668–671. doi: 10.1038/nature05685. [DOI] [PubMed] [Google Scholar]
- 18.Loewe S. The problem of synergism and antagonism of combined drugs. Arzneimittelforschung. 1953;3(6):285–290. [PubMed] [Google Scholar]
- 19.Berenbaum MC. What is synergy? Pharmacol Rev. 1989;41(2):93–141. [PubMed] [Google Scholar]
- 20.Bollenbach T, Quan S, Chait R, Kishony R. Nonoptimal microbial response to antibiotics underlies suppressive drug interactions. Cell. 2009;139(4):707–718. doi: 10.1016/j.cell.2009.10.025. [DOI] [PMC free article] [PubMed] [Google Scholar]
- 21.Yeh P, Tschumi AI, Kishony R. Functional classification of drugs by properties of their pairwise interactions. Nat Genet. 2006;38(4):489–494. doi: 10.1038/ng1755. [DOI] [PubMed] [Google Scholar]
- 22.Feala JD, et al. Systems approaches and algorithms for discovery of combinatorial therapies. Wiley Interdiscip Rev Syst Biol Med. 2010;2(2):181–193. doi: 10.1002/wsbm.51. [DOI] [PubMed] [Google Scholar]
- 23.Calzolari D, et al. Search algorithms as a framework for the optimization of drug combinations. PLOS Comput Biol. 2008;4(12):e1000249. doi: 10.1371/journal.pcbi.1000249. [DOI] [PMC free article] [PubMed] [Google Scholar]
- 24.Dancey JE, Chen HX. Strategies for optimizing combinations of molecularly targeted anticancer agents. Nat Rev Drug Discov. 2006;5(8):649–659. doi: 10.1038/nrd2089. [DOI] [PubMed] [Google Scholar]
- 25.Lundstedt T, et al. Experimental design and optimization. Chemom Intell Lab Syst. 1998;42(1-2):3–40. [Google Scholar]
- 26.Bedard PL, Hansen AR, Ratain MJ, Siu LL. Tumour heterogeneity in the clinic. Nature. 2013;501(7467):355–364. doi: 10.1038/nature12627. [DOI] [PMC free article] [PubMed] [Google Scholar]
- 27.Blom K, Nygren P, Alvarsson J, Larsson R, Andersson CR. Ex vivo assessment of drug activity in patient tumor cells as a basis for tailored cancer therapy. J Lab Autom. 2016;21(1):178–187. doi: 10.1177/2211068215598117. [DOI] [PubMed] [Google Scholar]
- 28.Pemovska T, et al. Individualized systems medicine strategy to tailor treatments for patients with chemorefractory acute myeloid leukemia. Cancer Discov. 2013;3(12):1416–1429. doi: 10.1158/2159-8290.CD-13-0350. [DOI] [PubMed] [Google Scholar]
- 29.Sequist LV, et al. Implementing multiplexed genotyping of non-small-cell lung cancers into routine clinical practice. Ann Oncol. 2011;22(12):2616–2624. doi: 10.1093/annonc/mdr489. [DOI] [PMC free article] [PubMed] [Google Scholar]
- 30.Bordbar A, Monk JM, King ZA, Palsson BO. Constraint-based models predict metabolic and associated cellular functions. Nat Rev Genet. 2014;15(2):107–120. doi: 10.1038/nrg3643. [DOI] [PubMed] [Google Scholar]
- 31.Janes KA, et al. A systems model of signaling identifies a molecular basis set for cytokine-induced apoptosis. Science. 2005;310(5754):1646–1653. doi: 10.1126/science.1116598. [DOI] [PubMed] [Google Scholar]
- 32.Wood K, Nishida S, Sontag ED, Cluzel P. Mechanism-independent method for predicting response to multidrug combinations in bacteria. Proc Natl Acad Sci USA. 2012;109(30):12254–12259. doi: 10.1073/pnas.1201281109. [DOI] [PMC free article] [PubMed] [Google Scholar]
- 33.Farha MA, Brown ED. Unconventional screening approaches for antibiotic discovery. Ann N Y Acad Sci. 2015;1354(1):54–66. doi: 10.1111/nyas.12803. [DOI] [PubMed] [Google Scholar]
- 34.Guimerà R, Sales-Pardo M. A network inference method for large-scale unsupervised identification of novel drug-drug interactions. PLOS Comput Biol. 2013;9(12):e1003374. doi: 10.1371/journal.pcbi.1003374. [DOI] [PMC free article] [PubMed] [Google Scholar]
- 35.Park M, Nassar M, Vikalo H. Bayesian active learning for drug combinations. IEEE Trans Biomed Eng. 2013;60(11):3248–3255. doi: 10.1109/TBME.2013.2272322. [DOI] [PubMed] [Google Scholar]
- 36.Weiss A, et al. Rapid optimization of drug combinations for the optimal angiostatic treatment of cancer. Angiogenesis. 2015;18(3):233–244. doi: 10.1007/s10456-015-9462-9. [DOI] [PMC free article] [PubMed] [Google Scholar]
- 37.Weiss A, et al. A streamlined search technology for identification of synergistic drug combinations. Sci Rep. 2015;5:14508. doi: 10.1038/srep14508. [DOI] [PMC free article] [PubMed] [Google Scholar]
- 38.Chou T-C. Theoretical basis, experimental design, and computerized simulation of synergism and antagonism in drug combination studies. Pharmacol Rev. 2006;58(3):621–681. doi: 10.1124/pr.58.3.10. [DOI] [PubMed] [Google Scholar]
- 39.Chou T-C. Drug combination studies and their synergy quantification using the Chou-Talalay method. Cancer Res. 2010;70(2):440–446. doi: 10.1158/0008-5472.CAN-09-1947. [DOI] [PubMed] [Google Scholar]
- 40.Hahn SM, et al. Taxol in combination with doxorubicin or etoposide. Possible antagonism in vitro. Cancer. 1993;72(9):2705–2711. doi: 10.1002/1097-0142(19931101)72:9<2705::aid-cncr2820720930>3.0.co;2-k. [DOI] [PubMed] [Google Scholar]
- 41.Huizing MT, et al. Taxanes: A new class of antitumor agents. Cancer Invest. 1995;13(4):381–404. doi: 10.3109/07357909509031919. [DOI] [PubMed] [Google Scholar]
- 42.Kroep JR, et al. Sequence dependent effect of paclitaxel on gemcitabine metabolism in relation to cell cycle and cytotoxicity in non-small-cell lung cancer cell lines. Br J Cancer. 2000;83(8):1069–1076. doi: 10.1054/bjoc.2000.1399. [DOI] [PMC free article] [PubMed] [Google Scholar]
- 43.Otwinowski J, Nemenman I. Genotype to phenotype mapping and the fitness landscape of the E. coli lac promoter. PLoS ONE. 2013;8(5):e61570. doi: 10.1371/journal.pone.0061570. [DOI] [PMC free article] [PubMed] [Google Scholar]
- 44.Schneidman E, Berry MJ, Segev R, Bialek W. Weak pairwise correlations imply strongly correlated network states in a neural population. Nature. 2006;440:1007–1012. doi: 10.1038/nature04701. [DOI] [PMC free article] [PubMed] [Google Scholar]
- 45.Lehár J, Krueger A, Zimmermann G, Borisy A. High-order combination effects and biological robustness. Mol Syst Biol. 2008;4:215. doi: 10.1038/msb.2008.51. [DOI] [PMC free article] [PubMed] [Google Scholar]
- 46.Zimmermann GR, Lehár J, Keith CT. Multi-target therapeutics: When the whole is greater than the sum of the parts. Drug Discov Today. 2007;12(1-2):34–42. doi: 10.1016/j.drudis.2006.11.008. [DOI] [PubMed] [Google Scholar]
- 47.Yeh PJ, Hegreness MJ, Aiden AP, Kishony R. Drug interactions and the evolution of antibiotic resistance. Nat Rev Microbiol. 2009;7(6):460–466. doi: 10.1038/nrmicro2133. [DOI] [PMC free article] [PubMed] [Google Scholar]
- 48.Cohen SP, Levy SB, Foulds J, Rosner JL. Salicylate induction of antibiotic resistance in Escherichia coli: Activation of the mar operon and a mar-independent pathway. J Bacteriol. 1993;175(24):7856–7862. doi: 10.1128/jb.175.24.7856-7862.1993. [DOI] [PMC free article] [PubMed] [Google Scholar]
- 49.Price CT, Lee IR, Gustafson JE. The effects of salicylate on bacteria. Int J Biochem Cell Biol. 2000;32(10):1029–1043. doi: 10.1016/s1357-2725(00)00042-x. [DOI] [PubMed] [Google Scholar]


