Significance
The normal prostate gland contains the most Zn(II) of all mammalian tissues, and there are marked differences in Zn(II) content between the healthy, malignant, and benign hyperplastic prostate. Given that multiparametric MRI does not always reliably distinguish between these tissue conditions, the release of Zn(II) ions from the prostate in response to an external stimulus may prove valuable as a specific biomarker of prostate cancer progression. In this work, we show that glucose stimulates the release of Zn(II) from intracellular stores in healthy prostate tissue and that Zn(II) secretion is reduced in a transgenic adenocarcinoma of the mouse prostate (TRAMP) model.
Keywords: prostate, cancer, glucose, zinc, MRI
Abstract
Many secretory tissues release Zn(II) ions along with other molecules in response to external stimuli. Here we demonstrate that secretion of Zn(II) ions from normal, healthy prostate tissue is stimulated by glucose in fasted mice and that release of Zn(II) can be monitored by MRI. An ∼50% increase in water proton signal enhancement is observed in T1-weighted images of the healthy mouse prostate after infusion of a Gd-based Zn(II) sensor and an i.p. bolus of glucose. Release of Zn(II) from intracellular stores was validated in human epithelial prostate cells in vitro and in surgically exposed prostate tissue in vivo using a Zn(II)-sensitive fluorescent probe known to bind to the extracellular surface of cells. Given the known differences in intracellular Zn(II) stores in healthy versus malignant prostate tissues, the Zn(II) sensor was then evaluated in a transgenic adenocarcinoma of the mouse prostate (TRAMP) model in vivo. The agent proved successful in detecting small malignant lesions as early as 11 wk of age, making this noninvasive MR imaging method potentially useful for identifying prostate cancer in situations where it may be difficult to detect using current multiparametric MRI protocols.
Divalent zinc [Zn(II)], the second most abundant metal in the human body, plays an important role in many cell-secretory mechanisms often stimulated by specific secretagogues. The most widely known example is the pancreatic β-cell where crystalline Zn(II)-insulin hexamers are packaged in granules and subsequently released into the interstitial space in response to an increase in blood glucose (1, 2). Zn(II) is also stored in granules in intestinal Paneth cells of the ileum which respond to pilocarpine by releasing Zn(II) into the intestines. It has been reported that a considerable amount of endogenous Zn(II) is secreted by gastrointestinal cells after a meal and that maintaining proper Zn(II) homeostasis in the intestines depends not only on absorption of a fraction of exogenous Zn(II) in food but also on reabsorption of a portion of the endogenous Zn(II) back into intestinal cells (3). Zn(II) has also been shown to exhibit a multifaceted role in the mammary glands, mainly serving as a regulator of matrix metalloprotease activity (2, 4). Although no known Zn(II) secretagogue has been identified in mammary glands, it has been shown that prolactin directly regulates the transcription and localization of the ZnT2 transporter (5) and that a mutation in the transporter results in a substantial reduction in total Zn(II) in breast milk (6).
The prostate is known to exhibit the highest amount of Zn(II) in mammalian tissue, ranging from ∼10 to 100 mM (7). It has been hypothesized that the high concentration of Zn(II) in prostatic fluid is necessary for optimal male fertility because of its antimicrobial effects (8) and its role in supporting sperm motility (9). The presence of Zn(II)-rich granules in prostate epithelial cells has been known for many years (10), but to the best of our knowledge, stimulation of Zn(II) secretion from the prostate by specific secretagogues has not been reported. Various studies have shown a clear disparity between Zn(II) levels in normal prostate epithelial cells and prostate cancer cells in rodents and humans (11, 12). There is an approximately sixfold decrease in Zn(II) content in prostate cancer tissue versus healthy prostate and benign prostatic hyperplasia (BPH) tissues (12).
The traditional diagnostic tests for a healthy prostate include a digital rectal examination and serum analysis of prostate specific antigen (PSA). As PSA levels rise above those established by recommended guidelines, an ultrasound-guided tissue biopsy is typically recommended. Deficiencies in this traditional approach have been demonstrated and have given rise to the expanding importance of MRI for the detection of prostate cancer (13, 14). Currently, T2-weighted MRI and multiparametric MRI (mpMRI) are widely used to characterize prostatic tissue that could potentially bear malignant lesions. However, it is still challenging to identify and characterize cancers in transition zones (TZ) compared with the peripheral zones (PZ). The morphologic T2-weighted features, subjective assessment of diffusion-weighted imaging (DWI), apparent diffusion coefficient (ADC) characteristics, and dynamic contrast enhanced (DCE) MRI all have recognized limitations when using mpMRI in the TZ (13, 15–17). Advancements in differentiating prostate lesions from BPH have been reported using DWI at 3 T with ultrahigh b values (>1000 s⋅mm−2) (18), but the sensitivity and accuracy of the method appears to vary considerably with differing b values (16). Moreover, the lack of consensus across centers regarding MRI protocols presents a substantial barrier for establishing standardized ADC cutoff values as a biomarker for prostate cancer evaluations (19). Therefore, the development of an imaging method to improve the specificity of early cancer detection remains a critical, albeit unmet, goal in prostate cancer diagnosis.
In this work, we present a diagnostic paradigm for detecting healthy prostate tissue by using a gadolinium-based contrast agent that shows an increase in r1 relaxivity in the presence of Zn(II) by forming a ternary complex with human serum albumin (HSA) (1). The surprising finding in this study was that glucose serves as a secretagogue to initiate Zn(II) release from prostate cells in fasted mice. Subsequently, this protocol was used to differentiate malignant prostate cells from healthy cells in a transgenic adenocarcinoma of the mouse prostate (TRAMP) model. This transgenic model features many advantages over orthotopic tumor models and has been widely used and accepted as an appropriate model for prostate cancer disease progression (20–24). We chose the TRAMP model as a robust framework because the transgene is specific to secreting epithelial cells (20) and localization of nascent malignant cells is mostly concentrated in the dorsolateral lobe (25), which is phenotypically similar to the human peripheral zone (26). Moreover, the spontaneous TRAMP model was convenient for following transformation of cells from normal to malignant prostate epithelial cells by MRI, thereby providing further insight into the possibility of using Zn(II) secretion as an imaging biomarker for early prostate cancer detection.
Results
MRI Detection of Zn(II) Secretion from the Healthy Prostate.
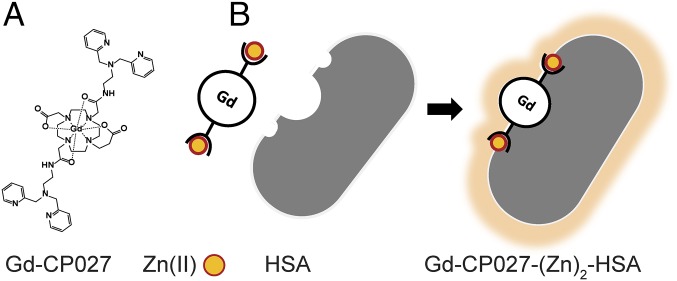
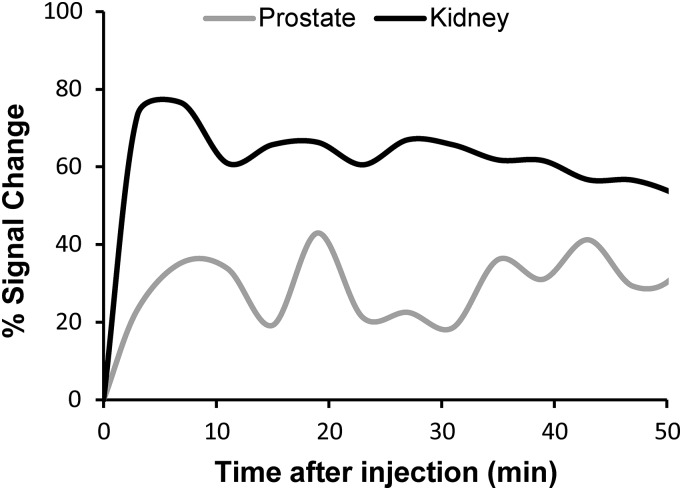
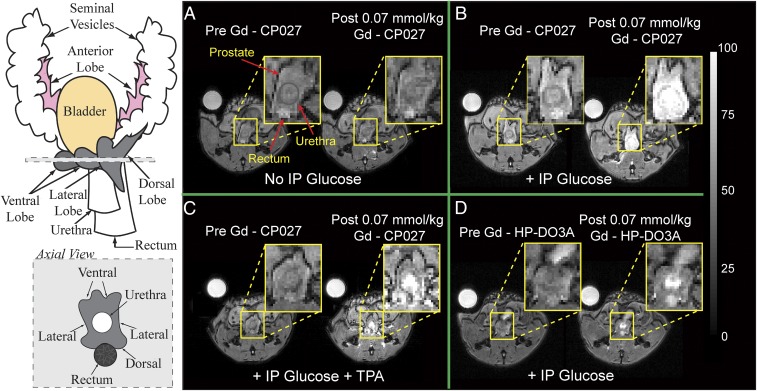
Previous work from our laboratory demonstrated that one can image insulin secretion from the mouse pancreas by detecting Zn(II) ions coreleased with insulin using a Gd-based MRI contrast agent (1). Given that the prostate has even higher levels of Zn(II) than the pancreas (27) and is known to secrete Zn(II) into seminal fluid, we examined the possibility of detecting this released Zn(II) by MRI. To test this, fasted C57BL6 male mice were imaged using a 3D T1-weighted sequence (B0 = 9.4 T) before and after an i.p. bolus injection of glucose [50 μL of 20% (wt/vol)] and i.v. injection of Gd-CP027 (0.07 mmol⋅kg−1). Gd-CP027 exhibits a modest r1 relaxivity of 5.6 ± 0.1 mM−1⋅s−1 in the absence of Zn(II) ions (Fig. 1A), but after formation of a ternary Gd-CP027–(Zn)2 complex and subsequent binding to HSA, the r1 relaxivity of the agent increases to 9.4 ± 0.2 mM−1⋅s−1 (B0 = 9.4 T) (Fig. 1B) (28). After injection of glucose and the agent, the mice were imaged sequentially over a period of ∼30 min or longer to follow contrast enhancement and washout of the agent from tissues (Fig. S1). Without coinjection of glucose, little contrast enhancement of the prostate was detected (9 ± 4%; Fig. 2A), but with a single bolus of glucose, the prostate image was dramatically enhanced (49 ± 5%; Fig. 2B). On average, the image intensity measured over the entire dorsolateral lobe postglucose injection was ∼30% higher than that measured over the entire ventral lobe.
Fig. 1.
Gd-based contrast agent mechanism for sensitive Zn(II) detection. (A) Gd-CP027 structure in its off configuration with a relaxivity of r1 = 5.6 mM−1⋅s−1 at B0 = 9.4 T and 6.4 mM−1⋅s−1 at B0 = 0.5 T. (B) Gd-based contrast agent binds to Zn(II) and forms a complex with human serum albumin (HSA) resulting in a change to its on configuration to form a highly sensitive MRI sensor with r1 = 9.4 mM−1⋅s−1 at B0 = 9.4 T and 48 mM−1⋅s−1 at B0 = 0.5 T.
Fig. S1.
Dynamic contrast measured as percent signal change in both prostate and kidney. Approximately 50% washout was observed at ∼60 min.
Fig. 2.
Magnetic resonance imaging at 9.4 T of the 12 h fasted mouse prostate. Left illustrates the anatomy of an adult mouse prostate and an axial view of the gland; each visible prostatic lobe is identified in the schematic representation and can be easily correlated to the in vivo images in A–D. Preinjection and postinjection of Gd-CP027 (A) without i.p. injection of d-glucose, showing no visible prostate enhancement, and (B) with simultaneous i.p. injection of d-glucose, resulting in a dramatic enhancement detected in the dorsolateral prostate as well as in the urethra. (C) IV injection of TPA 8–10 min before contrast agent. No substantial enhancement is observed in either the dorsolateral or ventral lobes. (D) Preinjection and postinjection of Gd-HPDO3A with i.p. injection of d-glucose indicating that a Zn(II) insensitive agent does not enhance prostate tissues. The urethra is intensely enhanced indicating contrast agent clearance.
Two additional experiments were performed to examine whether release of Zn(II) from prostate cells was the origin of these observations. First, in separate animals, an identical amount of Gd-HPDO3A [a non-Zn(II) responsive control MR agent] was used to examine whether glucose stimulates uptake of the contrast agent (CA) into prostate cells. Little enhancement was detected in the prostate, although the urethra and kidneys were enhanced to a similar extent as seen when using Gd-CP027 (Fig. 2D). Subsequently, the dose of Gd-HPDO3A was doubled to compensate for the lower r1 relaxivity [r1 = 3.0 mM−1⋅s−1, B0 = 9.4 T (29)] of this agent compared with Gd-CP027, but even at this higher agent concentration, images of the prostate were not enhanced by Gd-HPDO3A and glucose (Fig. S2). In a second set of experiments, the metal ion chelating agent, Tris(2-pyridylmethyl)amine (TPA), was injected before Gd-CP027 to test whether chelation of available Zn(II) in prostate cells would eliminate or reduce the image contrast produced by Gd-CP027. TPA is a neutral chelating agent (pKa 6.17) known to enter cells and bind with high affinity [KdZn(II) = 10 pM] to free Zn(II) ions (30). If release of free Zn(II) is the origin of the MRI enhancement produced by Gd-CP027 [KdZn(II) = 8 nM], then image contrast enhancement would be expected to be reduced in tissues first treated with TPA. As seen in Fig. 2C, contrast enhancement of the prostate was substantially reduced in animals that received TPA. This again supports the hypothesis that Zn(II) ions released from prostate cells in response to glucose can be detected by MRI using the Zn(II) sensor, Gd-CP027.
Fig. S2.
T1 weighted ge3d MRI (B0 = 9.4 T) of the non-Zn(II) responsive Gd-HP-DO3A injected at a dose of 0.14 mmol⋅kg−1 along with 50 µL of 20% (wt/vol) d-glucose. No significant accumulation/response to glucose in the prostate is observed. Top left circle shows water phantom used for normalization purposes.
The average contrast enhancement detected in prostate under six different experimental conditions (n = 5 in each group) is summarized in Table 1. Here the percentage (%) contrast enhancement reflects the average difference in MR image signal intensity in the dorsolateral and ventral lobes preadministration versus postadministration of glucose plus agent. These data are have several notable aspects. First, contrast enhancement of the prostate after injection of saline plus Gd-CP027 (9 ± 4%) did not differ substantially from that seen with glucose plus Gd-HPDO3A (14 ± 4%). Such small (∼5%) enhancement differences can be attributed to minor differences in the r1 values of these two agents in tissues. Both values reflect the enhancement expected for a low-molecular weight agent equally distributed in the extracellular space of prostate tissue. Second, the contrast enhancement detected upon injection of glucose plus Gd-CP027 depended on the nutritional state of the animals varying from ∼14 ± 2% in fed mice, to 31 ± 4% in 7 h fasted mice, to 49 ± 5% in 12 h fasted mice. This indicates that excess glucose given to fed animals does not stimulate further release of Zn(II) ions from prostate cells and that the release of Zn(II) ions varies with the extent of fasting. Based on these results, one can conclude that there is a strong correlation between sudden increase in blood glucose and Zn(II) release from stored vesicles in prostate cells and that this functional response is readily detected by Gd-CP027 in vivo.
Table 1.
Quantified prostate tissue signal enhancement from in vivo MRI
| Contrast agent (CA) | Glucose bolus | Percent signal enhancement of prostate after CA |
| Gd-CP027 | (+) | 14 ± 2** |
| Gd-CP027 | (+) | 31 ± 4* |
| Gd-CP027 | (+) | 49 ± 5 |
| Gd-CP027 | (−) | 9 ± 4** |
| Gd-CP027 | (+), TPA | 13 ± 4** |
| Gd-HPDO3A | (+) | 14 ± 4** |
All values were compared with the 12-h fasted group, *P < 0.03, **P < 0.003. Percent signal enhancement of prostate after CA is reported as average ± SEM.
In Vivo and in Vitro Fluorescence Imaging of Prostate and Normal Prostatic Epithelial Cells.
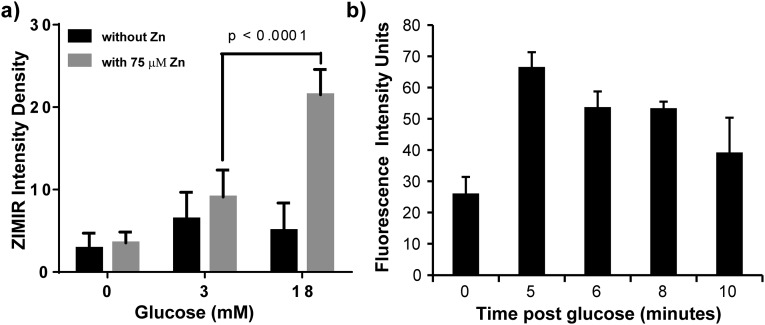
To further validate glucose-stimulated Zn(II) secretion from prostate cells, a Zn(II)-responsive fluorescent probe (ZIMIR) that localizes to the exterior of cellular membranes (31) was injected directly into the exposed mouse prostate before injection of glucose. The prostate was exposed by performing an incision in the abdomen and removing surrounding tissues. After injecting ZIMIR into the tissue (Fig. 3A), the fasted animal was positioned onto the bed of a fluorescence microscope with the optics positioned directly on the exposed prostate. As shown in Fig. 3B, the prostate tissue displayed only weak fluorescence due to residual Zn(II) before addition of d-glucose, but intense fluorescence (150% increase in fluorescence signal) was displayed 5 min post-i.p. glucose (Fig. S3). This behavior is characteristic of tissues that secrete excess Zn(II) ions from cells stimulated by extracellular glucose (31).
Fig. 3.
Zn(II) secretion can be observed both in vivo and in vitro using the Zn(II)-responsive fluorescent probe, ZIMIR. (A) (Left) The two lipophilic chains on ZIMIR provide a mechanism for anchoring to the fluorescent agent to the extracellular surface of cells. (Right) In vivo experimental scheme showing placement of the microscope lens directly over the exposed prostate gland of a mouse after local administration of ZIMIR to the tissue. (B) In vivo confocal images of the prostate before (Left) and after (Right) i.p. injection of d-glucose. (C) In vitro fluorescence images of prostate epithelial cells (RWPE-1) grown in a low-glucose medium without (Left) or with (Right) 75 µM ZnSO4. The cells were then removed from the culture medium and washed with buffer, and 1 μM ZIMIR was added to coat the outer surface of the cells to detect release of Zn(II) from intracellular stores. As shown, cells not incubated with ZnSO4 did not release Zn(II) in response to glucose (Left), whereas cells that had accumulated substantial Zn(II) during incubation did release Zn(II) in response to glucose in a concentration-dependent manner.
Fig. S3.
(A) In vitro glucose-stimulated Zn(II) secretion in normal prostate epithelial cells (RWPE-1). Three different ROIs containing two cells were selected at random and measured for each treatment. Statistical significance was evaluated at a 95% confidence level. (B) In vivo confocal of exposed mouse prostate. Three ROIs were selected within the tissue field of view, ROIs placed at areas of highest intensity for each time point.
Glucose-stimulated Zn(II) secretion was also confirmed in normal human prostate epithelial cells, RWPE-1, grown in tissue culture (Fig. 3C). To simulate fasting in vitro, the cells were starved of glucose by using low-glucose (3 mM) culture medium before the experiment but were supplemented with 75 µM ZnSO4 to provide an ion reserve for subsequent secretion. After the cells were washed with secretion assay buffer (SAB) and the fasting medium was replaced with zinc-free buffer containing ZIMIR, a small but detectable green fluorescence was detected after the cells were exposed to 3 mM glucose, but an ∼300% increase in green fluorescence was observed after exposure to 18 mM glucose (Fig. S3). These results support the hypothesis that image enhancement detected in prostate tissue by MRI does indeed reflect Zn(II) secretion from prostate cells and that this secretion is stimulated by glucose in a concentration-dependent manner. Taken in concert, the in vitro and in vivo results demonstrate that glucose does indeed act as a Zn(II) ion secretagogue in the mouse prostate.
MRI Detection of Zn(II) Secretion from Prostate of TRAMP Mice.
To test whether Zn(II) secretion as monitored by MRI could be used as a biomarker of prostate cancer progression, a group of TRAMP mice were also studied. Mice were initially imaged upon arrival at 7–11 wk of age and subsequently every 1–2 wk to monitor disease progression. In the TRAMP model, mice develop progressive forms of prostatic disease starting from mild intraepithelial neoplasia (PIN) to large multinodular malignant neoplasia. The onset of adenocarcinoma typically occurs at 24 wk of age, mostly arising in the dorsolateral lobes of the prostate. Fig. 4A shows images of three representative mice at various time points during development of prostate cancer before and after injection of glucose and Gd-CP027. Glucose-stimulated contrast enhancement (GSCE) in young TRAMP mice before development of cancer was 40 ± 4%, not significantly different from that measured in healthy C57Bl6 cohorts. Once nascent well-differentiated (WD) tumors began to develop, GSCE averaged over the entire gland decreased about twofold to 21 ± 7%. In those animals that developed large poorly differentiated (PD) tumors, GSCE dropped further to 7 ± 9%. In the latter group, the large variation in GSCE reflects the wide variation in tumor size in those animals. These results suggest progressive loss of zinc secretion from cells undergoing transformation, consistent with previous reports of approximately sixfold decrease in total zinc in prostate cancer tissue (32).
Fig. 4.
(A) Glucose-stimulated contrast enhanced (GSCE) T1-weighted 3D MR images at 9.4 T of the prostate of TRAMP mice during various stages of tumor development. (Bottom) A typical GSCE pattern of normal healthy prostate in a young TRAMP mouse (age: 10 wk). (Middle) Nascent tumor in dorsal lobe of the prostate showing clear hypointensity due to the presumable lack of intracellular Zn(II) (age: 17 wk). (Top) Poorly differentiated (PD) tumor that originated in lateral lobe and extending to ventral lobe. No GSCE was detected in the tumor, and significant loss of noncancerous prostate was observed (age: 19 wk). Intensity scale bar represents units normalized to highest image intensity as 100%. (B) Average GSCE measured over the entire prostate in three cohorts of animals. P values at the 95% confidence level for NNo lesion = 20, NWD= 5, and NPD = 2.
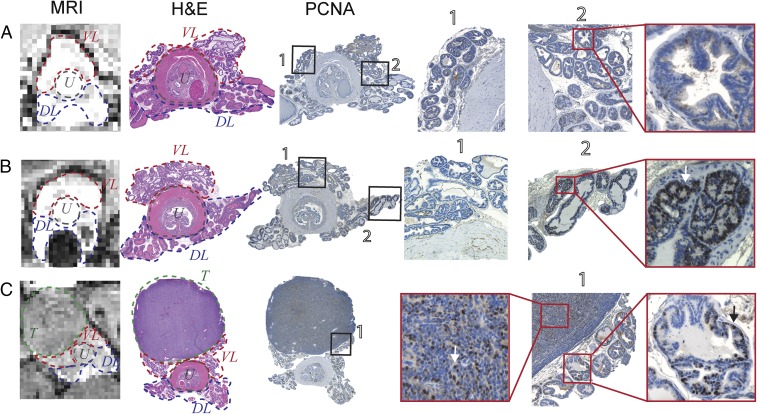
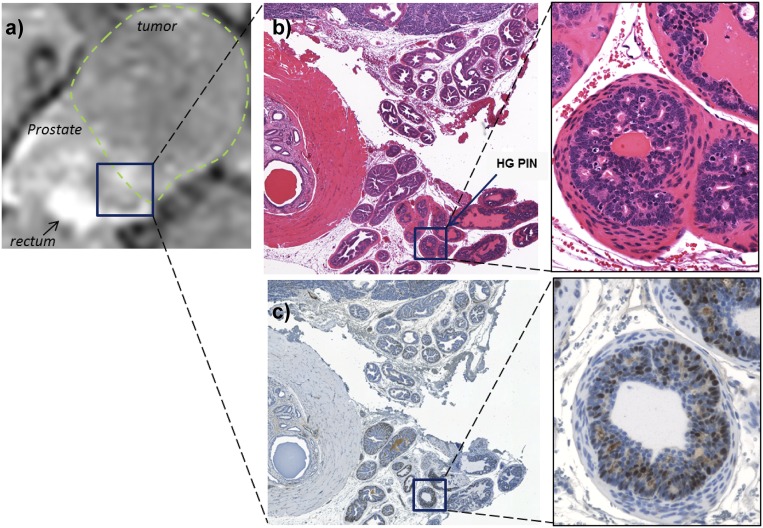
Prostate tissues from mice with no evidence of cancer (uniformly high GSCE), small hypointense lesions identified as WD tumors, and large PD tumors were resected and analyzed using standard immunohistochemistry. Fig. 5A shows the GSCE image of the prostate of a young TRAMP mouse. After removal and fixation, the prostate was sectioned axially to approximately align with the MRI slice. Those slices were stained with hematoxylin and eosin (H&E) and with the proliferating cell nuclear antigen (PCNA), a common antigen used to detect cell proliferation (33). PCNA is a nuclear protein expressed in the S phase of the cell cycle; as such, accumulation of the protein in the nucleus can translate to high proliferative activity of the respective cells (34). As shown, no PCNA-positive regions were observed in those slices. Fig. 5B shows the prostate of a representative mouse from a cohort classified to have a WD tumor defined as a small hypointense region in the GSCE image, presumably due to decreased Zn(II) secretion. In those tissues, PCNA staining provided early signs of malignant tumor development as shown in the dorsolateral lobe (DL, ROI 2) on the right side of the urethra. In comparison, the ventral lobe (VL, ROI 1) in this same animal remained PCNA negative. Finally, in a representative animal bearing a PD tumor (Fig. 5C), the GSCE image showed substantially lower intensity not only in the tumor but also throughout the remaining prostate. The H&E stain show regions of high-grade prostatic intraepithelial neoplasia (Fig. S4), whereas the tumor and acinar cells stained positively for PCNA. These combined results indicate that glucose stimulates release of Zn(II) from intracellular storage compartments in noncancerous epithelial prostate cells in vivo and that this release can be detected by GSCE MRI in healthy mice and in TRAMP mice during progressive stages of disease.
Fig. 5.
(A) The 3D T1-weighted image of a representative young TRAMP mouse showing no distinguishable hypointense regions in prostate after administration of glucose and Gd-CP027. H&E and PCNA immunostaining and Hematoxylin counterstain show no positive PCNA stain and only hematoxylin stained nuclei (ROI 2) correlating with normal proliferative activity. Lobes identified in MRI and H&E as the ventral lobe (VL), dorsolateral lobe (DL), and urethra (U). (B) Distinguishable hypointense region in DL after glucose and Gd-CP027 injection indicates local loss of zinc and potential malignant transformation. H&E stained section of prostate with labeled VL and DL on both sides of the urethra. PCNA of adjacent prostate section shows a spectrum of positive nuclear stain. Positive localized PCNA identified on both DLs, with one extension being predominantly more prevalent. VL shows negative PCNA stain (ROI 1) compared with evident positive stain in DL (ROI 2). (C) PD tumor stemming from lateral/ventral lobe. H&E and PCNA stains distinguish large PD tumor (T) clearly, PCNA-positive stain is observed throughout DLs of the prostate. Arrows indicate examples of cells undergoing increased proliferative activity based on positive-PCNA stain.
Fig. S4.
(A) T1-weighted MRI of a large poorly differentiated tumor bearing prostate after GSCE with Gd-CP027. Rectangle shows dorsal lobe with minimal signal enhancement. (B) H&E stain showing dorsal lobe with identified high-grade PIN areas at 20× and 40× . (C) PCNA stain of same region as in H&E showing positive PCNA indicative of malignant transformation at 20× and 40×.
Discussion
Zinc(II) ions play a key role in virtually all secretory tissues including pancreatic, mammary, intestinal, and prostatic tissues (2, 35). In normal prostate epithelial cells, excess Zn(II) ions limit oxidation of citrate in the TCA cycle by inhibiting m-aconitase (36). It is well known that intracellular and extracellular Zn(II) transport is facilitated largely by transporters of the ZIP and ZnT families (37), but external stimulation of Zn(II) release from intracellular stores in the prostate has not been reported. In experiments described herein, a Zn(II)-responsive MRI contrast agent was used to detect Zn(II) release from the healthy mouse prostate in T1-weighted images. A structural analog of this agent was previously used to detect Zn(II) release from mouse pancreatic β cells during insulin secretion stimulated by glucose (1, 38). Like the agent used to detect insulin secretion, the ternary complex formed between Gd-CP027 and two Zn(II) ions subsequently binds with albumin, and this binding event results in a decrease in T1 of water protons and substantial contrast enhancement as detected by T1-weighted MRI. The r1 relaxivity of Gd-CP027 bound to albumin is field-dependent, varying from 48 mM−1⋅s−1 at 0.5 T to 31 mM−1⋅s−1 at 1.5 T to 9.4 mM−1⋅s−1 at 9.4 T. Given that GSCE of the prostate was substantial (up to 50%) when measured at 9.4 T using 0.07 mmol⋅kg−1 agent, one would predict that GSCE of the prostate will be substantially higher at 1.5 T. This also suggests that the agent dose could be reduced by 50% or more without loss of detectable GSCE at 1.5 T. These estimates indicate that translation of this technology to humans for early detection of prostate cancer is a real possibility using clinically relevant doses of Gd-CP027. This, of course, assumes that the healthy human prostate releases similar levels of Zn(II) ions as seen here in mice.
Given that tissue levels of free unbound extracellular Zn(II) are typically in the 20–40 µM range (39, 40), one can estimate that upon i.v. injection of 0.07 mmol⋅kg−1 Gd-CP027, most of the available and circulating free Zn(II) is bound to Gd-CP027. However, in those tissues that secrete Zn(II) in response to a physiological or metabolic signal such as glucose in the pancreas, additional Zn(II) is released from intracellular stores, and this initiates the cascade of binding events (i.e., binding to Gd-CP027 and subsequently to albumin) that leads to detectable image contrast enhancement. Thus, responsive agents such as these that turn on or brighten an image when Zn(II) is released provide an opportunity to monitor Zn(II) secretion in a variety of tissues in vivo using MRI.
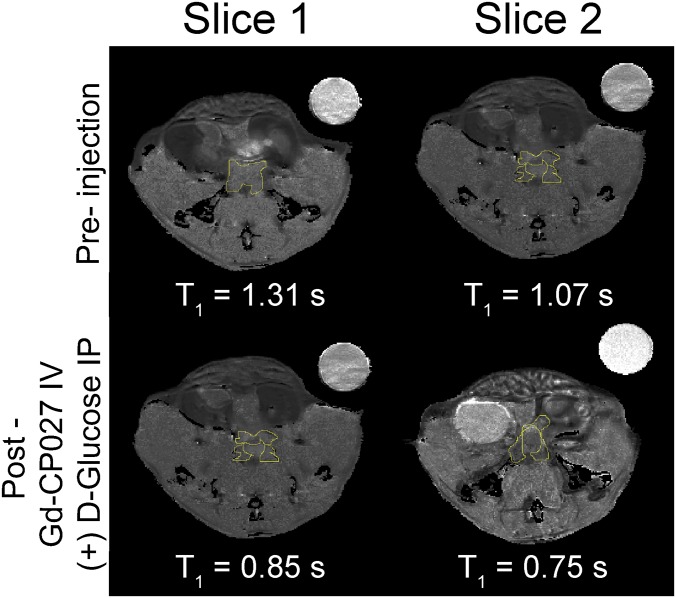
Detection of Zn(II) release from the prostate by contrast enhanced MRI in response to glucose was indeed unexpected. Although is it well known that Zn(II) is secreted from prostate cells into the seminal fluid, it was surprising to find that Zn(II) secretion in the mouse prostate was, much like the pancreas, also stimulated by glucose. The imaging data suggest that Zn(II) is secreted into the interstitial space surrounding prostate cells where it comes into direct contact with Gd-CP027 and albumin. A T1 map of the prostate post-glucose stimulation provided a rough estimate of the concentration of Gd-CP027 in this extracellular space (44 µM) after Zn(II) release (Fig. S5). This, of course, assumes that the r1 relaxivity of the GdL–(Zn)2 complex bound to albumin in vivo is identical to the r1 of the complex measured in vitro. Given that the total Zn(II) concentration in the various lobes of prostate have been shown to be in the ∼mM range, the amount detected by Gd-CP027 in this extracellular compartment (∼44 µM) must be limited by the amount of agent that reaches that compartment and not necessarily by the total amount of Zn(II) released in response to glucose. There could be considerably more Zn(II) released from prostate cells into the space occupied by the agent, but because the agent can only bind two equivalents of Zn(II) per mole, any excess Zn(II) above 44 µM would remain undetected. Thus, this imaging method does not detect total tissue Zn(II) but rather detects only a small fraction of the total Zn(II) secreted from cells in response to glucose.
Fig. S5.
T1 map of pre– and post–Gd-CP027 IV and d-glucose i.p. T1 measurements of ROIs from each slice with FLAIR pulse sequence TE/TR = 10/4,000 ms; NEX = 1; TI = 10, 50, 75, 100, 500, 750, 1,500, and 2,500 ms; and k zero = 1. Water phantom is shown in upper right corner. B0 = 9.4 T.
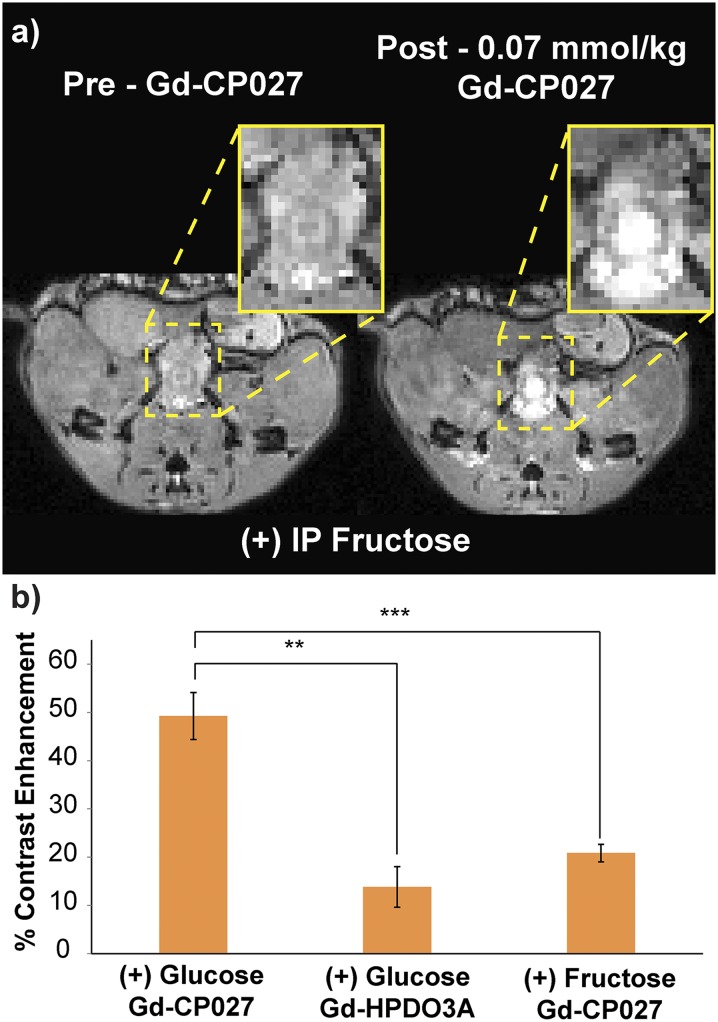
Stimulation of Zn(II) release from the prostate by glucose was not detected in mice exposed to chow ad libitum but was evident in mice fasted for a period of 7 h before imaging. This suggests that Zn(II) release is stimulated by a sudden increase in glucose and does not occur at physiological levels of plasma glucose. This effect was also confirmed with direct fluorescence imaging of the exposed prostate in vivo and in prostate cells grown in tissue culture. In the in vivo experiments, it appears that the mice do not require an additional source of Zn(II) beyond that available to them in their chow. The in vitro cell experiments did require a supplement of ZnSO4, presumably to ensure proper intracellular packaging of Zn(II), before secretion of Zn(II) could be detected using the fluorescent agent, ZIMIR. Like the in vivo observations, the cells secreted Zn(II) only after addition of at least 3 mM glucose to the cell medium. A more intense fluorescence signal was produced by 18 mM glucose, showing that Zn(II) secretion is also sensitive to the concentration of glucose in the extracellular medium similar to that seen in vivo. The stimulatory effect of glucose appears to be quite specific because it does not occur when fructose is substituted for glucose (Fig. S6). This finding suggests that the secretion mechanism is glucose-specific and driven by glucose transporters.
Fig. S6.
MR imaging of male C57bl6 mice fasted for 12 h. (A) Preinjection and postinjection of Gd-CP027 IV and 50 µL of 20% (wt/vol) fructose i.p. The dorsolateral prostate shows marginal enhancement, whereas the urethra and the rectum show the most enhancement. (B) Fructose increased contrast in the prostate up to 20%, only slightly above Gd-HPDO3A, whereas d-glucose increases contrast in the prostate up to ∼50%. **P = 0.0026, ***P = 0.0025. Error bars indicate the SEM for n = 4.
Normal prostate epithelial cells contain high concentrations of mitochondrial and cytoplasmic Zn(II) and citrate (36). As noted, high levels of Zn(II) are known to inhibit m-aconitase activity and subsequent oxidation of citrate in the TCA cycle in the healthy prostate (11, 36, 41). Prostate cancer epithelial cells, however, have lower levels of Zn(II), presumably due to silencing of a zinc influx transporter, ZIP1, and as a result those cells are able to oxidize citrate (42). Although this hypothesis represents the most logical theory in the relationship of metal homeostasis, metabolism, and prostate cancer, our results suggest that further studies are required to better understand the interplay between glucose, zinc transport, and availability in normal and malignant prostate cells.
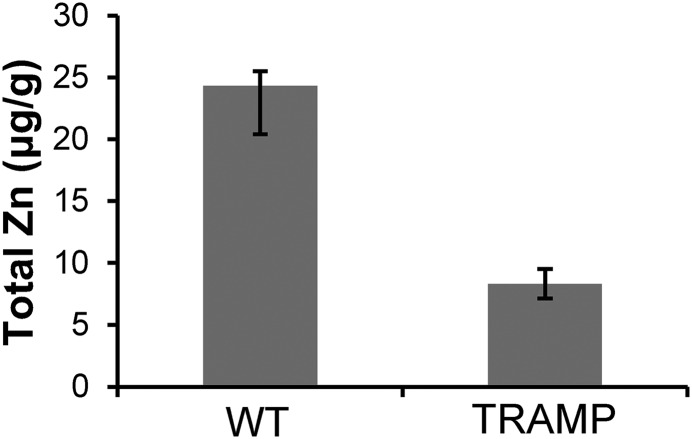
In an effort to investigate deeper the potential for tissue discrimination, we used the TRAMP model as a feasibility assessment for differentiating prostate cancer cells from healthy cells based upon release of Zn(II). Our results summarized in Fig. 4A show that a clear distinction between malignant and healthy cells can be made as early as 11 wk of age. The percent signal enhancement in the hypointense malignant region is almost 16-fold lower compared with noncancerous prostate tissue. This substantial decrease is observable and evidently detectable by MRI. This is not the first time that the spectrum of disease has been monitored on the basis of zinc content using a TRAMP model. An optical sensor was previously used, and significant differences in epifluorescence were detectable at 19 wk of age (43). TRAMP WD and PD development has also been monitored using DWI and ADC, and significant ADC differences were found as early as 12 wk of age for WD tumor-bearing mice and 16 wk of age for PD-bearing mice (44). As shown here, Gd-CP027 detects malignant lesions as early as 11 wk and also provides excellent spatial resolution. Using these noninvasive measurements, the combination of DWI, ADC, and GSCE may be able to stratify lesions with high accuracy and resolution. Considering the current diagnostic paradigm, having the capability of identifying small malignant lesions also gives the option for a much more targeted biopsy as a final confirmation if needed. Our histological studies presented in Fig. 5 provide strong evidence that the lesions identified by GSCE correspond to prostate cells undergoing malignant transformation. Furthermore, tissues displaying a spectrum of low- to high-grade PIN and atypia in H&E but expressing high levels of PCNA showed significant signal hypointensities in GDCE images suggesting that the method is specific for detection of malignant cells (Fig. S4). Additionally, measurements of whole prostate zinc content using destructive ICP-MS in TRAMP mice of 25 wk of age resulted in a threefold decrease compared with wild-type C57BL/6 mice (Fig. S7). This confirms loss of zinc secretion in prostate malignant lesions as identified by MRI. Capitalizing on the previously demonstrated sixfold decrease in zinc content in normal human prostate versus prostate cancer tissues, the present experiments illustrate that glucose-stimulated Zn(II) release from secretory prostate cells may provide a new and more specific diagnostic method to differentiate the noncancerous prostatic tissue from prostate cancer.
Fig. S7.
Total zinc measurements from wild-type (C57BL/6) and TRAMP mice at 25 wk of age exhibiting suspicious lesions and increased prostate volume (n = 3). A threefold decrease in zinc content was found for the TRAMP prostates compared with WT.
Materials and Methods
Synthesis.
Gd-CP027 was prepared using published procedures by coupling two Zn(II) binding moieties to a 1,7-diprotected DO2A (28). Deprotection and complexation with Gd(III) afforded the target molecule, which was then subjected to extensive preparative HPLC purification. After purification and purity validation by liquid chromatography–mass spectrometry (LC-MS), the compound was lyophilized and stored at −20 °C.
In Vivo MRI.
All animal experiments were performed according to guidelines approved by The University of Texas Southwestern Medical Center Institutional Animal Care and Use Committee. Six- to eight-week-old C57BL/6 male mice were obtained and anesthetized with isofluorane and catheterized via the tail vein. The general imaging protocol consisted of two preinjection 3D T1-weighted gradient-echo scans (FA/TE/TR = 20°/1.69/3.34 ms, NEX 4, Matrix 128 × 128 × 128) using a 9.4 T Varian MRI scanner. After an i.p. injection of 50 µL of 20% (wt/vol) d-glucose, Gd-CP027 was given as a slow bolus via a tail vein catheter (a 25 mM stock solution of Gd-CP027 was infused at 70 µL⋅min−1 over 1.5 min to yield a final total dose of 0.07 mmol⋅kg−1). Immediately after infusion of the agent was completed, a series of 3D T1-weighted scans (each scan taking 3 min and 49 s) of the entire prostate gland were collected.
Seven groups of CB57BL/6 male mice (n = 5 per group) were imaged under the general imaging protocol with the following modifications: Group 1 consisted of mice fed ad libitum. Group 2 mice were fasted for 7 h before imaging, whereas groups 3–7 were fasted for 12 h before imaging. Group 4 mice did not receive glucose before injection of Gd-CP027, whereas Group 5 mice received glucose plus a 50 µL (10 mM) injection of the Zn(II) chelator, TPA, 8–10 min before infusion of Gd-CP027. Groups 6 and 7 received glucose plus 0.07 mmol⋅kg−1 and 0.14 mmol⋅kg−1 of Gd-HPDO3A (Prohance, Bracco Diagnostics), respectively. Successful injection of CA was confirmed by observing consistent enhancement of the kidneys and no excess accumulation of CA at the site of injection.
Twenty-seven TRAMP mice of the strain C57BL/6-Tg(TRAMP)8247Ng/J were purchased from Jackson Laboratories at 7–11 wk of age and an average weight of 20–25 g. The animals were imaged upon arrival following the same imaging protocol indicated above and every 1–2 wk subsequently until killed for tissue analysis. Mice were categorized as no lesion, well-differentiated (WD) tumor, and poorly differentiated (PD) tumor and were killed at different time points depending on the category.
All images were quantified and analyzed using Image J (National Institutes of Health) as follows: User-defined regions of interest were electronically generated in the dorsolateral and ventral lobes to measure the signal intensity on images obtained before injection and again 3–7 min after injection of d-glucose and Gd-CP027. The values were normalized to the signal intensity obtained from a water phantom placed on the mouse abdomen during imaging. Contrast enhancement is defined as %. Percent contrast enhancement in overall prostate tissue (dorsolateral and ventral lobes) was quantified and compared across the groups. Statistical difference was evaluated using a P value calculated from a t score obtained by comparing the means with a two-tailed t test at a 95% confidence level.
In Vivo Confocal Fluorescence Imaging of Mouse Prostate.
A Zn(II)-responsive fluorescence probe, ZIMIR, used as a Zn(II) indicator for monitoring induced exocytotic release was used to test the hypothesis that d-glucose stimulates Zn(II) release from the prostate (31). The prostate of a fasted C57BL/6 mouse was surgically exposed, and ZIMIR was suspended in a secretion assay buffer (SAB) containing 114 mM NaCl, 4.7 mM KCl, 1.2 mM KH2PO4, 2.5 mM CaCl2, 1.16 mM MgSO4, 3 mM d-glucose, 20 mM Hepes (pH 7.4), 2 µM dipicolylamine N-ethylsulfonate (DPAS), and food coloring (1:100 dilution) to form a final compound concentration of 20 µM. The ZIMIR mixture was injected using a glass-pulled needle directly into the prostate until a droplet (0.02–0.03 µL) was observed to perfuse through the ducts of the gland. This process was repeated five to seven times in the same location. The injection site was then covered with a coverslip, and the mouse was transferred to a confocal microscope. The lens was placed directly on the coverslip, and a series of baseline fluorescence emission images (515 nm) were collected. Fifty microliters of 20% (wt/vol) d-glucose was then injected i.p., and additional images were collected after 5 min.
In Vitro Epifluorescence Imaging of Normal Prostate Epithelial Cells.
Normal prostate epithelial cell lines (RWPE-1) were obtained from ATCC (American Type Culture Collection) and maintained in keratinocyte serum-free medium (K-SFM) (ThermoFisher) supplemented with bovine pituitary extract (BPE) and human recombinant epidermal growth factor (EGF). For the cells with zinc treatment, 75 µM ZnSO4 was added directly to the medium for 72 h at 37 °C before the study. Cells were cultured in 35-mm petri dishes with glass bottoms (MatTek). To label cells with ZIMIR, the culture medium was removed, and the cells were washed with SAB buffer. ZIMIR was added to cells to a final concentration of 1 μM along with nucleus staining solution, NucBlue Live ReadyProbes Reagent (ThermoFisher). Cells were then incubated at room temperature for 20 min and washed with SAB before the glucose challenge. To image Zn(II) secretion in response to glucose, SAB with various concentrations of glucose (0, 3, and 18 mM) along with 10 μM EDTA [to reduce residual Zn(II)] and 2 μM DPAS (to enhance the signal sensitivity). Epifluorescence images were obtained with an inverted Nikon wide-field fluorescence microscope.
Histology and Immunostaining for Proliferating Cell Nuclear Antigen.
Mouse prostates were dissected and fixed in 10% (vol/vol) phosphate buffered formalin for 24 h and transferred to PBS. Tissue samples were sectioned for five successive layers at 10-µm intervals and processed for H&E staining. Immunohistochemical staining was performed as follows: After deparaffinization with EZ DeWax Solution (BioGenex), the antigen was unmasked by heating samples by microwave oven in AR Citra Plus Solution (BioGenex). Endogenous peroxidase activity was inhibited using Hydrogen Peroxide Blocking Reagent (Abcam). Samples were then treated with PBS with 0.5% Triton-X100 (PBST) for permeabilization at room temperature for 15 min and blocked with 2% donkey serum with 0.01% BSA in TBST at room temperature for 1 h. Samples were incubated with mouse monoclonal anti-PCNA antibody (1:200; EMD Millipore) at 4 °C overnight. After washing in TBST three times, the samples were incubated in HRP-conjugated donkey anti-mouse IgG (H&L) (1:400; Abcam) at room temperature for 1 h. The staining signal was developed and visualized with 3,3′-diaminobenzidine at room temperature for 2 min and counterstained with Mayer’s hematoxylin solution (Sigma) at room temperature for 10 min. Tissues were then mounted and the slides were scanned by a Keyence BZ-X700 (Keyence).
Inductively Coupled Plasma–Mass/Atomic Emission Spectrometry.
A total of three prostates were resected from wild-type C57BL6 mice and 25-wk-old TRAMP exhibiting prostate growth and hypointense regions after GSCE imaging. The prostates were weighed and placed in a glass container, sealed, and immediately sent for acid digestion. Galbraith laboratories (Knoxville, TN) digested and measured zinc content by comparing to an external zinc standard and reported the result as total zinc (μg/g) for each sample.
Acknowledgments
We thank Dr. Jer-Tsong Hsieh from the Department of Urology at The University of Texas Southwestern Medical Center for tissue scanning support and Preston Christensen from the Department of Radiology at The University of Texas Southwestern Medical Center for assistance with inductively coupled plasma–mass/atomic emission spectrometry measurements. Partial financial support of this work was provided by the National Institutes of Health (P41-EB015908, R01-DK095416, and R01-GM077593), the Harold C. Simmons Cancer Center through the National Cancer Institute Cancer Center Support Grant 1P30-CA142543, the American Diabetes Association (7-12-MN-76 and 7-12-IN-42), Juvenile Diabetes Research Foundation (17-2013-494), and the Robert A. Welch Foundation (AT-584).
Footnotes
Conflict of interest statement: A.D.S., W.-H.L., and C.P. have a financial interest in VitalQuan, LLC.
This article is a PNAS Direct Submission. R.W. is a Guest Editor invited by the Editorial Board.
This article contains supporting information online at www.pnas.org/lookup/suppl/doi:10.1073/pnas.1609450113/-/DCSupplemental.
References
- 1.Lubag AJ, De Leon-Rodriguez LM, Burgess SC, Sherry AD. Noninvasive MRI of β-cell function using a Zn2+-responsive contrast agent. Proc Natl Acad Sci USA. 2011;108(45):18400–18405. doi: 10.1073/pnas.1109649108. [DOI] [PMC free article] [PubMed] [Google Scholar]
- 2.Kelleher SL, McCormick NH, Velasquez V, Lopez V. Zinc in specialized secretory tissues: Roles in the pancreas, prostate, and mammary gland. Adv Nutr. 2011;2(2):101–111. doi: 10.3945/an.110.000232. [DOI] [PMC free article] [PubMed] [Google Scholar]
- 3.Krebs NF. Overview of zinc absorption and excretion in the human gastrointestinal tract. J Nutr. 2000;130(5S Suppl):1374S–1377S. doi: 10.1093/jn/130.5.1374S. [DOI] [PubMed] [Google Scholar]
- 4.Wiseman BS, et al. Site-specific inductive and inhibitory activities of MMP-2 and MMP-3 orchestrate mammary gland branching morphogenesis. J Cell Biol. 2003;162(6):1123–1133. doi: 10.1083/jcb.200302090. [DOI] [PMC free article] [PubMed] [Google Scholar]
- 5.Seo YA, Lee S, Hennigar SR, Kelleher SL. Prolactin (PRL)-stimulated ubiquitination of ZnT2 mediates a transient increase in zinc secretion followed by ZnT2 degradation in mammary epithelial cells. J Biol Chem. 2014;289(34):23653–23661. doi: 10.1074/jbc.M113.531145. [DOI] [PMC free article] [PubMed] [Google Scholar]
- 6.Qian L, Lopez V, Seo YA, Kelleher SL. Prolactin regulates ZNT2 expression through the JAK2/STAT5 signaling pathway in mammary cells. Am J Physiol Cell Physiol. 2009;297(2):C369–C377. doi: 10.1152/ajpcell.00589.2008. [DOI] [PMC free article] [PubMed] [Google Scholar]
- 7.Györkey F, Min KW, Huff JA, Györkey P. Zinc and magnesium in human prostate gland: Normal, hyperplastic, and neoplastic. Cancer Res. 1967;27(8):1348–1353. [PubMed] [Google Scholar]
- 8.Edström AM, et al. The major bactericidal activity of human seminal plasma is zinc-dependent and derived from fragmentation of the semenogelins. J Immunol. 2008;181(5):3413–3421. doi: 10.4049/jimmunol.181.5.3413. [DOI] [PMC free article] [PubMed] [Google Scholar]
- 9.Yoshida K, et al. Physiological roles of semenogelin I and zinc in sperm motility and semen coagulation on ejaculation in humans. Mol Hum Reprod. 2008;14(3):151–156. doi: 10.1093/molehr/gan003. [DOI] [PubMed] [Google Scholar]
- 10.Chandler JA, Timms BG, Morton MS. Subcellular distribution of zinc in rat prostate studied by x-ray microanalysis: I. Normal prostate. Histochem J. 1977;9(1):103–120. doi: 10.1007/BF01007013. [DOI] [PubMed] [Google Scholar]
- 11.Costello LC, Franklin RB. Novel role of zinc in the regulation of prostate citrate metabolism and its implications in prostate cancer. Prostate. 1998;35(4):285–296. doi: 10.1002/(sici)1097-0045(19980601)35:4<285::aid-pros8>3.0.co;2-f. [DOI] [PubMed] [Google Scholar]
- 12.Zaichick VYe, Sviridova TV, Zaichick SV. Zinc in the human prostate gland: Normal, hyperplastic and cancerous. Int Urol Nephrol. 1997;29(5):565–574. doi: 10.1007/BF02552202. [DOI] [PubMed] [Google Scholar]
- 13.Hoeks CM, et al. Transition zone prostate cancer: Detection and localization with 3-T multiparametric MR imaging. Radiology. 2013;266(1):207–217. doi: 10.1148/radiol.12120281. [DOI] [PubMed] [Google Scholar]
- 14.Costa DN, Pedrosa I, Donato F, Jr, Roehrborn CG, Rofsky NM. MR imaging-transrectal US fusion for targeted prostate biopsies: Implications for diagnosis and clinical management. RadioGraphics. 2015;35(3):696–708. doi: 10.1148/rg.2015140058. [DOI] [PubMed] [Google Scholar]
- 15.Oto A, et al. Prostate cancer: Differentiation of central gland cancer from benign prostatic hyperplasia by using diffusion-weighted and dynamic contrast-enhanced MR imaging. Radiology. 2010;257(3):715–723. doi: 10.1148/radiol.10100021. [DOI] [PMC free article] [PubMed] [Google Scholar]
- 16.Kim CK, Park BK, Kim B. High-b-value diffusion-weighted imaging at 3 T to detect prostate cancer: Comparisons between b values of 1,000 and 2,000 s/mm2. AJR Am J Roentgenol. 2010;194(1):W33-7. doi: 10.2214/AJR.09.3004. [DOI] [PubMed] [Google Scholar]
- 17.Weinreb JC, et al. PI-RADS Prostate Imaging - Reporting and Data System: 2015, version 2. Eur Urol. 2016;69(1):16–40. doi: 10.1016/j.eururo.2015.08.052. [DOI] [PMC free article] [PubMed] [Google Scholar]
- 18.Zhang K, et al. Predicting prostate biopsy outcomes: A preliminary investigation on screening with ultrahigh B-value diffusion-weighted imaging as an innovative diagnostic biomarker. PLoS One. 2016;11(3):e0151176. doi: 10.1371/journal.pone.0151176. [DOI] [PMC free article] [PubMed] [Google Scholar]
- 19.Elbuluk O, et al. Differentiating transition zone cancers from benign prostatic hyperplasia by quantitative multiparametric magnetic resonance imaging. J Comput Assist Tomogr. 2016;40(2):218–224. doi: 10.1097/RCT.0000000000000353. [DOI] [PMC free article] [PubMed] [Google Scholar]
- 20.Gingrich JR, Greenberg NM. A transgenic mouse prostate cancer model. Toxicol Pathol. 1996;24(4):502–504. doi: 10.1177/019262339602400414. [DOI] [PubMed] [Google Scholar]
- 21.Greenberg NM, et al. Prostate cancer in a transgenic mouse. Proc Natl Acad Sci USA. 1995;92(8):3439–3443. doi: 10.1073/pnas.92.8.3439. [DOI] [PMC free article] [PubMed] [Google Scholar]
- 22.Kiss P, et al. Virtual in vivo biopsy map of early prostate neoplasm in TRAMP mice by MRI. Prostate. 2009;69(5):449–458. doi: 10.1002/pros.20880. [DOI] [PubMed] [Google Scholar]
- 23.Gingrich JR, Barrios RJ, Foster BA, Greenberg NM. Pathologic progression of autochthonous prostate cancer in the TRAMP model. Prostate Cancer Prostatic Dis. 1999;2(2):70–75. doi: 10.1038/sj.pcan.4500296. [DOI] [PubMed] [Google Scholar]
- 24.Foster BA, Gingrich JR, Kwon ED, Madias C, Greenberg NM. Characterization of prostatic epithelial cell lines derived from transgenic adenocarcinoma of the mouse prostate (TRAMP) model. Cancer Res. 1997;57(16):3325–3330. [PubMed] [Google Scholar]
- 25.Zhang J, et al. Lobe-specific proteome changes in the dorsal-lateral and ventral prostate of TRAMP mice versus wild-type mice. Proteomics. 2011;11(12):2542–2549. doi: 10.1002/pmic.201100008. [DOI] [PMC free article] [PubMed] [Google Scholar]
- 26.Berquin IM, Min Y, Wu R, Wu H, Chen YQ. Expression signature of the mouse prostate. J Biol Chem. 2005;280(43):36442–36451. doi: 10.1074/jbc.M504945200. [DOI] [PubMed] [Google Scholar]
- 27.Ho E, Song Y. Zinc and prostatic cancer. Curr Opin Clin Nutr Metab Care. 2009;12(6):640–645. doi: 10.1097/MCO.0b013e32833106ee. [DOI] [PMC free article] [PubMed] [Google Scholar]
- 28.Yu J, et al. Amplifying the sensitivity of zinc(II) responsive MRI contrast agents by altering water exchange rates. J Am Chem Soc. 2015;137(44):14173–14179. doi: 10.1021/jacs.5b09158. [DOI] [PMC free article] [PubMed] [Google Scholar]
- 29.Boros E, Polasek M, Zhang Z, Caravan P. Gd(DOTAla): A single amino acid Gd-complex as a modular tool for high relaxivity MR contrast agent development. J Am Chem Soc. 2012;134(48):19858–19868. doi: 10.1021/ja309187m. [DOI] [PMC free article] [PubMed] [Google Scholar]
- 30.Huang Z, Zhang XA, Bosch M, Smith SJ, Lippard SJ. Tris(2-pyridylmethyl)amine (TPA) as a membrane-permeable chelator for interception of biological mobile zinc. Metallomics. 2013;5(6):648–655. doi: 10.1039/c3mt00103b. [DOI] [PMC free article] [PubMed] [Google Scholar]
- 31.Li D, et al. Imaging dynamic insulin release using a fluorescent zinc indicator for monitoring induced exocytotic release (ZIMIR) Proc Natl Acad Sci USA. 2011;108(52):21063–21068. doi: 10.1073/pnas.1109773109. [DOI] [PMC free article] [PubMed] [Google Scholar]
- 32.Costello LC, Franklin RB. Zinc is decreased in prostate cancer: An established relationship of prostate cancer! J Biol Inorg Chem. 2011;16(1):3–8. doi: 10.1007/s00775-010-0736-9. [DOI] [PMC free article] [PubMed] [Google Scholar]
- 33.Shappell SB, et al. Prostate pathology of genetically engineered mice: Definitions and classification. The consensus report from the Bar Harbor meeting of the Mouse Models of Human Cancer Consortium Prostate Pathology Committee. Cancer Res. 2004;64(6):2270–2305. doi: 10.1158/0008-5472.can-03-0946. [DOI] [PubMed] [Google Scholar]
- 34.Zhong W, et al. Ki-67 and PCNA expression in prostate cancer and benign prostatic hyperplasia. Clin Invest Med. 2008;31(1):E8–E15. doi: 10.25011/cim.v31i1.3136. [DOI] [PubMed] [Google Scholar]
- 35.Giblin LJ, et al. Zinc-secreting Paneth cells studied by ZP fluorescence. J Histochem Cytochem. 2006;54(3):311–316. doi: 10.1369/jhc.5A6724.2005. [DOI] [PubMed] [Google Scholar]
- 36.Costello LC, Liu Y, Franklin RB, Kennedy MC. Zinc inhibition of mitochondrial aconitase and its importance in citrate metabolism of prostate epithelial cells. J Biol Chem. 1997;272(46):28875–28881. doi: 10.1074/jbc.272.46.28875. [DOI] [PubMed] [Google Scholar]
- 37.Eide DJ. Zinc transporters and the cellular trafficking of zinc. Biochim Biophys Acta. 2006;1763(7):711–722. doi: 10.1016/j.bbamcr.2006.03.005. [DOI] [PubMed] [Google Scholar]
- 38.Esqueda AC, et al. A new gadolinium-based MRI zinc sensor. J Am Chem Soc. 2009;131(32):11387–11391. doi: 10.1021/ja901875v. [DOI] [PMC free article] [PubMed] [Google Scholar]
- 39.Schroeder JJ, Cousins RJ. Interleukin 6 regulates metallothionein gene expression and zinc metabolism in hepatocyte monolayer cultures. Proc Natl Acad Sci USA. 1990;87(8):3137–3141. doi: 10.1073/pnas.87.8.3137. [DOI] [PMC free article] [PubMed] [Google Scholar]
- 40.De Lisle RC, Sarras MP, Jr, Hidalgo J, Andrews GK. Metallothionein is a component of exocrine pancreas secretion: Implications for zinc homeostasis. Am J Physiol. 1996;271(4 Pt 1):C1103–C1110. doi: 10.1152/ajpcell.1996.271.4.C1103. [DOI] [PubMed] [Google Scholar]
- 41.Costello LC, Franklin RB. Aconitase activity, citrate oxidation, and zinc inhibition in rat ventral prostate. Enzyme. 1981;26(6):281–287. doi: 10.1159/000459195. [DOI] [PubMed] [Google Scholar]
- 42.Costello LC, et al. Human prostate cancer ZIP1/zinc/citrate genetic/metabolic relationship in the TRAMP prostate cancer animal model. Cancer Biol Ther. 2011;12(12):1078–1084. doi: 10.4161/cbt.12.12.18367. [DOI] [PMC free article] [PubMed] [Google Scholar]
- 43.Ghosh SK, et al. A novel imaging approach for early detection of prostate cancer based on endogenous zinc sensing. Cancer Res. 2010;70(15):6119–6127. doi: 10.1158/0008-5472.CAN-10-1008. [DOI] [PMC free article] [PubMed] [Google Scholar]
- 44.Hill DK, et al. Diffusion-weighted MRI for early detection and characterization of prostate cancer in the transgenic adenocarcinoma of the mouse prostate model. J Magn Reson Imaging. 2016;43(5):1207–1217. doi: 10.1002/jmri.25087. [DOI] [PubMed] [Google Scholar]


