Significance
To understand the cell, it is necessary to study its dynamics at high resolution in space and time in a way that does not adversely affect it. Superresolution microscopy offers the requisite spatial resolution but usually at the cost of slow imaging speed and excessive damage. In this work, a fluorescent protein is described that enables substantial improvements in the speed, duration, and noninvasiveness of live-cell superresolution microscopy.
Keywords: fluorescent protein, superresolution, microscopy, live-cell imaging, Skylan-NS
Abstract
Two long-standing problems for superresolution (SR) fluorescence microscopy are high illumination intensity and long acquisition time, which significantly hamper its application for live-cell imaging. Reversibly photoswitchable fluorescent proteins (RSFPs) have made it possible to dramatically lower the illumination intensities in saturated depletion-based SR techniques, such as saturated depletion nonlinear structured illumination microscopy (NL-SIM) and reversible saturable optical fluorescence transition microscopy. The characteristics of RSFPs most critical for SR live-cell imaging include, first, the integrated fluorescence signal across each switching cycle, which depends upon the absorption cross-section, effective quantum yield, and characteristic switching time from the fluorescent “on” to “off” state; second, the fluorescence contrast ratio of on/off states; and third, the photostability under excitation and depletion. Up to now, the RSFPs of the Dronpa and rsEGFP (reversibly switchable EGFP) families have been exploited for SR imaging. However, their limited number of switching cycles, relatively low fluorescence signal, and poor contrast ratio under physiological conditions ultimately restrict their utility in time-lapse live-cell imaging and their ability to reach the desired resolution at a reasonable signal-to-noise ratio. Here, we present a truly monomeric RSFP, Skylan-NS, whose properties are optimized for the recently developed patterned activation NL-SIM, which enables low-intensity (∼100 W/cm2) live-cell SR imaging at ∼60-nm resolution at subsecond acquisition times for tens of time points over broad field of view.
In the last two decades, the power of fluorescence microscopy has been enhanced by the addition of superresolution (SR) imaging techniques (1–7). Although every SR technique has been successfully demonstrated to resolve ultrastructures beyond the diffraction limit, many of them encounter practical limitations when imaging nano-scale dynamics in living biological samples, especially over long times and large fields of view. For example, the thousands of raw frames typically acquired for a single-molecule localization-based SR image greatly restrict the temporal resolution of the technique (1, 2, 8) and make it susceptible to blurring induced by cellular motion. On the other hand, structured illumination microscopy (SIM) is capable of live-cell time-lapse imaging for tens to hundreds of time points, at speeds as fast as 11 frames per second (9) and illumination intensities of only 1–100 W/cm2. However, its major shortcoming is that it improves resolution only twofold, to ∼100 nm. Stimulated emission depletion (STED) microscopy (4) and saturated SIM (SSIM) (7, 10, 11) are not subject to this constraint but rather provide diffraction unlimited resolution by exploiting a nonlinear dependence of the fluorescence emission rate upon an illumination intensity. Saturation of the excited electronic state S1 to ground state S0 (S1→S0) via stimulated emission is used in STED, whereas saturation of the S0→S1 transition via high excitation intensity is used by SSIM. However, the saturation of electronic transitions typically requires light intensities of 10–100 MW/cm2, which can quickly bleach fluorophores and induce phototoxicity in biological samples. As a result, one or at most a few image frames are typical in saturation-based live imaging.
Recently, reversibly photoswitchable fluorescent proteins (RSFPs) have demonstrated the ability to significantly reduce SR illumination intensities when applied to reversible saturable optical fluorescence transition (RESOLFT) microscopy (5) and nonlinear SIM (NL-SIM) (12). RSFPs can be repeatedly transited between fluorescent bright and dark states via photoinduced reversible cis-trans isomerization. For transitions in either direction, the population of RSFP molecules remaining in the initial state is well approximated by a reciprocal function of both time and illumination intensity (13) that encompasses both fast and slow components of exponential decay. Thus, either state can be saturated, which results in the required nonlinear dependence of fluorescence emission rate on the illumination intensity (5, 12). Moreover, there is no other competing process such as spontaneous transition between the two states, and the absorption cross-section for photoinduced switching from either state is very high. Therefore, one can use much lower light energy than in STED or SSIM to saturate either state, as required to achieve SR.
In theory, nonlinearity can be achieved by saturating either the bright state (saturation on) or the depletion of the bright state (saturation off) of the RSFPs. In previous studies (12, 14), both NL-SIM and RESOLFT used an ∼10 J/cm2 dose of deactivation illumination to saturate the depletion of the bright state of either Dronpa (12) or rsEGFP2 (reversibly switchable EGFP2) everywhere except at dark nodes within the illumination (14). When applied to NL-SIM, we term this particular approach saturated depletion (SD) NL-SIM. Although using RSFPs significantly reduces the illumination intensities of RESOLFT and SD NL-SIM compared with STED and SSIM, respectively, the SD process itself is very photon inefficient, as only a fraction of the molecules activated in each cycle contributes useful signal. To address this issue, we recently developed patterned activation (PA) NL-SIM (15) in which a fraction of the total pool of RSFP molecules is first activated in a sinusoidal pattern, and then their fluorescence is recorded with a sinusoidal excitation pattern of the same periodicity and phase. Thus, all molecules activated in each cycle contribute useful signal, and the high intensity and/or long exposure time needed to deactivate molecules before excitation are eliminated, thereby removing a potential source of phototoxicity. Together, these advantages make PA NL-SIM much more compatible with noninvasive live-cell imaging at a resolution below 100 nm than other SR modalities.
Although PA NL-SIM using RSFPs has already been demonstrated (15), the properties that strongly influence their suitability for PA NL-SIM have not been enumerated, measured, and compared. Here we perform such a comparison, by evaluating the photophysical properties of Skylan-NS (sky lantern for nonlinear structured illumination), the specific RSFP used for PA NL-SIM (15), against two other RSFPs, rsEGFP2 and Dronpa, that have been used previously in the SR imaging modalities of RESOLFT (14) and SD NL-SIM (12), respectively. We further demonstrate the superiority of Skylan-NS for PA NL-SIM by comparing the imaging performance of all three RSFPs when applied to PA NL-SIM.
Results
Development of Skylan-NS.
To develop a new RSFP with improved properties for live SR imaging (particularly PA NL-SIM), we began with our previous work in developing mGeos (16), a highly photostable RSFP. mGeos was created by mutating the first amino acids in the chromophore of the photoconvertable fluorescence protein (PCFP) mEos2 (17). However, mEos2 also tends to form dimers and higher order oligomers at high concentrations (17–19), which makes it unsuitable for labeling membrane proteins that can reach very high local concentrations due to confined 2D movement and limited rotation (20). To attack this problem, we mutated the interface amino acids of mEos2 to develop two true monomeric PCFPs, mEos3.1 and mEos3.2, that work well for photoactivated localization microscopy (PALM) (18). As an added benefit, mEos3 was revealed to be much brighter than mEos2. By using mEos3 as a starting point, we thought it likely that we could develop a true monomeric RSFP by the same innovation strategy that led to mGeos. Hence, we mutated His62 of mEos3.1 by saturation mutagenesis to eliminate the green-to-red conversion and gain reversible photoswitchabilty in the green state. We screened this collection of mEos3 mutants for those exhibiting properties desirable for NL-SIM: high numbers of switching cycles before photobleaching, sufficient numbers of photons per switching cycle, and high contrast ratio between the on and off states. We found one variant, Skylan-S (mEos3.1H62S), having strong blinking characteristics that are desirable for super-resolution optical fluctuation imaging (SOFI) (21), but not NL-SIM. However, we also found another variant (mEos3.1H62L), Skylan-NS, having a higher contrast ratio than Skylan-S and a shorter on-to-off switching half-time, suggesting its suitability for NL-SIM (Fig. S1 and Table S1).
Fig. S1.
Comparison between Skylan-NS and Skylan-S. (A, Upper) Sequence alignment of Dronpa, mEos3.1, Skylan-S, and Skylan-NS. Mutation from mEos3.1 to Skylan-NS is marked by a red frame. (Lower) Photoswitching kinetics of Skylan-NS and Skylan-S. E. coli cells expressing (B) Skylan-NS and (C) Skylan-S were continuously excited with 488 nm TIRF illumination (0.24 mW), and pulsed 0.01-s bursts of illumination with 405-nm light at 0.2 mW were used to photoactivate the fluorescent proteins.
Table S1.
Characteristics of Skylan-S and Skylan-NS
| RSFPs | Abs, nm | Emi, nm | QY | ε-max, M–1·cm−1 | Brightness | Contrast ratio* | M,† kDa | On-to-off switching half-time,‡ s |
| Skylan-S | 499 | 511 | 0.64 | 152,408 | 98,029 | 18.3 | 23.8 | 4.77 |
| Skylan-NS | 499 | 511 | 0.59 | 133,770 | 78,924 | 34.2 | 27.4 | 0.15 |
The absorption maximum (Abs), maximum emission (Emi), quantum yield (QY), and extinction coefficient (ε-max) were measured in PBS (pH 7.4) for the on states of the proteins.
The contrast ratio was the mean value averaged from the first 10 switching cycles in Fig. S1 B and C measured from E. coli. The value for each cycle was calculated by integrating across all pixels and all time points, the total available signal after 405 nm illumination and subtraction of the off state background, until said signal dropped to 1/e intensity of the first sampling point.
The molecular mass (M) was measured via sedimentation equilibrium.
The on-to-off switching speed was measured based on dynamics changes of fluorescence in Fig. S1 B and C.
Photochemical and Photophysical Properties of Skylan-NS.
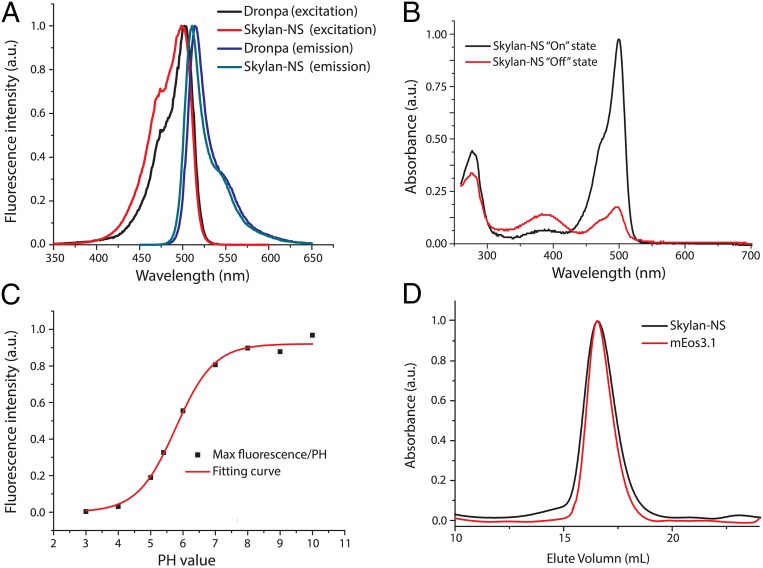
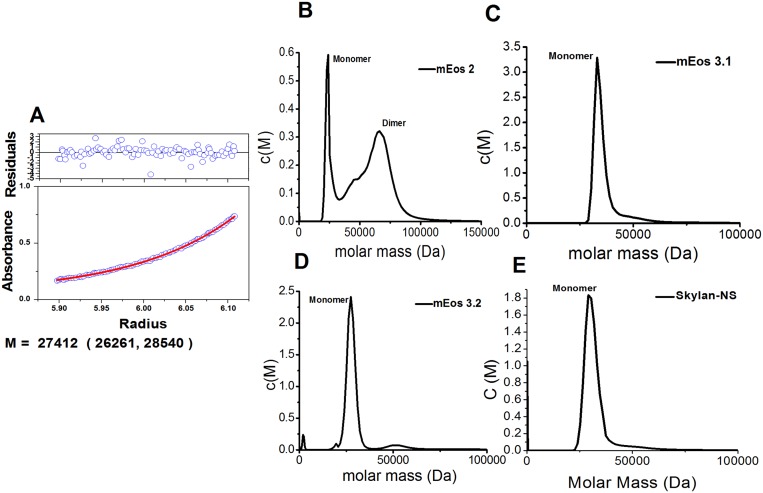
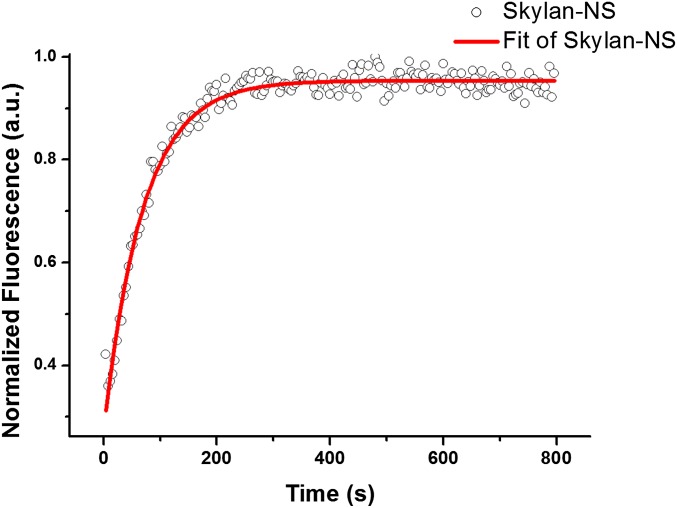
Similar to mGeos, Skylan-NS has its fluorescence excitation and emission maxima at 499 nm and 511 nm, respectively (Fig. 1A), and it can be turned off by 488-nm irradiation and reactivated by 405-nm light (Fig. 1B). After 405-nm illumination, Skylan-NS in the fluorescent state exhibits an extinction coefficient (Ɛ) of 133,770 M–1·cm−1 and a fluorescence quantum yield (Ø) of 0.59 (Table 1). Hence, the brightness (given by Ɛ × Ø) of Skylan-NS is similar to Dronpa and about 150% of that of EGFP. The pKa of Skylan-NS in the fluorescent state is 5.77 (Fig. 1C), which is similar to that of mGeos. As expected, gel filtration and ultracentrifuge analysis data showed that Skylan-NS behaved as a true monomer (Fig. 1D and Fig. S2). The half-time of spontaneous recovery to the on state of Skylan-NS was 70 min (Fig. S3) or less than 10% of Dronpa (840 min).
Fig. 1.
The spectra and photochemical properties of Skylan-NS. (A) The excitation (measured at the emission maximum) and emission (measured at the excitation maximum) spectra of Skylan-NS and Dronpa displayed similar maxima at ∼490 and 510 nm, respectively. (B) Absorption spectra of purified Skylan-NS in the on and off states. Note that there are two peaks at 386 nm and 488 nm in the off state of Skylan-NS. (C) Measurement of pKa, and characterization of the pH dependence of the on state fluorescence intensity of Skylan-NS at 525 nm. (D) Gel filtration analysis of Skylan-NS and mEos3.1 (monomer control). Size exclusion chromatography (approximate 3–4 mg/mL) of Skylan-NS and mEos3.1 in PBS shows that Skylan-NS is a monomer, same as mEos3.1.
Table 1.
Characteristics of Dronpa, rsEGFP2, and Skylan-NS
| RSFPs | Abs, nm | Emi, nm | QY | ε-max, M–1·cm–1 | Switching-off lifetime,* ms at 100 W/cm2 | Available fluorescence signal per switching cycle† | Contrast ratio | pKa | M,‡ kDa |
| Dronpa§ | 503 | 522 | 0.68 | 125,000 | 32 | 100 | 9.3 | 5.0 | 23.0 |
| rsEGFP2 | 478 | 503 | 0.3 | 61,300 | 4 | 2.7 | 20.0 | 5.8 | 29.4 |
| Skylan-NS | 499 | 511 | 0.59 | 133,770 | 10 | 29 | 36.7 | 5.7 | 27.4 |
The absorption maximum (Abs), maximum emission (Emi), quantum yield (QY), and extinction coefficient (ε-max) were measured in PBS (pH 7.4) for the on states of the proteins.
Switching-off lifetime at 100 W/cm2 is measured as the characteristic time when the fluorescence intensity of ensemble molecules decay to 1/e of the initial state.
The available fluorescence signal per switching cycle is calculated as extinction coefficient × quantum yield × switching-off lifetime and normalized to the value of Dronpa.
The molecular mass (M) was measured via sedimentation equilibrium.
Literature values in ref. 26.
Fig. S2.
Analysis of oligomerization. (A) Sedimentation equilibrium analytical ultracentrifugation of Skylan-NS. The calculated molecular mass of 27,412 Da from the fitting curve (red line) is similar to the theoretical value. (B–E) Sedimentation velocity analytical ultracentrifugation of Skylan-NS (mEos2, mEos3.1, and mEos3.2 as controls). Skylan-NS has very similar profiles as mEos3 in the sedimentation velocity analytical ultracentrifugation at 0.05 mM.
Fig. S3.
Spontaneous recovery curve of purified Skylan-NS from the off state. The curve was normalized to the amplitudes of the fitted exponentials.
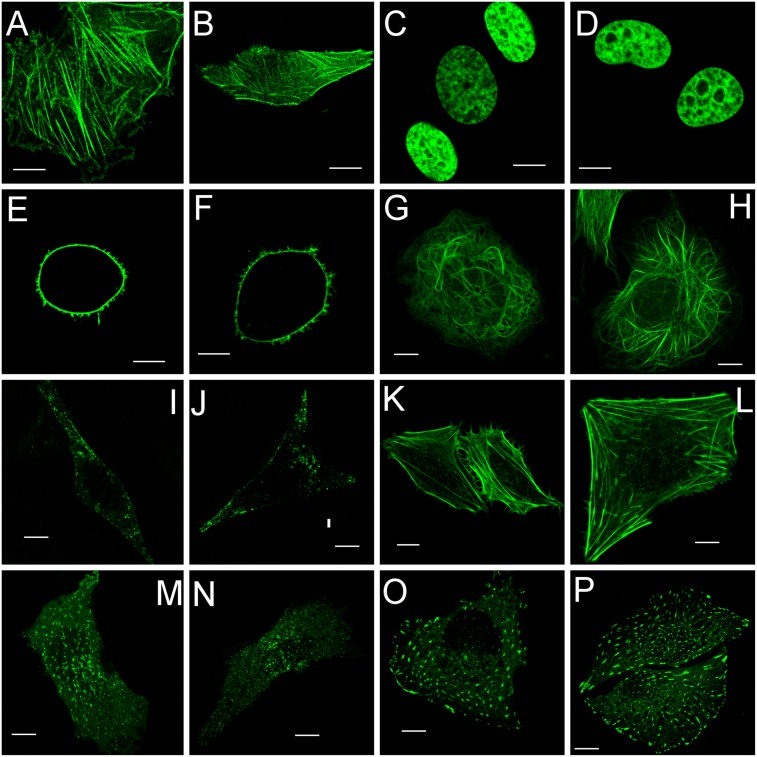
To further investigate Skylan-NS performance as a fusion tag in living cells, we observed the patterns of Skylan-NS fusion proteins transiently expressed in U2OS cells using confocal microscopy. Skylan-NS correctly labels β-actin, H2B, MAP4, caveolin, lifeact, clathrin, and paxillin (Fig. 2). Next we checked a calcium channel, Orai1, which is expressed in the plasma membrane and sensitive to oligomeric character of fluorescent protein tags (18), and found no artificial aggregation with Orail–Skylan-NS (Fig. 2). All of these corroborate the monomeric nature of Skylan-NS.
Fig. 2.
Confocal images of U2OS cells expressing Skylan-NS–labeled β-actin (A and B), H2B (C and D), Orai1 (E and F), MAP4 (G and H), caveolin (I and J), lifeact (K and L), clathrin (M and N), and paxillin (O and P). (Scale bars, 10 μm.)
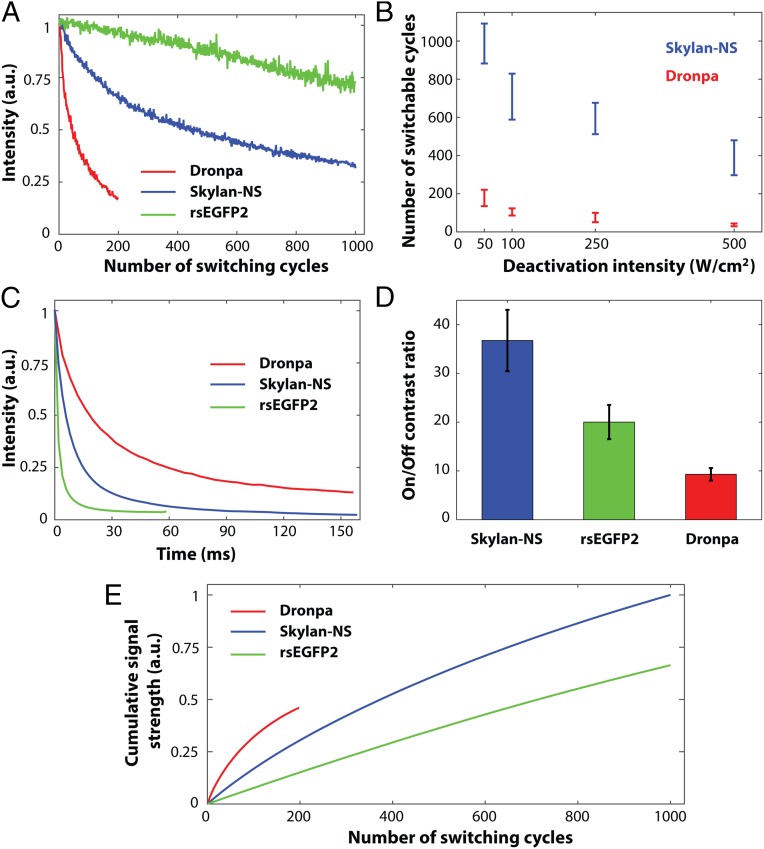
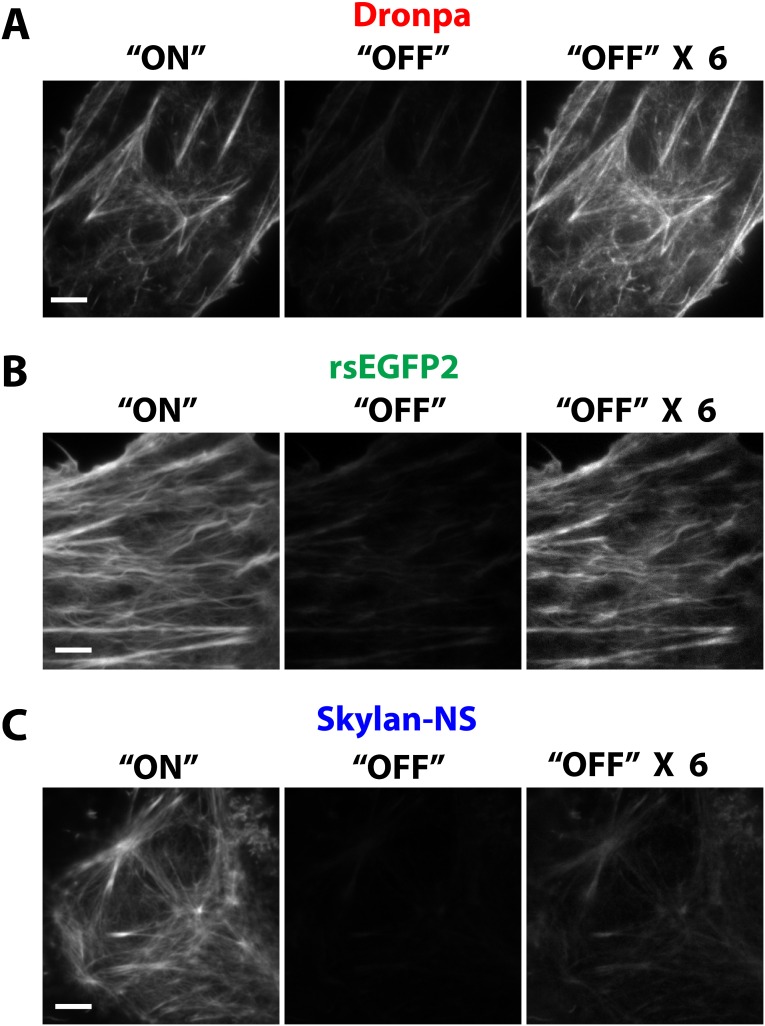
To compare the total number of switching cycles, we expressed Skylan-NS, Dronpa, and rsEGFP2-labeled actin in fixed COS-7 cells. Fig. 3A shows fluorescence bleaching curves of these three RSFPs under an illumination intensity of 100 W/cm2 of 488-nm light typical of that used for PA NL-SIM. Dronpa and Skylan-NS decayed to 1/e of their initial fluorescence intensity in 100 ± 18 and 710 ± 100 switching cycles, respectively, highlighting the superiority of the latter by this metric. More switching cycles could be coaxed from either protein by using lower intensity illumination (Fig. 3B), providing yet another reason for keeping the intensity as low as possible in time-lapse live SR imaging. Dronpa emits more photons per switching cycle (Table 1), thanks to its slow switching kinetics (Fig. 3C), but this necessitates long depletion/excitation times and/or high intensities to achieve high imaging speed and in practice leads to more signal than necessary for initial image frames in PA NL-SIM and too little in later frames. rsEGFP2 exhibited the longest fluorescence decay (it was bleached to 70% of initial fluorescence intensity after 1,000 switching cycles; Fig. 3A), but its faster switching kinetics (Fig. 3C), lower extinction coefficient, and smaller quantum yield (Table 1) cause it to emit 10.7 and 37 times fewer fluorescence photons per switching cycle than Skylan-NS and Dronpa, respectively (Table 1). As a result, the total fluorescence emission across all switching cycles, although higher than Dronpa, is not as great for rsEGFP2 as for Skylan-NS (Fig. 3E). Finally, the on/off contrast ratio of Skylan-NS is 3.6 or 1.8 times better than that of Dronpa or rsEGFP, respectively (Fig. 3D and Fig. S4), leading to proportionally less background in densely labeled specimens. However, it is also worth noting that the on/off contrast ratio depends on the relative photobleaching rates of the signal and background as the number of switching cycles increase. For example, the contrast ratio of Skylan-NS reduces from 36.7 to 17.0 after 800 switching cycles, whereas the contrast ratio of both rsEGFP2 and Dronpa is relatively stable, remaining 20.0 for rsEGFP2 after 800 switching cycles and 9.3 for Dronpa after 100 switching cycles.
Fig. 3.
Photoswitching kinetics comparison. (A) Fluorescence bleaching curves of Dronpa, rsEGFP2, and Skylan-NS were recorded in fixed COS-7 cells under an illumination intensity of 100 W/cm2 at 488 nm, typical of the conditions used in PA NL-SIM. (B) Number of switching cycles at different deactivation intensities. (C) On/off switching kinetics of Dronpa, Skylan-NS, and rsEGFP2, with 100 W/cm2 at 480 nm deactivation light. (D) On/off contrast ratios of Skylan-NS, rsEGFP2, and Dronpa. (E) The relative cumulative fluorescence signal emitted by Dronpa, rsEGFP2, and Skylan-NS.
Fig. S4.
The on/off contrast ratio of Dronpa (A), rsEGFP2 (B), and Skylan-NS (C), as measured by TIRF microscopy. X6, 6 times gain increase to improve visibility.
Thus, by all of the metrics described above, Skylan-NS is a superior RSFP for live SR imaging in general and PA NL-SIM in particular.
PA NL-SIM Imaging Using Different RSFPs.
To demonstrate this in practice, we imaged three different sets of transiently transfected COS-7 cells expressing Lifeact fused to Skylan-NS, Dronpa, and rsEGFP2 respectively, by PA NL-SIM at 1.2-s acquisition time. With Skylan-NS, we acquired 30 frames with 100 W/cm2 intensity (Fig. 4 A–C and Movie S1). However, with Dronpa, we could acquire only eight frames at acceptable signal-to-noise ratio (SNR) (Fig. 4 D–F and Movie S2) by using 250 W/cm2 intensity, and then even the initial image was noisier, in part due to its poorer on/off contrast (Fig. 4F). Finally, although the increased number of switching cycles allowed us to image rsEGFP2-expressing cells for up to 60 frames with 50 W/cm2 intensity (Fig. 4 G–I and Movie S3), the fast switching time and relatively low contrast ratio of rsEGFP2 reduced the signal and raised the background to the point where it was difficult to obtain high-contrast, low-noise PA NL-SIM images of single actin filaments (Fig. 4 C and I).
Fig. 4.
Live-cell NL-SIM based on patterned photoactivation. (A and B) PA NL-SIM images of frame 1 and frame 25 from Movie S1 of a COS-7 cell transfected with Skylan-NS–Lifeact at 100 W/cm2 illumination intensity. (C) Zoomed-in view of the boxed region in A. (D and E) PA NL-SIM images of frame 1 and frame 8 from Movie S2 of a COS-7 cell transfected with Dronpa–Lifeact at 250 W/cm2 illumination intensity. (F) Zoomed-in view of the boxed region in D. (G and H) PA NL-SIM images of frame 1 and frame 60 from Movie S3 of a COS-7 cell transfected with rsEGFP2–Lifeact at 50 W/cm2 illumination intensity. (I) Zoomed-in view of the boxed region in G. [Scale bars, 5 μm (B, E, and H) and 1 μm (C, F, and I).] Gamma value, 0.5 for all images.
In summary, Skylan-NS excels at several characteristics of RSFPs important for PA NL-SIM live imaging. Specially, it provides ∼700 switching cycles before bleaching to 1/e of the initial fluorescence intensity, produces ∼10 times more photons per switching cycle than rsEGFP2, and produces 3.6 or 1.8 times higher on/off contrast ratio than Dronpa or rsEGFP2, respectively. Moreover, the true monomer property of Skylan-NS minimizes the risk of disturbing the localization and function of the target protein. All of these advantages enable the recently developed technique of PA NL-SIM (15) live-cell imaging to achieve ∼60-nm resolution at subsecond rates with only 100 W/cm2 illumination intensity, for tens of time points across 40 × 40 μm2 fields of view.
Discussion
For live-cell SR applications, the key characteristics of RSFPs include true monomeric behavior, high brightness, numerous on/off switching cycles, optimal on/off switching kinetics (neither too fast nor too slow), and high on/off contrast ratio. By all of these metrics, Skylan-NS is particularly useful for SR live imaging. In addition, a few sparse single Dronpa molecules in the background have been shown (12) to produce “streak”-like artifacts in NL-SIM, as single molecules can no longer be reliably assumed to be in the correct on or off state during the acquisition of raw images at different phases and orientations of the structured illumination. Skylan-NS exhibits fewer sparse single molecules in the background than other RSFPs likely due to its greater propensity to fold correctly and label structures uniformly, and thus Skylan-NS is more effective in averaging out at these spontaneous switching events at the single pixel level when they do occur.
The switching mechanism of Skylan-NS is likely due to a cis/trans isomerization of the chromophore, accompanied by a change of the chromophoric protonation /deprotonation states (22–24). However, the precise mechanism linking its molecular structure to the preferred characteristics is unknown and needs to be further studied. Skylan-NS also serves as a logical starting point for directed mutagenesis to develop a similarly effective red RSFP, which would enable dual-color SR live imaging. Although demonstrated here in conjunction with PA NL-SIM, its performance compared with other RSFPs suggest that Skylan-NS could also improve SR imaging by point scanning or parallelized RESOLFT microscopy (25).
Materials and Methods
Development of Skylan-NS.
Skylan series were generated by mutating His62 of mEos3.1 to eliminate the green-to-red conversion and gain reversible photoswitchable property at the green channel. Site-specific (H62) random mutations were performed based on pRSETa-mEos3.1 using the polymerase incomplete primer extension (PIPE) method. All mutants were sequenced, purified, and transformed into Escherichia coli strain BL21 (DE3). Further analyses were performed under a wide-field upright fluorescence microscope (Stereo Discovery V8, Carl Zeiss) equipped with X-cite 120PC (mercury lamp) and proper filter set. Finally, the H62L mutant, which has high brightness, photostability, and high on/off ratio, was named as Skylan-NS (indicating Skylan for NL-SIM). For the control experiment, Dronpa (Amalgaam Inc.) was cloned into pRSETa (Clontech) vector to generate pRSETa-Dronpa.
Plasmid Construction.
The Skylan-NS cDNAs were cloned into the BamHI/Not I sites of pEGFP-N1 (Clontech) and the NheI/BglII sites of pEGFP-C1 (Clontech) to replace the EGFP gene to generate pSkylan-NS-N1 and pSkylan-NS-C1. To express Lifeact/Caveolin/Clathrin/Paxillin-fused fluorescent proteins in mammalian cells, the Lifeact/Caveolin/Clathrin/Paxillin cDNAs were cloned into pSkylan-NS-N1 (Clontech) with EcoRI and BamHI. Also, to label Orai1 (Homo sapiens, NM_032790.3) with Skylan-NS, the genes encoding Skylan-NS were PCR-amplified and swapped with the EGFP gene in the vector pOrai1-EGFP-N1 using BamHI and NotI. β-actin and MAP4 (Proteintech Group, Inc.) were cloned into pSkylan-NS-C1 vector. The full-length Homo sapiens H2B (Proteintech Group, Inc.) cDNAs with NheI/XhoI sites were PCR-amplified and inserted into pSkylan-NS-N1. Synthetic DNA primers for cloning and site-specific random mutations were purchased from Invitrogen. All mutants were sequenced (The Beijing Genomics Institute) before further analysis. The restriction enzymes were purchased from New England BioLabs Inc.
Protein Expression and Purification.
Proteins of Dronpa, mEos3.1 and Skylan-NS were expressed in the E. coli strain BL21(DE3) and purified using an Ni-NTA His-Bind resin (Qiagen), followed by a gel filtration step using a Superdex 200 column (GE Healthcare). For further analysis, purified proteins were concentrated by ultrafiltration and diluted in PBS.
Measurement of Spectral Properties and pKa.
Proteins were first diluted in PBS (pH 7.4) to limit UV absorption under 0.1 so that quantum yields could be accurately measured. Then, the absorption, excitation/emission spectra were immediately recorded using an Agilent 8453 UV/V spectrophotometer and an Edinburgh Instrument FLS920, respectively. For the emission spectra, Skylan-NS was irradiated with 503-nm light. To determine the fluorescence excitation spectra, the fluorescence was recorded at 513 nm. The fluorescence quantum yields and the molar extinction coefficients at the respective absorption maxima were determined relative to the reported value for Dronpa (quantum yield, 0.68; molar extinction coefficient, 125,000 M−1·cm−1). For pKa measurement, purified Skylan-NS dissolved in PBS (pH 7.4) were diluted 1:20 in either glycine–hydrochloric acid buffers (for pH ≤ 5) or sodium phosphate buffers (for pH ≥ 6) with pH values ranging from 3 to 10, and the absorption spectra were immediately recorded. The pKa value was taken as the pH value where the absorption reached 50% of the maximum.
Cell Culture, Transfection, and Fixation.
U2OS and COS-7 cells were cultured in McCoy’s 5A Medium (MCMM) (Gibco) and Dulbecco’s Modified Eagle Medium (DMEM) complete medium (Gibco) supplemented with 10% (vol/vol) FBS and maintained at 37 °C and 5% (vol/vol) CO2 in a humidified incubator. Cells were then transiently transfected using Lipofectamine 2000 (Invitrogen) in accordance with the manufacturer’s protocol. Six hours after transfection, the cells were trypsinized and plated at lower density on clean coverslips (Fisher Scientific) to induce spreading for another 24 h in MCMM (Gibco) or DMEM (Gibco) complete medium without phenol red for live-cell imaging. Otherwise cells were fixed with 4% (wt/vol) paraformaldehyde and 0.2% glutaraldehyde in PBS for 15 min at 37 °C, washed three times with PBS, and stored in PBS until fixed cell imaging.
Relaxation Half-Time Measurement.
The protocol used was described previously (16). Purified protein of Skylan-NS was first photoswitched to its off states using a 60-mW, 488-nm LED. Then, the relaxation curves from the off state into the thermal equilibrium state were obtained using a Varioskan Flash spectral scanning multimode reader (Thermo Scientific) with 96-well optical bottom plates (Nunc) for ∼20 h at 25 °C. A weak blue light (490 nm) was used to excite the sample, and the fluorescence of the sample at 513 nm was recorded every 4 min during the period. Then, the determination of relaxation half-time for Skylan-NS was based on single exponential function fitting of the curve.
Analysis of Oligomerization.
To analyze the oligomerization state of Skylan-NS, size-exclusion chromatography was first performed using a Superdex 200 column on an Akta purifier system (GE Healthcare). mEos2 (dimer) and mEos3.1 and mEos3.2 (monomers) were used as controls. Before chromatography, proteins were concentrated to 3–4 mg/mL. The flow rate was set to 0.5 mL/min. Protein absorption was monitored at 280 nm. All measurements were performed at 16 °C. Next, Skylan-NS was subjected to analytical ultracentrifuge assays. Sedimentation equilibrium experiments were performed on a Beckman Optima XL-I analytical ultracentrifuge at 20 °C. Purified protein at 14.6 µM was loaded into six-channel centrifugation cells and normalized to the corresponding buffer (PBS, pH 7.4). Samples were centrifuged at 10,000, 15,000, and 20,000 rpm sequentially. The data were analyzed by nonlinear least-squares analysis using the software package (Microcal Origin) supplied by Beckman. The solvent density, partial specific volume, and calculated molecular mass used in the analysis were determined by Sedenterp v 1.01. Sedimentation velocity experiments were performed using purified protein at 50.0 µM loaded into centrifugation cells and normalized to the corresponding buffer (PBS, pH 7.4). The measured molecular mass of monomer Skylan-NS with 6× His tag was about 27.4 kDa.
Characterization of the Switching Properties of RSFPs.
To analyze the switching properties of RSFPs, we expressed Skylan-NS, Dronpa, and rsEGFP2 in COS-7 cells and fixed them before measurement. The switching properties were measured in the PA NL-SIM imaging platform to keep the same illumination conditions and 37 °C ambient temperature as used for live imaging. For each switching cycle, the sample was first irradiated with 405-nm light at 10 W/cm2 for 2 ms to fully activate all molecules into the on state. Immediately thereafter, 488-nm light at 100 W/cm2 was applied, and a fluorescence image was acquired by integrating the signal every 2 ms over a total exposure time of 60 ms for rsEGFP2 and 160 ms for Dronpa and Skylan-NS. This process was repeated 200 times for Dronpa and 1,000 times for Skylan-NS and rsEGFP2. The camera dark image was subtracted from each raw image of 2 ms exposure, and the deactivation kinetics (Fig. 3C) curve was determined by integrating the result across each raw image. We defined the residual emission remaining in the final image frame of 2 ms exposure as the off state background image. To extract that portion of the signal that can be used in SR imaging experiments, this off state image was further subtracted from each frame. The total available signal was then calculated by integrating across all pixels and all sampling windows from the first until the window at which the intensity dropped to 1/e of the first. Similarly, the off state background over the whole switching period was calculated as the product of the summed background image and the number of sampling points in each cycle (30 points for rsEGFP2 and Skylan-NS and 80 points for Dronpa). The on/off contrast ratio (Fig. 3D) was then computed by dividing the SR-available signal by the off state background, and the final on/off contrast ratio was determined by averaging the results obtained in this manner from the first 10 switching cycles. The photobleaching curve (Fig. 3A) was determined by repeating the calculation of the SR-available signal for each cycle. The photobleaching measurement was performed at illumination intensities of 50, 100, 250, and 500 W/cm2 to characterize the influence of illumination intensity on number of switching cycles (Fig. 3B). For photoswitching kinetics comparison of Skylan-NS and Skylan-S, E. coli cells expressing Skylan-NS (Fig. S1B) and Skylan-S (Fig. S1C) were continuously excited with 488 nm total internal reflection fluorescence (TIRF) illumination (0.24 mW), and pulsed 0.01-s bursts of illumination with 405-nm light at 0.2 mW were used to photoactivate the fluorescent proteins. The on-to-off switching half-times (Table S1) were measured based on dynamics changes of fluorescence in Fig. S1 B and C.
PA NL-SIM Imaging.
The PA NL-SIM imaging system used in this study and data acquisition procedures are the same as that described in previous work (15). We used the same imaging procedure for PA NL-SIM raw image acquisition with three different RSFPs. Briefly, the exposure procedure for each raw image consisted of (i) 405 nm patterned illumination for 1 ms at 2 W/cm2 to activate the RSFP molecules, (ii) 488 nm patterned illumination for 30 ms to read-out the activated molecules, and (iii) 488 nm uniform illumination for 10 ms at 100 W/cm2 to deactivate the remaining activated molecules. The intensity of 488-nm light in step ii was 100 W/cm2 for Skylan-NS, 250 W/cm2 for Dronpa, and 50 W/cm2 for rsEGFP2. This sequence was repeated for each of the 25 raw images (five phases × five orientations) required to construct a single PA NL-SIM image. Photobleaching of the RSFP dictated the number of PA NL-SIM frames that could be acquired in each case. For Skylan-NS, the SNR was typically sufficient to reconstruct PA NL-SIM images out to the 1% support level of the optical transfer function, which corresponds to 62 nm spatial resolution.
Supplementary Material
Acknowledgments
We thank White Helen at the Janelia Research Campus for specimen preparation and X. Yu and Y. Teng at the Institute of Biophysics for providing technical support of analytical ultracentrifugation and confocal imaging, respectively. This project was supported by National Basic Research Program Grant 2013CB910103; National Key Research and Development Projects Grant 2016YFA0501500; National Natural Science Foundation of China Grants 31421002, 31370851, 31170818, and 31300612; Project of the Chinese Academy of Sciences Grant XDB08030202; Youth Innovation Promotion Association CAS Grants 2012080 and 2013067; and Beijing Natural Science Foundation Grant 7131011.
Footnotes
Conflict of interest statement: The protein Skylan-NS is shown applied to nonlinear structured illumination microscopy with patterned activation. This microscopy technology is covered within US Provisional Patent Application 62/057,220 filed by E.B. and D.L. and assigned to the Howard Hughes Medical Institute.
This article contains supporting information online at www.pnas.org/lookup/suppl/doi:10.1073/pnas.1611038113/-/DCSupplemental.
References
- 1.Betzig E, et al. Imaging intracellular fluorescent proteins at nanometer resolution. Science. 2006;313(5793):1642–1645. doi: 10.1126/science.1127344. [DOI] [PubMed] [Google Scholar]
- 2.Rust MJ, Bates M, Zhuang X. Sub-diffraction-limit imaging by stochastic optical reconstruction microscopy (STORM) Nat Methods. 2006;3(10):793–795. doi: 10.1038/nmeth929. [DOI] [PMC free article] [PubMed] [Google Scholar]
- 3.Hess ST, Girirajan TPK, Mason MD. Ultra-high resolution imaging by fluorescence photoactivation localization microscopy. Biophys J. 2006;91(11):4258–4272. doi: 10.1529/biophysj.106.091116. [DOI] [PMC free article] [PubMed] [Google Scholar]
- 4.Hell SW, Wichmann J. Breaking the diffraction resolution limit by stimulated emission: Stimulated-emission-depletion fluorescence microscopy. Opt Lett. 1994;19(11):780–782. doi: 10.1364/ol.19.000780. [DOI] [PubMed] [Google Scholar]
- 5.Hofmann M, Eggeling C, Jakobs S, Hell SW. Breaking the diffraction barrier in fluorescence microscopy at low light intensities by using reversibly photoswitchable proteins. Proc Natl Acad Sci USA. 2005;102(49):17565–17569. doi: 10.1073/pnas.0506010102. [DOI] [PMC free article] [PubMed] [Google Scholar]
- 6.Gustafsson MGL. Surpassing the lateral resolution limit by a factor of two using structured illumination microscopy. J Microsc. 2000;198(Pt 2):82–87. doi: 10.1046/j.1365-2818.2000.00710.x. [DOI] [PubMed] [Google Scholar]
- 7.Gustafsson MGL. Nonlinear structured-illumination microscopy: Wide-field fluorescence imaging with theoretically unlimited resolution. Proc Natl Acad Sci USA. 2005;102(37):13081–13086. doi: 10.1073/pnas.0406877102. [DOI] [PMC free article] [PubMed] [Google Scholar]
- 8.Sengupta P, van Engelenburg SB, Lippincott-Schwartz J. Superresolution imaging of biological systems using photoactivated localization microscopy. Chem Rev. 2014;114(6):3189–3202. doi: 10.1021/cr400614m. [DOI] [PMC free article] [PubMed] [Google Scholar]
- 9.Kner P, Chhun BB, Griffis ER, Winoto L, Gustafsson MGL. Super-resolution video microscopy of live cells by structured illumination. Nat Methods. 2009;6(5):339–342. doi: 10.1038/nmeth.1324. [DOI] [PMC free article] [PubMed] [Google Scholar]
- 10.Heintzmann R, Jovin TM, Cremer C. Saturated patterned excitation microscopy--A concept for optical resolution improvement. J Opt Soc Am A Opt Image Sci Vis. 2002;19(8):1599–1609. doi: 10.1364/josaa.19.001599. [DOI] [PubMed] [Google Scholar]
- 11.Heintzmann R. Saturated patterned excitation microscopy with two-dimensional excitation patterns. Micron. 2003;34(6-7):283–291. doi: 10.1016/s0968-4328(03)00053-2. [DOI] [PubMed] [Google Scholar]
- 12.Rego EH, et al. Nonlinear structured-illumination microscopy with a photoswitchable protein reveals cellular structures at 50-nm resolution. Proc Natl Acad Sci USA. 2012;109(3):E135–E143. doi: 10.1073/pnas.1107547108. [DOI] [PMC free article] [PubMed] [Google Scholar]
- 13.Hell SW. Far-field optical nanoscopy. Science. 2007;316(5828):1153–1158. doi: 10.1126/science.1137395. [DOI] [PubMed] [Google Scholar]
- 14.Grotjohann T, et al. rsEGFP2 enables fast RESOLFT nanoscopy of living cells. eLife. 2012;1:e00248. doi: 10.7554/eLife.00248. [DOI] [PMC free article] [PubMed] [Google Scholar]
- 15.Li D, et al. ADVANCED IMAGING. Extended-resolution structured illumination imaging of endocytic and cytoskeletal dynamics. Science. 2015;349(6251):aab3500. doi: 10.1126/science.aab3500. [DOI] [PMC free article] [PubMed] [Google Scholar]
- 16.Chang H, et al. A unique series of reversibly switchable fluorescent proteins with beneficial properties for various applications. Proc Natl Acad Sci USA. 2012;109(12):4455–4460. doi: 10.1073/pnas.1113770109. [DOI] [PMC free article] [PubMed] [Google Scholar]
- 17.McKinney SA, Murphy CS, Hazelwood KL, Davidson MW, Looger LL. A bright and photostable photoconvertible fluorescent protein. Nat Methods. 2009;6(2):131–133. doi: 10.1038/nmeth.1296. [DOI] [PMC free article] [PubMed] [Google Scholar]
- 18.Zhang M, et al. Rational design of true monomeric and bright photoactivatable fluorescent proteins. Nat Methods. 2012;9(7):727–729. doi: 10.1038/nmeth.2021. [DOI] [PubMed] [Google Scholar]
- 19.Wang S, Moffitt JR, Dempsey GT, Xie XS, Zhuang X. Characterization and development of photoactivatable fluorescent proteins for single-molecule-based superresolution imaging. Proc Natl Acad Sci USA. 2014;111(23):8452–8457. doi: 10.1073/pnas.1406593111. [DOI] [PMC free article] [PubMed] [Google Scholar]
- 20.Zacharias DA, Violin JD, Newton AC, Tsien RY. Partitioning of lipid-modified monomeric GFPs into membrane microdomains of live cells. Science. 2002;296(5569):913–916. doi: 10.1126/science.1068539. [DOI] [PubMed] [Google Scholar]
- 21.Zhang X, et al. Development of a reversibly switchable fluorescent protein for super-resolution optical fluctuation imaging (SOFI) ACS Nano. 2015;9(3):2659–2667. doi: 10.1021/nn5064387. [DOI] [PubMed] [Google Scholar]
- 22.Habuchi S, et al. Photo-induced protonation/deprotonation in the GFP-like fluorescent protein Dronpa: Mechanism responsible for the reversible photoswitching. Photochem Photobiol Sci. 2006;5(6):567–576. doi: 10.1039/b516339k. [DOI] [PubMed] [Google Scholar]
- 23.Andresen M, et al. Structural basis for reversible photoswitching in Dronpa. Proc Natl Acad Sci USA. 2007;104(32):13005–13009. doi: 10.1073/pnas.0700629104. [DOI] [PMC free article] [PubMed] [Google Scholar]
- 24.Brakemann T, et al. Molecular basis of the light-driven switching of the photochromic fluorescent protein Padron. J Biol Chem. 2010;285(19):14603–14609. doi: 10.1074/jbc.M109.086314. [DOI] [PMC free article] [PubMed] [Google Scholar]
- 25.Chmyrov A, et al. Nanoscopy with more than 100,000 ‘doughnuts’. Nat Methods. 2013;10(8):737–740. doi: 10.1038/nmeth.2556. [DOI] [PubMed] [Google Scholar]
- 26.Andresen M, et al. Photoswitchable fluorescent proteins enable monochromatic multilabel imaging and dual color fluorescence nanoscopy. Nat Biotechnol. 2008;26(9):1035–1040. doi: 10.1038/nbt.1493. [DOI] [PubMed] [Google Scholar]
Associated Data
This section collects any data citations, data availability statements, or supplementary materials included in this article.


