Significance
Stem cells crucially depend on their complex microenvironment, also called niche. The niche is defined as an anatomic site, consisting of specialized niche cells. These niche cells anchor stem cells and provide the stem cells with physical protection and essential growth and maintenance signals. In the murine small intestinal crypts, Paneth cells constitute an important part of cellular niche for Lgr5+ stem cells with which they are intermingled. Paneth cells provide molecules such as Wnt3, EGF, and Notch ligands to maintain intestinal stem cell. There exists no typical Paneth cell in the colon. Here, we show that Reg4-expressing deep crypt secretory cells function as the colon equivalent of Paneth cells.
Keywords: intestinal stem cell, niche, Lgr5, Reg4, deep crypt secretory cells
Abstract
Leucine-rich repeat-containing G-protein coupled receptor 5-positive (Lgr5+) stem cells reside at crypt bottoms of the small and large intestine. Small intestinal Paneth cells supply Wnt3, EGF, and Notch signals to neighboring Lgr5+ stem cells. Whereas the colon lacks Paneth cells, deep crypt secretory (DCS) cells are intermingled with Lgr5+ stem cells at crypt bottoms. Here, we report regenerating islet-derived family member 4 (Reg4) as a marker of DCS cells. To investigate a niche function, we eliminated DCS cells by using the diphtheria-toxin receptor gene knocked into the murine Reg4 locus. Ablation of DCS cells results in loss of stem cells from colonic crypts and disrupts gut homeostasis and colon organoid growth. In agreement, sorted Reg4+ DCS cells promote organoid formation of single Lgr5+ colon stem cells. DCS cells can be massively produced from Lgr5+ colon stem cells in vitro by combined Notch inhibition and Wnt activation. We conclude that Reg4+ DCS cells serve as Paneth cell equivalents in the colon crypt niche.
Adult stem cells are located within special microenvironments known as niches that are important for their long-term maintenance (1, 2). Although the stem cell niche varies in nature and location between different organs, in general terms it provides a unique signaling environment to maintain tissue homeostasis, inhibit stem cell loss, and control cell differentiation (1, 3, 4). The mammalian small intestine (SI) and colon represent unique models to study tissue stem cells and their niches because of their stereotypic and compact architecture combined with their exceedingly fast self-renewing kinetics (5, 6). In both SI and colon crypts, cycling stem cells are marked by leucine-rich repeat-containing G-protein coupled receptor 5 (Lgr5) (7). Murine SI stem cells divide approximately every 24 h to fill a proliferative transit-amplifying compartment that occupies the remainder of the crypts. Cells exiting crypts arrest their cell cycle, differentiate, and move up the flanks of the villi. One of the differentiated cell types derived from the SI stem cell, the Paneth cell, is located at crypt bottoms and is in direct contact with Lgr5 stem cells. It produces factors that promote stem cell maintenance, including epidermal growth factor (EGF) and the related TGF-α, the Notch ligands Dll-1 and Dll-4, and Wnt3 (8–10). Whereas Paneth cells are dispensable for in vivo crypt function (as niche factors are also secreted from nonepithelial cells), Paneth cells are indispensable for the growth of epithelial miniguts in culture (9, 11, 12). The colon crypts harbor Lgr5+ stem cells at their base. In sharp contrast to the SI, Paneth cells are absent from colons of mammals and rodents. However, we observed that Lgr5-GFP+ cells are intermingled with a large Lgr5-GFP− cell type (7).
Approximately 30 y ago, Altmann reported that differentiated, mucous-type cells located at the bottom part of colonic crypts are distinguishable from Goblet cells. He named these “deep crypt secretory (DCS) cells” (13). Recently, Clarke and coworkers used a combination of FACS sorting and single-cell quantitative reverse transcriptase PCR analysis and reported that cKit (Kit) marks a subpopulation of Goblet cells in colonic crypts (14). These cKit+-goblet cells supported Lgr5+ colonic stem cells to form colon organoids. Of note, cKit is expressed by Paneth cells in the SI and in in vitro organoid cultures. When cKit+-Paneth cells were removed from SI organoids, this loss of Paneth cells led to their demise, confirming earlier observations on Paneth cell niche functions. Thus, although these data confirmed that (cKit+) Paneth cells function as a niche for Lgr5+ stem cells in the SI, the function of cKit+-DCS cells in vivo in the colon remains unknown. Here, we exploit regenerating islet-derived family member 4 (Reg4), also noted by Clarke and coworkers in their cKit+ cells, to specifically study the function of the DCS cell.
Results
Identification of Reg4 as a DCS Cell Marker.
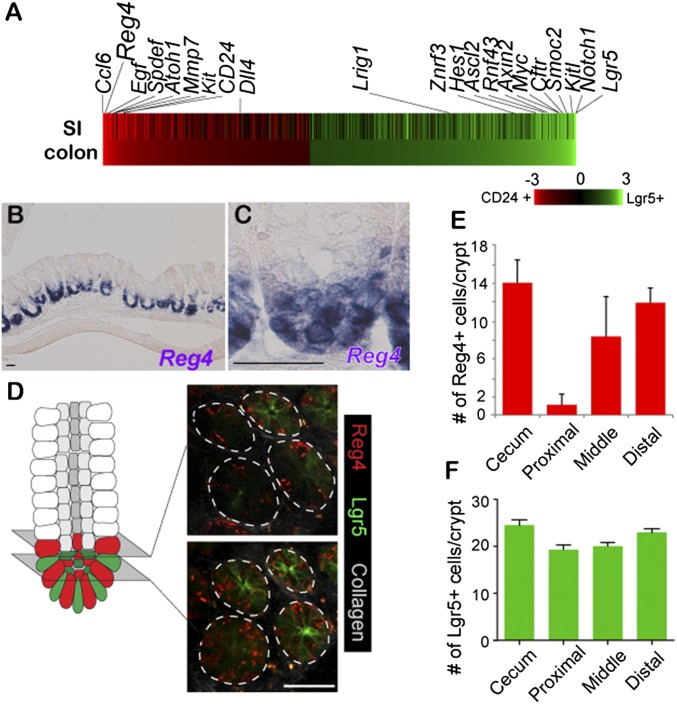
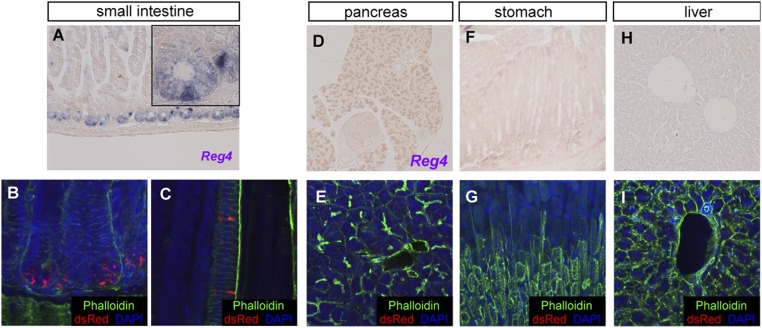
To identify marker genes for DCS cells, we performed microarray analysis by using Lgr5-GFP+/CD24+ sorted cells, because CD24 is expressed at both Paneth cells in SI crypts and at colon crypt bottoms (8). Gene signatures were determined by microarray analysis of CD24+ cells, with one of the most highly expressed genes being Reg4 (Fig. 1A). This gene encodes a secreted protein containing a conserved domain found in C-type lectin carbohydrate recognition domain (15). Another Reg family member, RegIIIγ, has convincingly been shown to serve an antibacterial function (16). In agreement with the data of Rothenberg et al. (14), the current study confirmed Reg4 to be present within the cKit+ cell fraction. We noted that cKit occurred in both epithelial and nonepithelial cells in colon (14, 17, 18). In contrast, Reg4 was exclusively expressed in crypt bases of colon (Fig. 1 B and C), and not in pancreas, stomach, and liver (Fig. S1 D, F, and H).
Fig. 1.
Reg4 is a marker for DCS cells in colonic crypts. (A) Heat map of microarray expression experiments performed from sorted CD24+ cells versus Lgr5+ stem cells from SI and colon, respectively. (B and C) In situ hybridization performed on colon by using Reg4 mRNA probe, revealing Reg4 at bottoms of colon crypts (B); enlarged in C (n = 4 mice). (D) Intravital imaging of Reg4-DTR-dsRed/Lgr5-GFP living mouse at middle part of colon. Reg4+ DCS cells is defined by dsRed (red), and stem cells are visualized by GFP fluorescence (green) at the border (Upper Right), and at the central region of the stem cell niche (Lower Right). (E and F) Number of Reg4+ DCS cells and Lgr5+ stem cells per crypts in cecum, proximal, middle, and distal of colon. (n > 20). Error bars represent SD. (Scale bars: 50 µm.)
Fig. S1.
Reg4 is specifically expressed in the intestinal epithelium. Reg4 mRNA expression as detected by in situ hybridization (A, D, F, and H) and confocal dsRed (red) imaging counterstained with the Phalloidin (F-actin, green) and DNA dye (DAPI, blue) in Reg4-DTR-dsRed mouse (B, C, E, G, and I) confirms that Reg4 expression is observed in intestinal tissue (A–E) but not the other tissues such as the pancreas (D and E), stomach (F and G), and liver (H and I). Reg4+dsRed expression is restricted in Paneth cells at the bottom of SI crypts and is observed in enteroendocrine cells in villus that has been reported by Grün et al. (19).
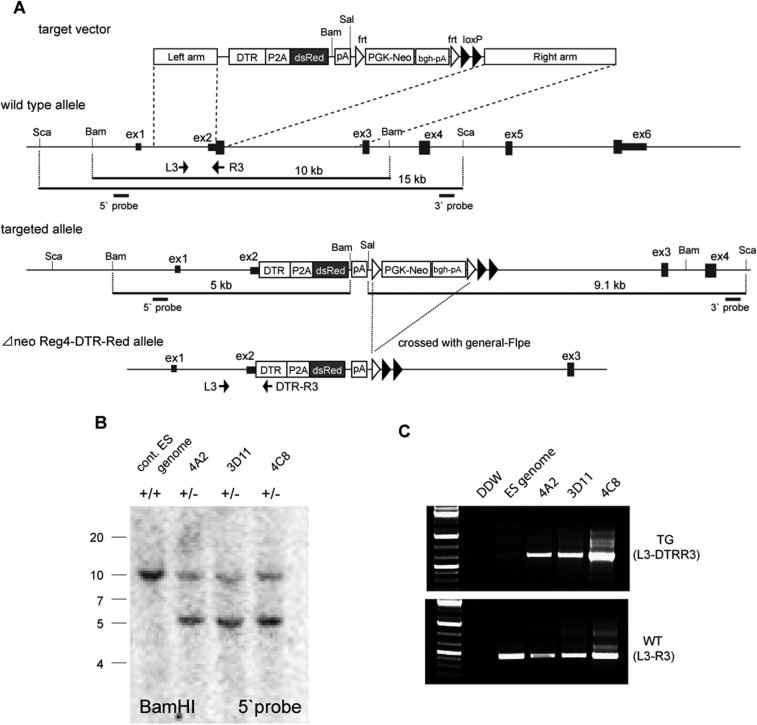
To confirm Reg4+ cells as DCS cells and to study their function in colonic crypts, we used gene targeting to generate a knock-in mouse. At the translation initiation site of Reg4, we inserted a cassette consisting of a human diphtheria-toxin receptor (DTR) cDNA linked in frame to dsRed-Express2 fluorescent protein by using 2A peptide (hereafter referred to as DTR-Red) (Fig. S2). Heterozygous knock-in (Reg4DTR-Red/+) mice were healthy and fertile. DTR enables the selective removal of Reg4+ cells from colonic crypts, whereas dsRed allows their visualization.
Fig. S2.
A knock-in strategy to generate Reg4DTR-Red mice. (A) The top boxes depict the structure of the targeting vector, the second line represents the genomic region of the Reg4 gene, and the third line is the predicted structure of the Reg4 locus following homologous recombination. Reg4 exons are shown in black boxes on the second line, and white boxes indicate the translated region of Reg4. The translation initiation codon of Reg4 was replaced with DTR-P2A-dsRed-poly(A), flanked with a floxed neo cassette and poly(A) signal. The PGK-neo cassette was removed by crossing with the Flpe mouse, which ubiquitously expresses FLP recombinase. (B) Southern blot of BamH digests showing clones 4A2, 3D11, 4C8, and wild-type clone with no insertion, using the 5′ probe shown in A. The lower band (10 kb) represents the correctly targeted ES clone containing the insertion. The WT Reg4 allele (15 kb) was present in each positive clone and wild type. (C) PCR screening of ES cells confirmed the presence of DTR. At the 5′ end, a sense primer (L3) was paired with an antisense Reg4 gene exon primer (R3). These primers amplified 447 bp from wild type (Lower). The sense primer (L3) was also paired with an antisense DTR cDNA primer (DTR-R3). These primers amplified 657 bp (Upper).
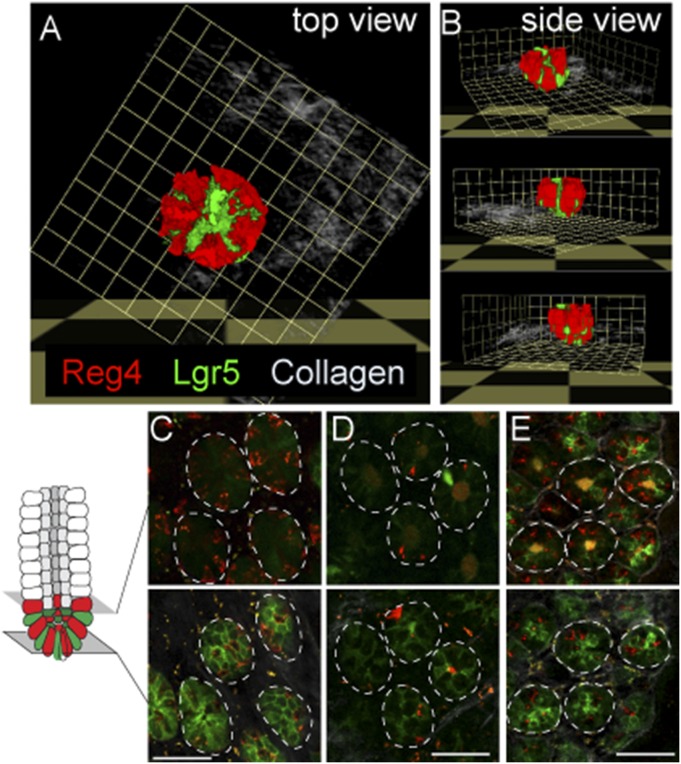
We readily detected dsRed in Paneth cells in the SI, but observed no red-fluorescent signals in pancreas, stomach, or liver (Fig. S1). We have since used the knock-in mice to search for rare Reg4+ secretory cell types in the SI. Unlike in the colon, Reg4 marks subsets of entero-endocrine cells in the SI (Fig. S1 A and C) (19). We confirmed these results by in situ hybridyzation using a Reg4-specific probe (Fig. S1). In the colonic epithelium, Reg4+ dsRed signals were tightly nested between Lgr5+ GFP stem cells at the crypt base throughout the entire colon (Fig. 1 D–F and Fig. S3).
Fig. S3.
Relationship between Reg4+ DCS cells and Lgr5+ stem cells in each part of colon. (A and B) Three-dimension reconstruct of Lgr5+ GFP (green) and Reg4+ dsRed (red) in crypt bottom of middle-colon from lateral projection of a z stack and representative views from top (A) and side (B). (C–E) Intravital imaging of Reg4+ DCS (red) and Lgr5+ GFP (green) in a different region of colon, cecum (C), proximal (D), and distal (E), respectively. (Scale bars: C–E, 50 µm.)
Furthermore, we counted the number of Reg4+ DCS and Lgr5+ stem cells in individual parts of the colon, cecum, proximal, middle and distal part of colon, respectively. In fact, approximately 20 Lgr5+ stem cells per crypt were detected in each region with the numbers being slightly higher in cecum and distal colon. However, the number of Reg4+ DCS cell numbers per crypt displayed regional differences: 12–14 Reg4+ cells in cecum, distal colon, 2 Reg4+ cells in proximal, and 8 Reg4+ cells in the middle part of the colon (Fig. 1 D–F and Fig. S3 C and E).
Characterization of Reg4+ DCS Cells by Comprehensive RNA-Sequencing Analysis.
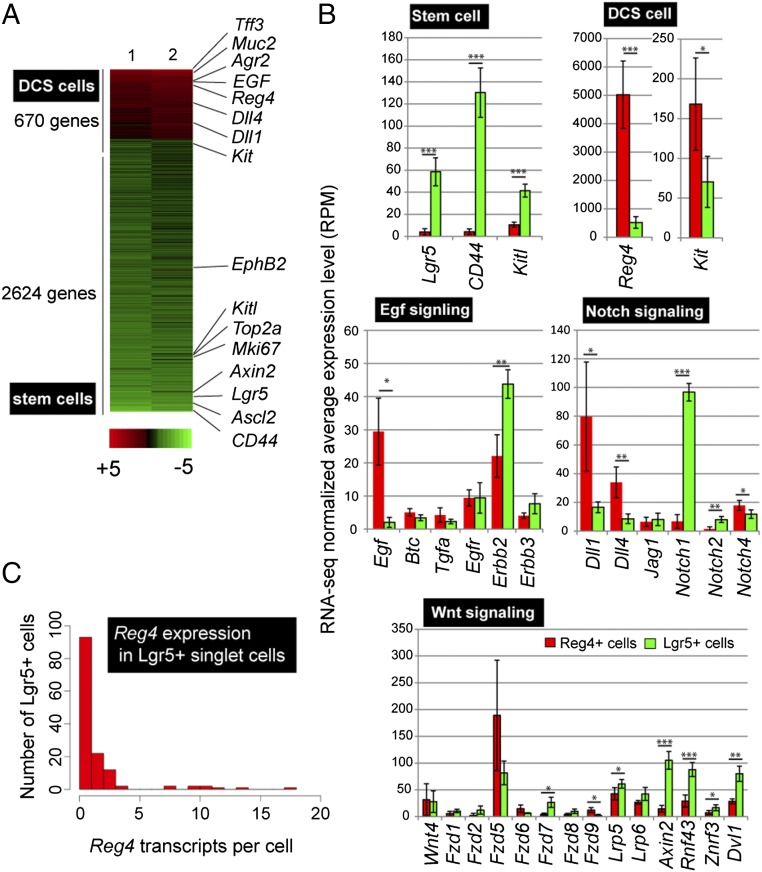
To define a global gene expression signature of DCS cells, we performed RNA-sequencing (RNA-seq) of sorted Reg4-dsRed+ and Lgr5-GFP+ cells from colonic epithelium. We identified 3,294 genes with >twofold expression differences between these two cell populations (Fig. 2A). The Reg4-dsRed+ fraction signature included the Notch ligands, Dll1 and Dll4, whereas vice versa Notch1 was expressed by stem cells (Fig. 2B). Egf was highly expressed by DCS cells, whereas its receptors Erbb2 was expressed in stem cells. Interestingly, EGF receptor (Egfr) was expressed in both stem cells and DCS cells (Fig. 2B). Both pathways are known to play a key role in the regulation of intestinal homeostasis (Fig. 2B) (20–22). As reported (9, 23), no canonical Wnt ligands were expressed in colon epithelial cells, but expression of the Wnt receptor Fzd5 was high in DCS and stem cells (Fig. 2B). Stem cell markers Lgr5, Cd44, EphB2, Ascl2, and Kitl were increased in the Lgr5-GFP+ population (Fig. 2 A and B). Conversely, markers of ckit+ subset of Goblet cells (Reg4, ckit, Agr2, Spdef, Spink4, and Tff3; ref. 14) were also highly enriched in the Reg4-dsRed+ population (Fig. 2 A and B) (14).
Fig. 2.
Transcriptome analysis of Reg4+ DCS cells. (A) Comprehensive gene expression pattern analysis by RNA-seq using sorted Reg4+ DCS and Lgr5+ stem cells. Heat map was generated by using genes with a minimal mean fold change of 2 between the two cell types, after which 3,294 genes were left. DCS cell genes are indicated in red and stem cell genes are shown in green. (B) Average (RPM) value of genes encoding marker for DCS cells, stem cells, and pathway components of Egf signaling, Notch signaling and Wnt signaling in Reg4+ cells (red) and Lgr5+ cells (green). Mean and SD are shown (n = 4). P values from two-tailed Student’s t test: *P < 0.05, **P < 0.01, ***P < 0.001. (C) Histogram shows the number of detected Reg4 transcripts in Lgr5+ sorted single cells. Transcriptomes of all cells with >1,500 transcripts were downsampled to 1,500 total transcripts.
Despite the fact that expression pattern analysis in Lgr5-GFP::Reg4-dsRed knock-in mice showed Reg4 expression to be specific for DCS cells, a modest signal for Reg4 was observed in stem cells in the bulk RNA-seq data (Fig. 2B, DCS cell). To further look into Reg4 expression in stem cells, we performed RNA-seq analysis on single Lgr5+ cells (19). This data represented that 93 cells of 138 Lgr5+ cells had no transcripts of Reg4, and 22 Lgr5+ cells expressed only a single Reg4 transcript emphasizing that most stem cells do not express Reg4 transcript (Fig. 2C). Of note, Reg4+ cell express on average 26.1 Reg4-transcripts per cell.
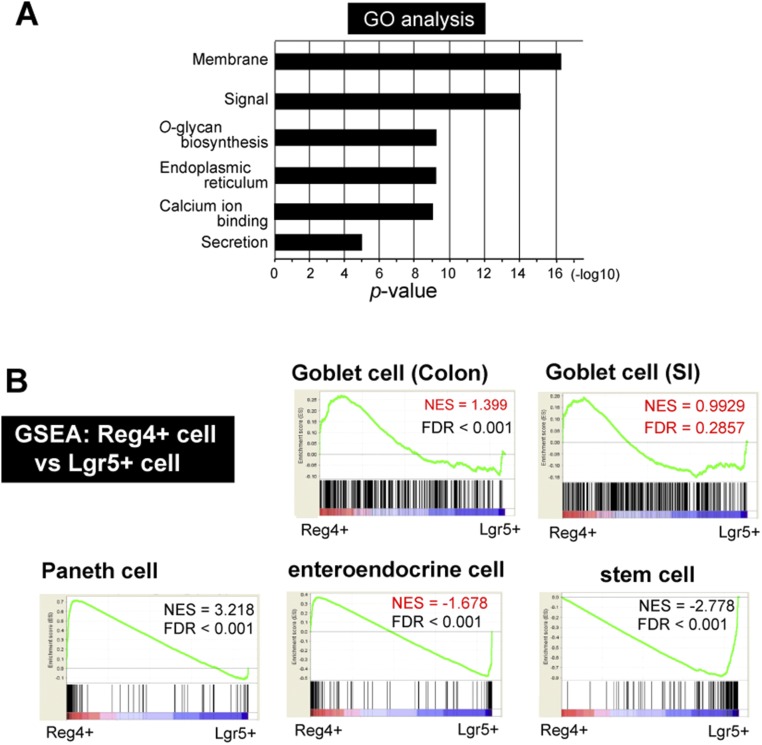
We performed Gene Ontology (GO) analysis and Gene Set Enrichment Analysis (GSEA). GO analysis indicated that Reg4+ DCS cells signature genes were enriched for genes required for membrane, signal, O-glycan biosynthesis, endoplasmic reticulum, calcium ion binding, and secretion (Fig. S4A). By GSEA analysis, we compared our data with gene signatures of Goblet cells in both SI and colon (24), Paneth cells, enteroendocrine cells (8), and stem cells in SI (25). Reg4+ cells from colonic crypts resembled Paneth cells, and were less related to Goblet cells from colon or SI, or to enteroendocrine cells (Fig. S4B). These data implied that the Reg4+ DCS cells represent a genuine lineage, related to the Paneth lineage, and that these cells do not represent a precursor to any of the other secretory lineages.
Fig. S4.
Characterization of gene signature of Reg4+ DCS cells in RNA-seq. (A) GO enrichment analysis for differentially expressed genes in Reg4+ DCS cells. The y axis shows the P value (−log10). (B) GSEA. Genes significantly enriched in Reg4+ (red, Left) and Lgr5+ (blue, Right) population are given on the x axis. Input gene sets were generated from public datasets: “Goblet cells in colon” and “Goblet cells in SI” were defined as the 200 most highly expressed in CD45−/CD24−/CK18+/UEA-1+ Goblet cells (GEO: GSE52418), 200 most differentially expressed genes in “Paneth cells genes” from sorted Paneth cells vs.Lgr5+ stem cells, in “enteroendocrine (ee) cells” from sorted ee cells vs. Lgr5+ stem cells (GEO: GSE25109), and “stem cell genes” in Lgr5-GFP high stem cells vs. Lgr5-GFP low daughter cells (GSE25109). FDR, false discovery rate; NES, normalized enrichment score. Reference of Goblet cell of Colon and SI; highly expressed in CD24− CK18+ UEA-1+ population (top 200 genes) Knoop et al. (24), Paneth, and enteroendocrine cell; genes enriched in sorted Paneth or enteroendocrine cells versus sorted Lgr5 stem cells (top 200 genes) Sato et al. (8), stem cell; Lgr5-GFP high versus low (top 200 genes) Muñoz et al. (25).
DCS Cell-Specific Ablation in Reg4DTR-Red Mice Induces Loss of Lgr5+ Stem Cells.
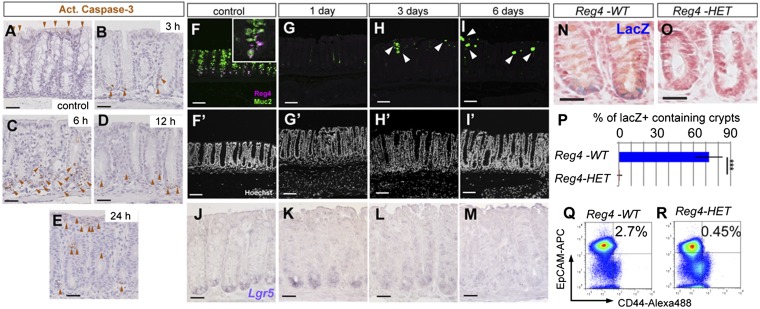
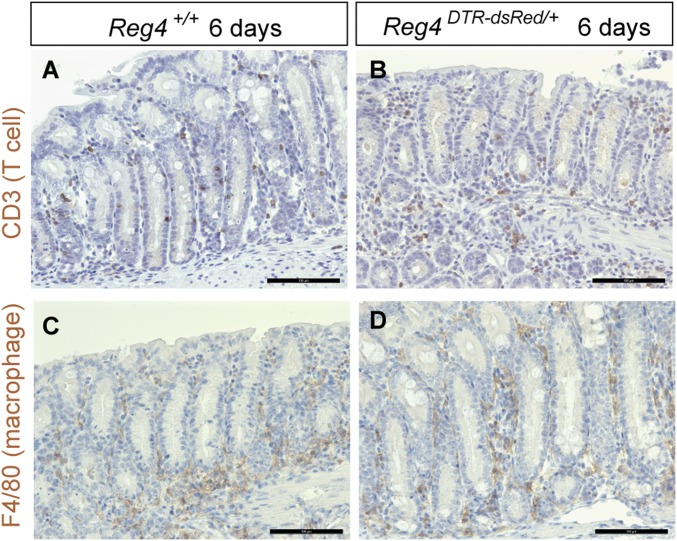
To address the functional significance of Reg4+ DCS cells in vivo, we administrated DT to Reg4DTR-Red mice to ablate DCS cells from colonic crypts. Upon DT administration, the first active caspase-3 positive (apoptotic) cells appeared at crypt bottoms 3 h after DT injection but were not observed in control crypts (Fig. 3 A and B). Numbers of apoptotic cells increased at 6 h after DT injection, and a few were still seen at bottom part of crypts at 12 h after DT injection (Fig. 3 C and D). Twenty-four hours after DT treatment, apoptotic cells were rarely seen at bottom part of crypt where Reg4-expressing cells exist (Fig. 3E). Administration of DT in Reg4DTR-Red mice over six consecutive days eliminated DCS cells virtually completely (Fig. 3 F–I). Of note, numbers of Goblet cells were also significantly decreased 3 and 6 d after DT administration (Fig. 3 H and I). Immune markers CD3 and F4/80 were absent in the region, from which we excluded ongoing inflammation (Fig. S5). We then checked whether Lgr5+ stem cells survived in the absence of Reg4+ DCS cells by Lgr5 mRNA in situ hybridization (ISH) analysis. Whereas Lgr5+ stem cells were not affected at 1 d after DT injection, their numbers were decreased by DT administration for 3 d (Fig. 3 J–M). Most Lgr5+ stem cells had disappeared following ablation of DCS cells for 6 d (Fig. 3M). However, Lgr5+ stem cells reemerged from 7 d after stopping DT administration (Fig. S6). To confirm this loss of stem cell at 6 d after DT administration, we also determined Lgr5 and Reg4 expression by high-resolution single-molecule fluorescent ISH (smFISH) (26). Lgr5+ stem cells were intermingled with Reg4+ cells in control crypts, but Reg4 and Lgr5 mRNA expression was not observed in crypts of Reg4DTR-Red mice DT-treated for 6 d (Fig. S7). We also used Lgr5-lacZ reporter mice to clearly visualize and quantify stem cells (7). At 6 d after DT administration, we rarely observed lacZ-positive cells in Reg4DTR-Red/+ Lgr5lacZ mice compared with Reg4+/+ Lgr5lacZ control mice (Fig. 3 N–P). Furthermore, we confirmed this loss of stem cells upon deletion of DCS cells by using a different colonic stem cell marker, CD44 (27). DT injected into control mice had ∼2.7 ± 0.24% stem cells as defined by CD44+/EpCAM+ (Fig. 3Q). This stem cell population was decreased in Reg4DTR-Red mice DT-treated for 6 d (Fig. 3R; CD44+/EpCAM+; 0.45 ± 0.27%). These results supported our hypothesis that Reg4+ DCS cells provide niche support for Lgr5+ colonic stem cells in vivo.
Fig. 3.
Lgr5+ colonic stem cells are lost upon ablation of DCS cells. (A–E) Active caspase-3 staining on DT-injected Reg4+/+ control mouse (A, n = 8 mice) and DT-injected Reg4DTR-Red mice at 3 h (B, n = 2 mice), 6 h (C, n = 2 mice), 12 h (D, n = 2 mice), and 24 h (E, n = 2). Apoptic cells were detected at the bottoms of crypts after administration of DT in Reg4DTR-Red mice (brown arrowheads in B–E), but not seen in control mice (A). (F–I) Daily DT administration for up to 6 d deleted DCS cells completely from colonic crypts. (F) Reg4 (magenta) and Muc2 (green) double positive-DCS cells were detected at the bottom part of crypt in DT-treated control Reg4+/+ mouse for 6 d (n = 6 mice). (G) One shot of DT eliminated all DCS cells and Goblet cells within 24 h (n = 6 mice). (H and I) DT treatment for 3 d (H, n = 4 mice) and 6 d (I, n = 4 mice) prevented reemergence of Reg4+ DCS cells, but a few goblet cells reappeared (white arrowheads). (F′–I′) Nuclei are stained with Hoechst (white). (J–M) Representative Lgr5 mRNA expression detected by a classical in situ hybridization in Reg4DTR-Red/+ mice. Lgr5 was present at the crypt bottoms of control (J, n = 8 mice) and after 1 d of DT treatment (K, n = 4 mice). The Lgr5 expression level became weaker after 3 d of DT (L, n = 4 mice) and was hardly detected for 6 d of DT treatment (M, n = 4 mice). (N–P) Visualization of stem cells in Lgr5-lacZ reporter mice in colonic crypts. Expression of lacZ was located at crypt base in Reg4+/+::Lgr5-lacZ (Reg4-WT) control mice 6 d after DT administration (N, n = 3 mice). No lacZ-positive cells were observed in Reg4DTR-Red/+::Lgr5-lacZ (Reg4-HET) mice 6 d after DT injection (O, n = 3 mice). (P) Quantification of Lgr5-lacZ–positive cells containing crypts in Reg4+/+::Lgr5-lacZ (Reg4-WT) control (n = 694 independent crypts in 4 mice) and Reg4DTR-Red/+::Lgr5-lacZ (Reg4-HET) (n = 1,087 independent crypts in 4 mice). (Q and R) FACS analysis of CD44+/EpCAM+ stem cell population from colonic crypts of Reg4-WT (Q, n = 3) control and Reg4-HET mice (R, n = 3) 6 d after DT injection. (Scale bars: A–E and J–M, 50 µm; F–I, 100 µm.)
Fig. S5.
Loss of Goblet cells in administrated Reg4-DTR-dsRed mice does not cause inflammation. Immunohistochemistory for CD3 (A and B) to detect T cells and F4/80 (C and D) to detect macrophages in colonic crypts from Reg4+/+ (A and C) and Reg4DTR-Red/+ (B and D) upon 6 d of DT administration. (Scale bars: 100 µm.)
Fig. S6.
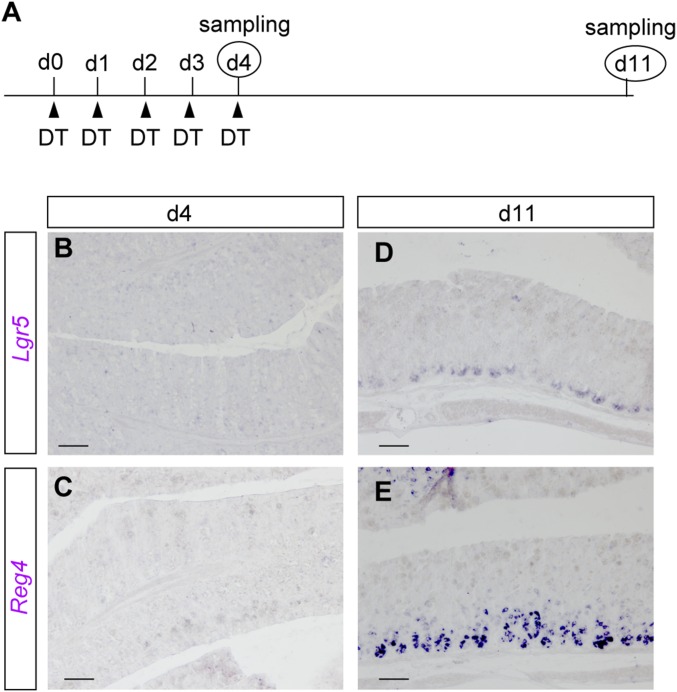
Lgr5+ stem cells recover again after their disappearance. (A) Dosing regimen used to follow the dynamics of Lgr5+ stem cell upon elimination of DCS cells. Reg4DTR-Red/+ mice were administrated DT daily for 4 d, and then kept for an additional 7 d without DT injection. (B–E) Lgr5 (B and D) and Reg4 (C and E) mRNA expression pattern after five daily DT injections (B and C), and 7 d after last DT-injected mouse (D and E). (Scale bars: 100 µm.)
Fig. S7.
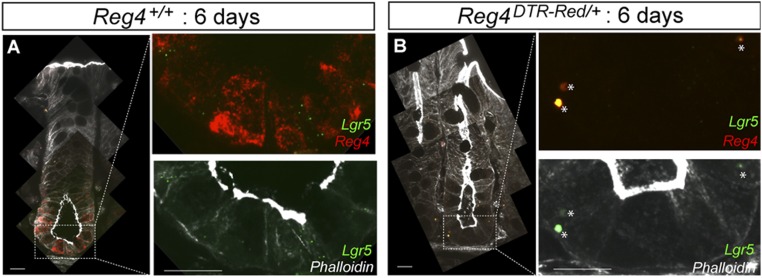
Confirmation of the phenotype of missing Lgr5+ stem cells by high sensitive single-molecule FISH. Shown are high sensitive two-color single molecule FISH using Lgr5 (green) and Reg4 (red) probes. Apical actin network was stained by phalloidin (white). Lgr5 is expressed between Reg4-expressing cells at crypt bottoms of Reg4+/+ upon 6 d of DT injection (A and B = 4 mice). Both Lgr5 and Reg4 expressions were not detected in Reg4DTR-Red/+ upon 6 d of DT administration (B). Asterisks indicate nonspecific signals. (Scale bars: 20 µm.)
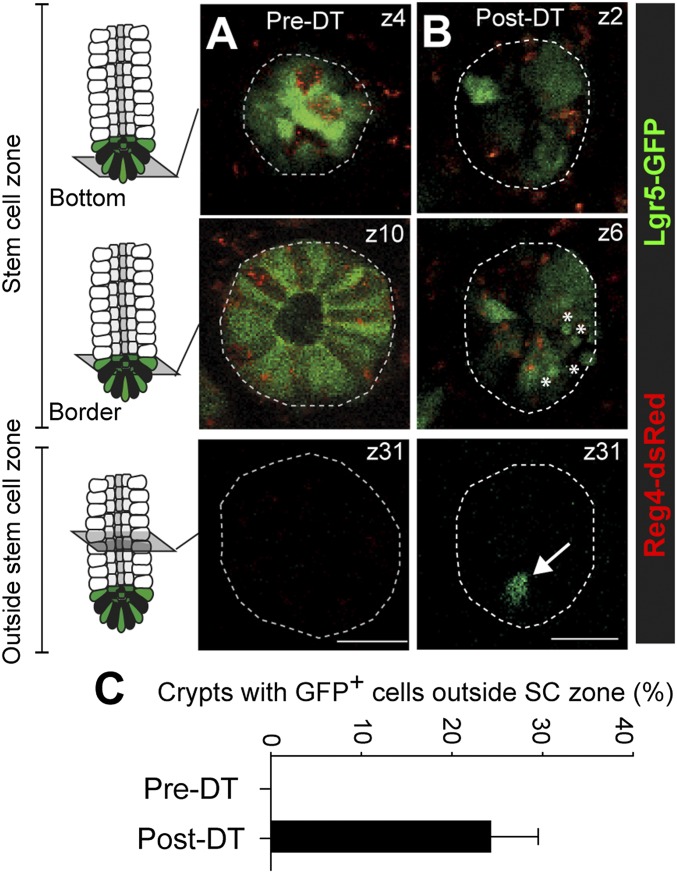
To visualize the dynamics of Lgr5+ stem cells following Reg4+ DCS cell depletion, we used intravital imaging in living mice (28). Before DT injection, we observed Lgr5-GFP+ stem cells intermingled with Reg4-dsRed+ DCS cells at the bottom part of crypts as shown in Fig. 1. In these untreated murine colonic crypts, Lgr5-GFP signals were detected within 35 µm from the bottom of crypts (stem cell zone) (Fig. 4A). Lgr5+ stem cells were never observed outside this region (Fig. 4 A and C). In contrast, after DT-mediated depletion of Reg4+ cells, Lgr5-GFP signals in the stem cell zone were diffuse and less bright, indicating that these stem cells started differentiation (Fig. 4B). We also observed GFP+ apoptotic bodies after DT administration, indicating that some stem cells died upon loss of surrounding Reg4+ cells (Fig. 4B, Middle). Furthermore, upon elimination of DCS cells, Lgr5-GFP+ cells were detected at abnormally high positions in crypts, outside the stem cell zone (Fig. 4 B, Lower and C). These results indicated that DCS cells support colonic stem cells by regulating cell differentiation and apoptosis as well as stem cell localization.
Fig. 4.
Lgr5+ stem cell dynamics upon elimination of DCS cells in living Reg4DTR-Red mice. (A and B) Intravital imaging of Lgr5-GFP::Reg4DTR-Red mice to follow the dynamics of colonic stem cells and DCS cells after targeted ablation of Reg4+ cells (in red), induced by 4–6 d of DT administration. Shown are representative x-y images of crypts at indicated z-stack positions, without treatment (A) and after administrations of DT (B). Note the appearance of Lgr5+ cells (green) outside the stem cell zone upon depletion of Reg4+ cells (indicated by an arrow at B, Lower). Apoptotic bodies are indicated by asterisks (B, Middle). Dotted lines indicate crypts. (C) Graph shows presence of Lgr5+ cells outside the stem cell zone in crypts before and after depletion of Reg4+ cells (n = 179 and 167 crypts pre-DT and post-DT respectively, in 3 mice). Error bars represent SEM. (Scale bars: 25 µm.)
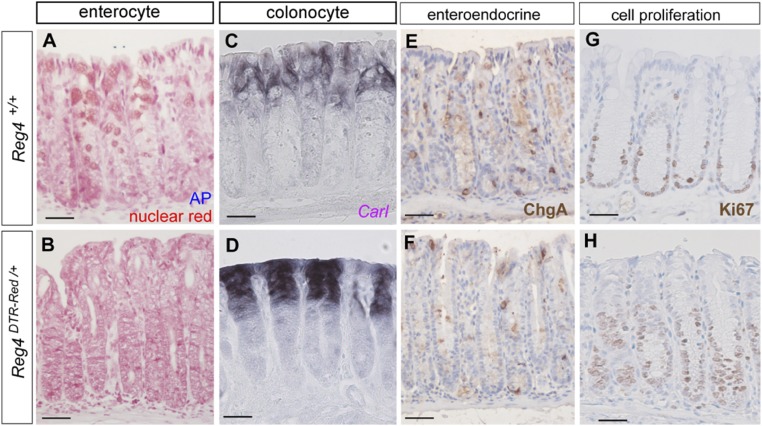
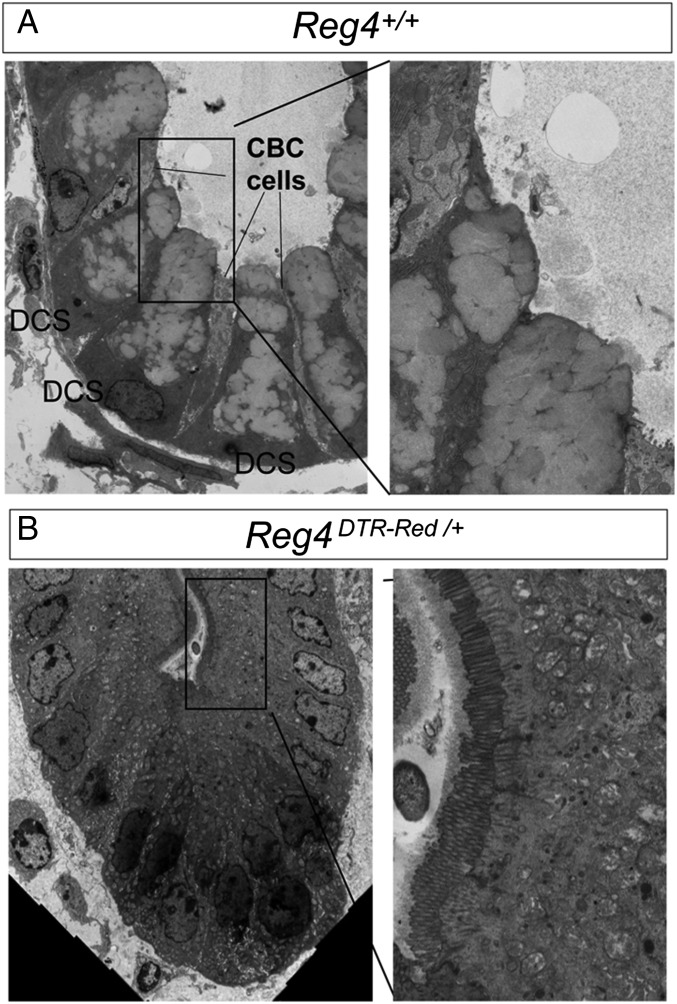
To further analyze which cell types occupied colonic crypts upon DCS depletion, we analyzed differentiation marker expression in crypts of DT-treated Reg4DTR-Red/+ mice. Colonic crypt base without stem and DCS cells did not contain alkaline phosphatase or Carbonic anhydrase I positive entero/colonocytes (Fig. S8 A–D). We also analyzed the expression of the enteroendocrine marker ChromograninA (ChgA). After DT injection, staining for ChgA in Reg4DTR-Red/+mice was similar to that of control mice, with sporadic ChgA+ cells at crypt bottoms (Fig. S8 E and F). An increase of Ki67+ cell numbers at the crypt base was observed, causing an enlarged proliferative compartment compared with control mice (Fig. S8 G and H). In addition, ultrastructure analysis of Reg4DTR-Red/+ mice confirmed stem and DCS cells to be completely absent (Fig. 5). Remarkably, none of the remaining cells showed mucus-containing granules, but instead displayed uniform polarization including densely packed apical microvilli (Fig. 5B). Taken together, those results indicate that the function of DCS cells as epithelial niche is to (i) tether stem cells to stem cell zone, (ii) control apoptosis, and (iii) maintain stemness to prevent cell differentiation. In the absence of DCS cells, Lgr5 stem cells disappear and are replaced by proliferative cells with characteristics of enterocyte-lineage cells.
Fig. S8.
Marker expression analysis of crypts after DT administration. (A and B) Alkaline phosphatase staining (enterocyte, blue) and nuclei are stained with nuclear red (red) as a counterstain in control (A) and Reg4DTR-Red/+ mouse 6 d after DT injections (B). (C and D) In situ hybridization using CarI-specific antisense mRNA probe (purple, colonocyte marker) in control (C) and Reg4DTR-Red/+ mouse 6 d after DT injections (D). (E–H) Immunohistochemistry analysis of ChgA (E and F: enteroendocrine cell), and Ki67 (G and H) are carried out in control (E and G) and Reg4DTR-Red/+ (F and H) 6 d after DT administration. (Scale bars: 50 µm.)
Fig. 5.
Cell fate determination of colonic epithelium is disturbed without Reg4+DCS cells. (A and B) Transmission electron microscopy showing ablation of CBC cells and DCS cells and the presence immature enterocyte cells having numerous brush borders in Reg4DTR-Red/+ mouse upon DT administration (B) in comparison with control mice (A).
DCS Cells Are Important to Maintain Gut Homeostasis.
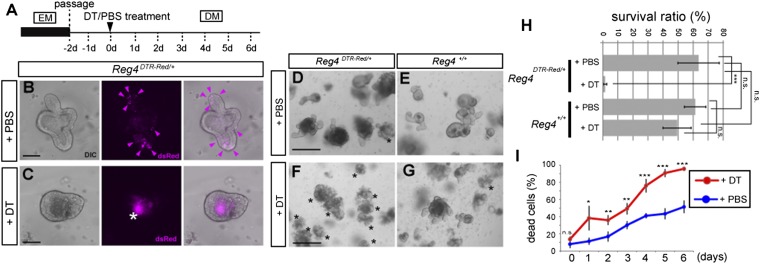
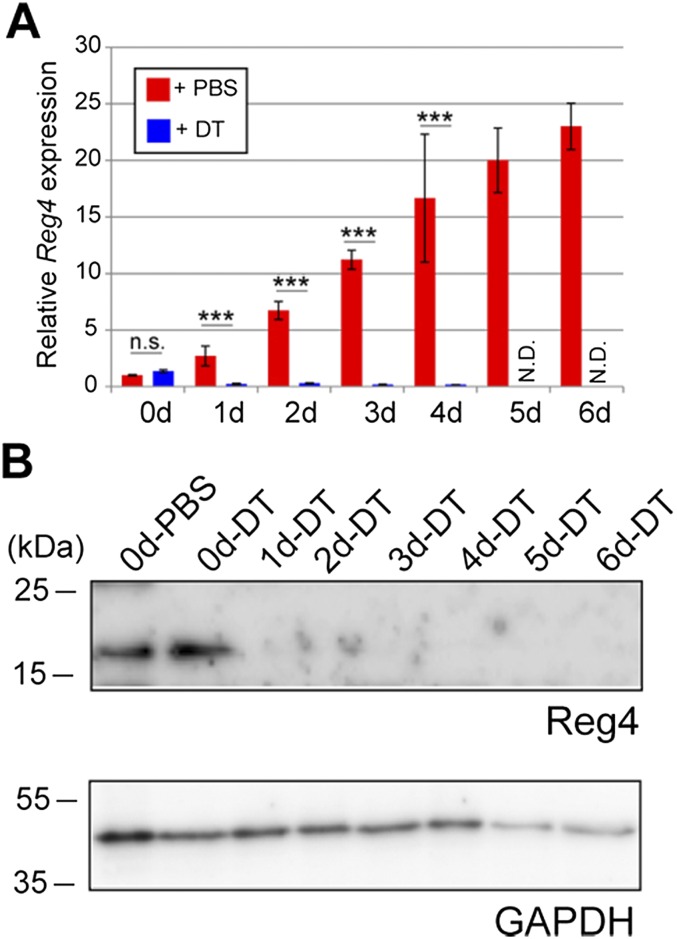
Because daily DT injections beyond 6 d resulted in severe liver damage (as observed; ref. 29), we could not assess long-term effects of DCS ablation in vivo. We therefore analyzed ex vivo mouse colonic organoids/miniguts (Fig. 6A and Materials and Methods) (30). In agreement with their in vivo localization, we observed Reg4-dsRed+ DCS cells in organoid buds (Fig. 6B). We could deplete Reg4-dsRed+ DCS cells upon addition of DT to the medium (Fig. 6C). DCS cell elimination from organoids was confirmed by monitoring Reg4 mRNA and protein expression over time (Fig. S9). We then cultured Reg4DTR-Red and wild-type colonic organoids with or without DT. Both types of organoids treated with PBS survived for long periods with many budding structures (Fig. 6 D, E, H, and I). DT did not affect growth of wild-type organoids (Fig. 6G), yet killed Reg4DTR-Red organoids within 6 d (Fig. 6 F, H, and I).
Fig. 6.
DCS cells are required for maintenance of colon organoids. (A) Dosing regimen used to study the elimination of Reg4+ cells in Reg4DTR-Red/+ colonic organoid. DM, differentiation medium; EM, expansion medium. (B and C) Organoids derived from isolated colonic crypts of Reg4DTR-Red/+ mouse were cultured in differentiation medium with PBS (B) or 67 ng⋅mL−1 DT (C) for 3 d. The expression of dsRed (magenta) was observed at budding structures in PBS-treated organoids (B, arrowheads) and inside lumen in DT-treated organoids (as auto-fluorescent background signal of apoptotic cells, asterisk) (C). Images are representative of four independent experiments. (D–G) Effect of deletion of Reg4+ DCS cell in colonic organoid derived from Reg4DTR-Red/+ (D and F) and wild type (E and G). Organoids after treatment with DT (F and G) or PBS (D and E) for 6 d. Asterisks indicate dead organoids. Reg4DTR-Red/+ treated with DT organoids were lost. Images are representative of four wells as biological replicates and repeated in two independent experiments. (H) The survival ratios of each organoids are shown (mean ± SD for four wells as biological replicates and repeated in two independent experiments) by two-way analysis of variance (ANOVA). (I) The percentage of dead cells of Reg4DTR-Red/+ organoids counted by FACS using propidium iodide in the presence of DT (red) and PBS (blue). Data are representative of four times technical repeated with mean ± SD (two-tailed Student's t test). *P < 0.05, **P < 0.01, ***P < 0.001, n.s., not significant. (Scale bars: B and C, 20 µm; D–G, 100 µm.)
Fig. S9.
Confirmation of Reg4 expression at both mRNA and Protein level. Time course of Reg4 mRNA expression in Reg4DTR-Red/+ organoid that was treated by DT and PBS at 0, 1, 2, 3, 4, 5, and 6 d after DT administration. (A) qRT-PCR analysis represented mRNA expression of Reg4 in Reg4DTR-Red/+ organoids cultured with PBS (red) and DT (blue). (B) Western blot analysis of Reg4 and GAPDH was used as a loading control.
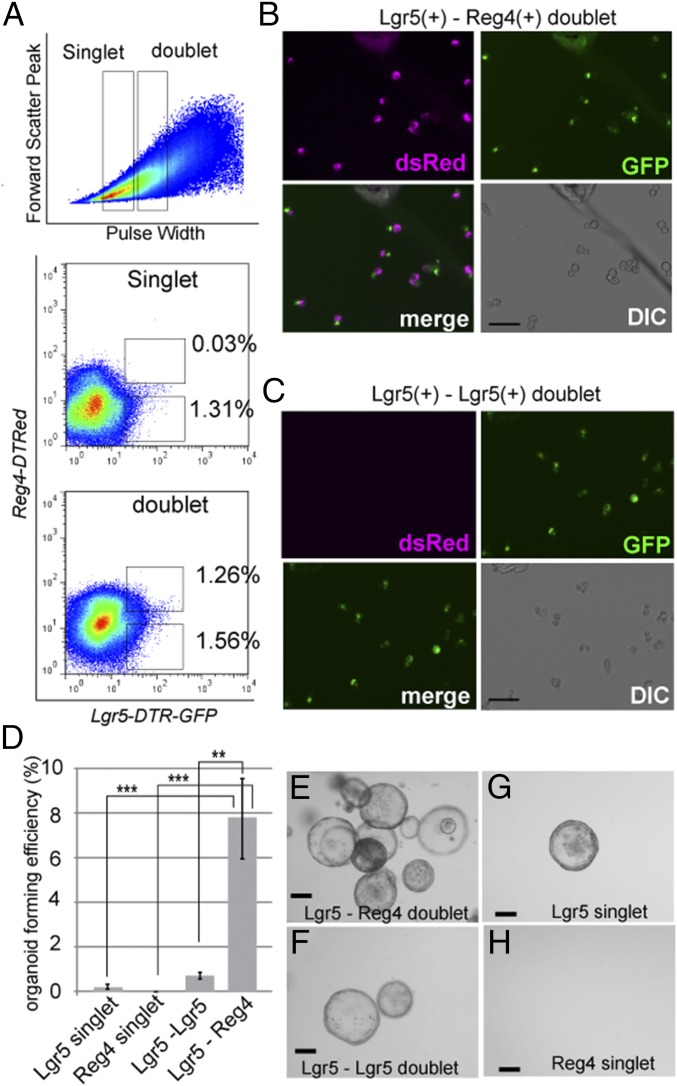
Furthermore, to ask whether Reg4+ DCS cells functionally support Lgr5+ colonic stem cells, we applied a FACS-based organoid-forming assay to sort cells in several combinations, as done by us for Paneth cells and SI stem cells (8): Lgr5+ (stem cell) singlet, Reg4+ (DCS cell) singlet, Lgr5+-Lgr5+ homotypic doublets, or Lgr5+-Reg4+ heterotypic doublets (Fig. 7 A–C). Sorted stem cell singlets and stem-stem doublets generated organoids at low efficiency (0.05% and 0.68%), and Reg4+ DCS cell singlet did not show any organoid formation (Fig. 7 D, G, and H). However, we observed that stem-DCS doublet displayed a strongly increased plating efficiency compared with Lgr5+ singlets at 8% plating efficiency (Fig. 7 D and E). These results agree with the observation of Rothenberg et al. that cKit+ Goblet cells support organoid formation of Lgr5+ stem cells (14). Consequently, the in vivo and ex vivo data strongly support our hypothesis that DCS cells act as niche for intestinal stem cell in colonic crypts.
Fig. 7.
Reg4+ DCS cells promote organoid formation from sorted colonic stem cells. (A) FACS plots of dissociated single cells from Reg4DTR-Red/+::Lgr5DTR-GFP/+ colon. Singlets and doublets are gated by forward scatter peak and pulse width parameter. Reg4-dsRedhi/Lgr5-GFPhi events are only observed in the doublet gate (frequency of doublet events: 1.26 ± 0.105%, singlets: 0.0323 ± 0.0119%). (B and C) Lgr5+ stem cell (green)-Reg4+ DCS cells (magenta) doublets (B, Lgr5-GFPhi/Reg4-dsRedhi) and Lgr5 stem cell doublets (C, Lgr5GFPhi/Reg4dsRedneg) were sorted and imaged by inverted microscope. Images are representative of three independent experiments. (D) Plating efficiency of Lgr5 stem cells-DCS doublets, Lgr5 stem cell doublets, single Lgr5 stem cells, and Reg4+ cells. For each, 1,000 singlets or doublets were embedded in matrigel, and numbers of organoids were counted 10 d after plating. y axis indicates organoid-forming efficiency as a percentage of total number of plated cells (mean ± SD for three independent experiments by two-way ANOVA. **P < 0.01, ***P < 0.001. (E–H) Organoids are formed from Lgr5-Reg4 doublets (E). Far fewer organoids were formed from Lgr5-Lgr5 doublet or Lgr5 singlets (F and G). Sorted Reg4 singlet never formed organoids (H). Images are representative of three independent experiments. (Scale bars: B and C, 20 µm; E and F, 100 µm.)
Differentiation of DCS Cells Is Regulated by Notch and Wnt Signaling.
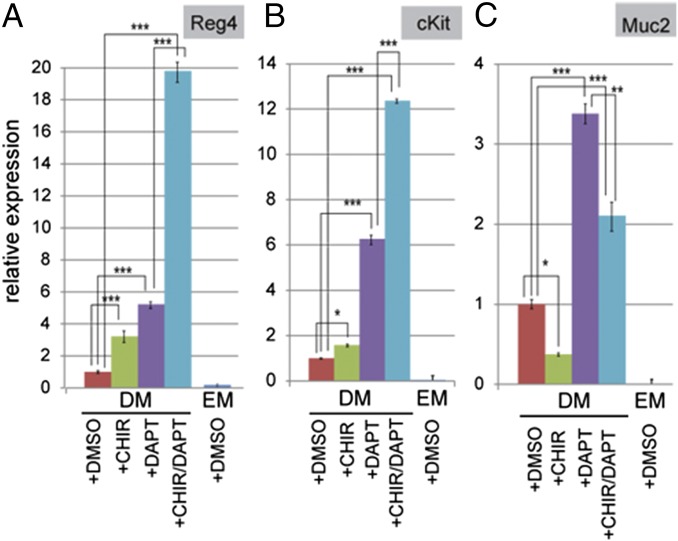
Finally, we asked whether simultaneous inhibition of Notch signaling and activation of Wnt signaling might drive cells into the DCS cell fate, because we have described for Paneth cells (9, 31, 32). We administrated CHIR99021 (CHIR or C), a potent glycogen synthase kinase 3β inhibitor to activate Wnt signaling and/or N-(3,5-difluorophenacetyl)-l-alanyl-S-phenylglycine t-butyl ester (DAPT or D), a γ–secretase inhibitor that blocks Notch signaling. We then determined expression of Reg4, cKit, and Muc2 (DCS cell and Goblet cell markers, respectively) by quantitative real-time PCR (qPCR) analysis. We observed that treatment with CHIR induced the Reg4 and cKit expression slightly, but decreased the expression level of Muc2 expression, which is marker of Goblet cells (Fig. 8 A–C). The addition of DAPT induced the number of dsRed+ cells: Marker gene expression was increased prominently, and Muc2 expression was also enhanced (Fig. 8 A–C). These results were consistent with previous reports that the loss of Notch signaling induces the secretory cell differentiation of colonic stem cells (14, 20, 33, 34). The combination of CHIR and DAPT administration dramatically induced DCS cell differentiation, and the expression levels of Reg4 and cKit increased 19- and 12-fold, respectively (Fig. 8 A and B). Significantly, Goblet cell marker expression in both CHIR and DAPT treatment was reduced compared with that in DAPT-only treatment (Fig. 8C). These results imply that inhibition of Notch signaling forces stem cells to differentiate toward secretory lineage cells (including Goblet and DCS cells), whereas concomitant activation of Wnt signaling is required to suppress Goblet cell differentiation yet drives DCS cell differentiation.
Fig. 8.
Forced differentiation of colonic stem cells into DCS cells. Quantitative real-time PCR analysis of relative mRNA expression of markers for colon DCS cells (Reg4 and cKit in A and B) and Goblet cells (Muc2 in C) cultured for 7 d under conditions as indicated. Reg4DTR-Red colon organoids culture in expansion medium (EM) or in differentiation medium (DM) with DMSO, 3 µM CHIR, 10 µM DAPT, and a combination of 3 µM CHIR/10 µM DAPT. y axis indicates relative gene expression. Error bars indicate mean ± SD for three wells as biological replicates and repeated in two independent experiments (two-way ANOVA). *P < 0.05, **P < 0.01, and ***P < 0.001.
Discussion
In the present study, we demonstrate that DCS cells, first identified in 1983, contribute to the epithelial niche of colonic stem cells in adult mice. The DCS cells are located at bottoms of colonic crypts, coexisting with crypt base columnar (CBC) cells marked by Lgr5 (7). Detailed observations using electron microscope by Altmann and the current study, high-resolution intravital imaging analysis, and high-sensitive smFISH analysis in this study reveal that Reg4+ DCS cells are intermingled between Lgr5+ CBC cells (Fig. 1D and Fig. S7) (13). Recently, Clarke and coworkers reported that cKit is expressed by DCS cells in colon, and by Paneth cells in the SI. Functionally, they showed that cKit+ crypt base Goblet cells support colonic organoid formation by Lgr5+ stem cells. However, the function of their cKit+ Goblet cells was neither addressed in ex vivo colon organoids nor in mouse colon tissue in vivo. To do so, we generated a DTR knock-in mouse targeting the Reg4 locus. This knock-in mouse allowed us to show the loss of Lgr5+ colonic stem cells upon elimination of DCS cells from adult mouse colon. Ex vivo colonic organoid cultures critically depend on DCS cells because their absence is incompatible with survival of colon epithelium. These data support a role of DCS cells as niche for colonic stem cells, among others by providing Notch and EGF signals. Like Paneth cells (8), the sorted Reg4+ DCS cells express the Notch ligands Dll1/Dll4 as well as EGF. However, one big difference between DCS cells and Paneth cells involves the absence of Wnt ligand production by the former, whereas Paneth cells produce high levels of Wnt3 (9). Our RNA-seq data also demonstrates that colonic stem cells express Wnt receptors: Fzd family members and Lrp5/6. Previous studies have shown that some Wnt ligands are expressed by stromal tissue surrounding colonic crypts to stimulate Wnt signaling in colonic stem cells (9, 23). Therefore, these mesenchymal tissues likely contribute to the colonic niche as well (35, 36).
The DCS cells dominantly expressed ligands of Notch signaling (Fig. 2B). It has been reported that disruption of Notch signaling induces aberrant terminal cell differentiation and reduced cell proliferation of colonic epithelium in Dll1/4 double knockout, Hes1/3/5 triple knockout, and Pofut1 knockout mice (21, 37, 38). Taken together, we conclude that the dominant expression of Notch ligands on DCS cells most likely serves as their most prominent niche function for colonic stem cells to control of gut homeostasis.
We observed loss of Lgr5+ stem cells from DCS cells-depleted crypts in Reg4DTR-Red/+ mice. However, stem cells recovered 7 d after the last DT administration (Fig. S6). Recently, it has been reported that homeostasis of intestinal epithelium is maintained by plasticity of daughter cells. When intestinal stem cells are eliminated by damage, differentiated cells such as secretory precursors and/or enterocytes can dedifferentiate into stem cells in vivo and generate normal intestinal epithelium again (29, 39, 40). We show here that colonic crypts also display robust, bona fide regeneration upon injury.
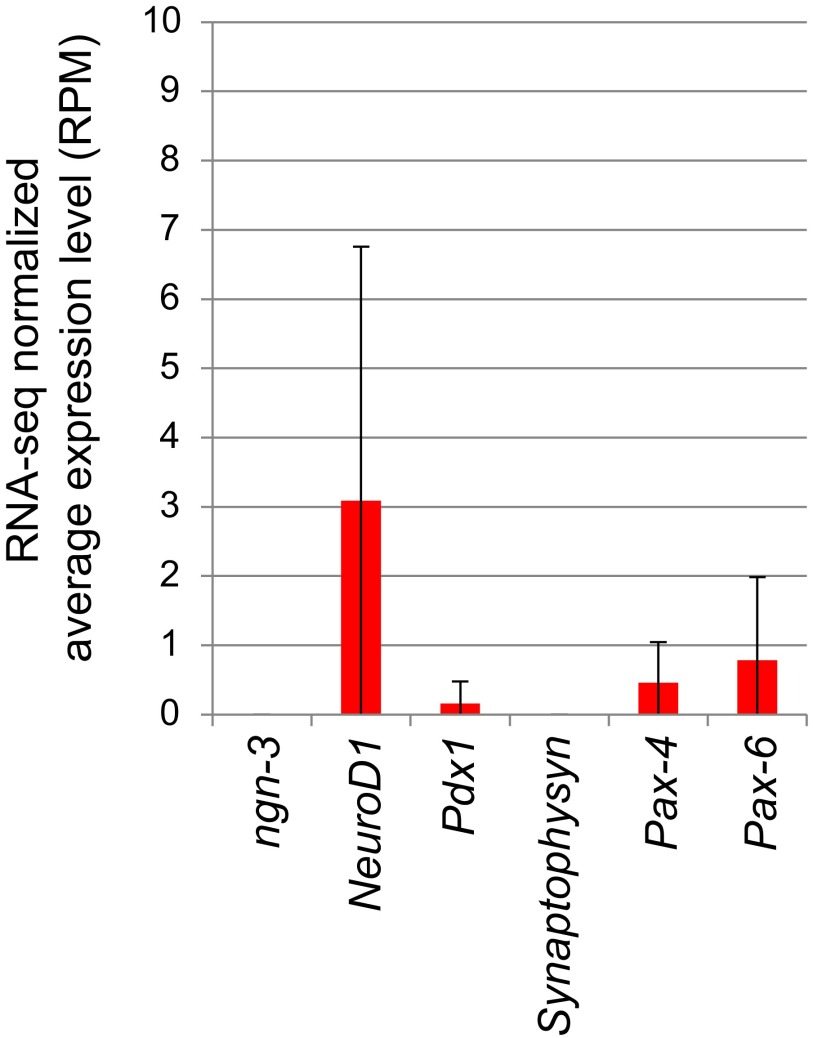
Whereas we used Reg4 as a marker of enteroendocrine cells in murine SI (Fig. S1C) (19), the enteroendocrine markers Ngn3, NeuroD1, Pdx1, Synaptophysyn, Pax4, and Pax6 were virtually absent in RNA-seq data of Reg4+ cells in colonic crypts (Fig. S10). Likewise, colonic crypts of Reg4DTR-Red/+ mice still contained enteroendocrine cells after administration of DT (Fig. 5F). Collectively, those data indicate that Reg4 is a specific marker of DCS cells in murine colon.
Fig. S10.
Enteroendocrine marker genes expression in Reg4+ cells in colon. Average RPM of enteroendocrine cells markers, ngn-3, NeuroD1, pdx1, synaptophysyn, and pax-4/-6 in Reg4-expressing cells at colonic crypts from RNA-seq data performed in Fig. 2. Those marker genes expression were hardly detected (only a few expression <3 RPM).
Reg4+ dsRed expression in Reg4-DTR-dsRed mice was detected in every colonic crypt, from ceacum to distal part of the colon, faithfully recapitulating endogenous Reg4 mRNA expression. Both numbers of Reg4+ DCS cells and Lgr5+ stem cells were higher in ceacum and distal part than that in proximal part of colon (Fig. 1 E and F). Whereas DCS numbers are relatively low (at two DCS cells) in proximal colon, we have reported that a single Paneth cell suffices to maintain stem cells in SI crypts (8).
Reg4+ cells are also identified within colorectal tumor tissue in man (41–45). Our group showed a positional relation between Lgr5+ stem cells and Reg4+ cells in mouse colon adenoma. Reg4+ cells were observed in scattered pattern in colon adenoma in APCmin mouse (41). This expression pattern of Reg4 might suggest that Reg4+ cells in adenoma also act as a niche for cancer stem cells. Elucidation of the full function of the Reg4+ epithelial niche in cancers will provide further insight into cancer stem cell biology cancer and may uncover novel therapeutic strategies for colorectal cancer.
Materials and Methods
Generating Reg4DTR-Red Knock-In Mice.
Reg4-Diphteria-Toxin-Receptor-2A-dsRed express2 (DTR-Red) knock-in mice were generated through homologous recombination in embryonic stem (ES) cells as shown in Fig. S2. The gene-targeting strategy using ES cells was similar to our described approach (46). Positive clones of homologous recombinant ES cells were injected into blastocysts derived from C57BL/6 mouse by using the standard method. Δneo mouse lines were established by crossing the mice with the general FLP deleter strain (Jackson Laboratories). Mouse tails genomic DNA were used for genotyping by PCR using allele-specific primers shown in Fig. S2. Reg4DTR-Red mice were crossed to Lgr5-DTR-eGFP mice for doublet organoid forming assay in sorting experiments and to show expression of Lgr5+ and Reg4+ cells in vivo (29), to Lgr5-lacZ mice to visualize colonic stem cells (7), and to Lgr5-GFP-ires-CreERT2 for following dynamics of Lgr5+ stem cells upon DCS cells ablation in intravital imaging (7). All experiments were approved by the Animal Experimentation Committee of the Royal Dutch Academy of Science.
Diphtheria Toxin Injection.
Adult mice (2–5 mo) were injected i.p. with 50 µg⋅kg−1 of diphtheria-toxin solution (Sigma) in PBS every 24 h.
Immunohistochemistry and Imaging.
Immunohistochemistry was performed as described (46). The following antibodies were used for immunostaining: anti-active caspase-3 (Cell Signaling; 1:400), anti–β-catenin (BD Biosciences, 1:100), and anti-mki67 (MONOSAN, 1:1,000) antibody. For double immunofluorescent imaging, tissues were prepared as for immunohistochemistry. For Reg4 and Muc2, antigen retrieval involved 10 min of boiling in 0.01 M citrate buffer, pH 6.0; staining involved anti-Reg4 (R&D Systems; 1:100), anti-Muc2 (Santa Cruz; 1:300) antibody in blocking solution (1% blocking buffer in 0.1% PBS-Triton X-100). Signals were detected by using donkey anti-rabbit IgG antibody Cy3 conjugated (Jackson; 1:500), donkey anti-goat IgG antibody Alexa 568 conjugated (Invitrogen; 1:300), and nuclear dye Hoechst 33258 (Invitrogen; 1:3,000). Images were captured by using an SP5 confocal microscope (Leica). Conventional in situ hybridization and high-resolution, single-molecule FISH was performed as described (26, 46).
Intravital Imaging.
All intravital imaging experiments were approved by the animal ethical committee of the Netherlands Academy of Sciences, The Netherlands. Animals were kept at the Hubrecht animal facility in Utrecht, The Netherlands. For determination of expression patterns, mice were sedated by using isoflurane inhalation anesthesia (∼1.5% isoflurane/O2 mixture) and the imaging site was surgically exposed. For monitoring stem cells after targeted depletion of Reg4+ cells, an abdominal imaging window was surgically implanted as described (47). For all intravital imaging experiments, mice were placed with their head in a facemask within a custom-designed imaging box. The imaging box and microscope were kept at 36.5 °C by using a climate chamber. Intravital images were acquired with an inverted Leica TCS SP5 AOBS two-photon microscope with a chameleon Ti:Sapphire pumped Optical Parametric Oscillator (Coherent) equipped with a 25× (HCX IRAPO; N.A. 0.95, WD 2.5 mm) water objective, two hybrid detectors (HyDs), and two nondescanned detectors (NDDs). DsRed and GFP were excited at 960 nm, and their emission was detected in HyD1 (555–680 nm) and HyD2 (500–550 nm). Collagen I was visualized by second harmonic generation signal, generated by 960-nm excitation and detected in NDD2 (455–505 nm). For 3D reconstruction, z stacks of typically 100 images were acquired with a 0.5- to 1-μm z-step size, for other analyses z stacks with a z step of 2.5 μm were made.
Data Analysis of Intravital Imaging.
For analysis of expression patterns, acquired images were processed by using Match1 motion compensation software program to correct for rigid and elastic tissue deformation. ImageJ was used to enhance the red signal of the Reg4+ dsRed cells. The numbers of Reg4+ dsRed cells per crypt were counted manually in Z stacks, and multiple counts of the same cell in different slices were avoided by marking cells in each plane. Three-dimensional representation was created by using Volocity (Improvision Ltd.). For analysis of Reg4-depletion experiments, acquired z stacks were analyzed by using ImageJ.
Vibratome Sectioning.
Isolated intestinal tissue were sliced open and fixed overnight in 4% (wt/vol) paraformaldehyde (PFA) solution at 4 °C. Fixed organs were embedded in 4% (wt/vol) UltraPure Low Melting Point Agarose (Invitrogen) and vibratome-sectioned (Leica VT 1000S) at 100 µm. Then, 100-µm sections were mounted in Hydromount (National Diagnostics) and analyzed within 24 h for dsRed expression by either confocal microscope (Leica SP5) or inverted microscope (EVOS; Advanced Microscope Group).
Colonic Organoid Culture.
Mouse colon organoids were established from isolated crypts slightly modified as described (30). Long-term colonic organoid culture required expansion medium (Advanced DMEM/F12 with penicillin/streptomycin, 10 mM Hepes, GlutaMAX, 1× B27; Invitrogen) and 1 µM N-acetylcysteine (Sigma), supplemented with 50 ng⋅mL−1 human recombinant EGF (Peprotech), 0.5 µM A83-01 (Tocris), 3 µM SB202190 (Sigma), 1 µM nicotinamide (Sigma), Wnt3A-condition medium (CM) (50% final concentration), Noggin-CM (10% final concentration), and R-Spondin1-CM (10% final concentration), as described (9, 30). Colon organoid differentiation medium was made by leaving out SB202190, Nicotinamide, Wnt3a-CM, and EGF. CHIR99021 (Stemgent, 3 μM) and DAPT (Sigma, 10 μM) were used to force the differentiation into DCS cells in cultured organoid.
Flow Cytometry and Culture in Doublet Assay.
Colonic crypts were isolated by using the protocol described (48). For single-cell or doublet cell culture, crypts were collected in TrypLE (Life Technology) containing 2,000 U/mL DNaseI (Sigma), and single cells or doublet cells suspensions were obtained by incubation at 37 °C for 30 min. Dissociated cells were filtrated by 20-µm cell strainer (Celltrix), and cells were washed twice in Advanced DMEM/F12 (AdDMEM). Cells were resuspended on ice in 500 µL of AdDMEM with DNaseI and analyzed by MoFlo (DAKOCytomation). Dead cells were eliminated by gating of forward/side scatter, forward/pulse-width parameters, and negative staining for 7-AAD (eBioScience). Sorted cells were collected into 1.5-mL tubes containing culture medium, pelleted, and embedded in Matrigel (BD Bioscience), followed by seeding on 48-well plate (1,000–2,000 singlet or doublets in 20 μL of Matrigel per well). For the first 2–3 d, sorted cells were incubated in expansion medium containing Y-27632 (10 µM).
Counting CD44+ Stem Cells by Cell Sorting.
Colonic crypts from control (Reg4+/+) and Reg4DTR-Red/+ mice 6 d after DT sequential administration were isolated by using the same protocol as described (48). For making single-cell suspension, isolated crypts were treated by Accutase (Stemcell Technologies) containing 2,000 U/mL DNaseI at 37 °C for 30 min. Cells (2–6 × 10⁶/mL) were stained with antibodies of Alexa 488 anti-CD44 (BioLegend; 1:125) and APC anti-EpCAM (eBioscience; 1:100) for 30 min on ice. After washing, cells were analyzed by moflo (DAKOCytomation) with using 7-AAD to exclude dead cells. Data analysis was performed by FlowJo software.
Statistics.
Results of three or more independent experiments are given as the mean ± SEM. Statistical analyses were performed with Excel (Microsoft) by applying the two-tailed test in mean values of two-sample comparison. The statistical significance in mean values among multiple groups was examined with Tukey–Kramer's multiple comparison test after two-way ANOVA by using the Prism5 software. Significant differences of means are indicated: *P < 0.05, **P < 0.01, and *** P< 0.001.
Microarray Analysis.
Single Lgr5-GFP+ cells or CD24+/Side scatter cells from SI and colon, respectively, were sorted into Buffer RLT directly in the RNeasy Micro kit according to the manufacturer’s procedures (Qiagen). Microarray analysis (Agilent) was performed as described (48). Heat maps were made by using Treeview software.
CEL-Seq Library Preparation.
Bulk RNA samples and cDNA libraries were prepared and sequenced as described (19). Single-cell libraries were prepared similarly, with the exception of being sequenced on an Illumina NextSeq500 by using 75-bp paired-end sequencing.
Analysis of RNA-seq Data.
Paired-end reads were quantified as described before with the following exceptions (49). Reads that did not align, or aligned to multiple locations, were discarded. Unique molecular identifiers (UMIs) were ignored; instead, read counts for each transcript were determined by the number of reads that uniquely mapped to that transcript. This count was divided by the total number of reads that mapped to all transcripts and multiplied by 1 million to generate the reads-per-million (RPM) count. RPM was used in preference of reads per kilobase per million (RPKM) because CEL-seq only allows 3′ end sequencing. We discarded all genes with a summed expression of less than 10 read counts over the two biological replicates in both cell types. We retained 11,033 genes above this minimum level. Quantification and analysis of the single Lgr5+ cells was performed as described (19). We downsampled each cell to 1,500 transcripts in our analysis. Cells with fewer reads were discarded, which left us with 138 of 192 cells.
Gene Expression Analysis.
We used DAVID (https://david.ncifcrf.gov/tools.jsp) to examine these differentially expressed genes for functional enrichment in GO terms, KEGG pathways, SMART, and SP_PIR_KEYWORDS. The unbiased gene set enrichment analysis was performed with Gene Set Enrichment Analysis (software.broadinstitute.org/gsea/index.jsp). Preranked lists of mean expression changes and input signatures were derived from published microarray and RNA-seq data (8, 24).
Western Blotting.
Organoids were collected in cold medium and washed by cold PBS. Cells were lysed by using RIPA buffer (50 mM Tris⋅HCl, pH 8.0, 150 mM NaCl, 1% Triton X-100, 0.5% sodium deoxychlate, 1 mM EDTA, 0.5 mM DTT, and 10% glycerol) containing Complete protease inhibitors (Roche). After separation by SDS/PAGE, proteins were transferred onto immobilon-P membranes (Millipore). The membrane was incubated with the primary antibodies anti-Reg4 (R&D Systems, 1:1,000) and anti-GAPDH (Abcam, 1:20,000). Positive signals were visualized by incubation with an appropriate secondary antibody conjugated with horseradish peroxidase followed by detection using an ECL prime Western blotting reagent (Amersham). The membrane was stripped and reblotted.
RNA Isolation and qRT-PCR.
Organoids were harvested in Buffer RLT lysis buffer after washing cold PBS, and total RNA was isolated by using the Qiagen RNeasy kit (Qiagen) according to the manufacturer’s protocol and treated with deoxyribonulease I (Qiagen). Mixture of random hexamers and oligo (dT) primers and GoScript transcriptase (Promega) were used for cDNA production. qRT-PCR was performed by using IQ-SYBR green mix (Bio-Rad) according to the manufacturer’s instructions. Results were calculated by using ΔΔCt method. Primers sequences: Reg4_for, 5′-CTGGAATCCCAGGACAAAGAGTG-3′, Reg4_rev, 5′-CTGGAGGCCTCCTCAATGTTTGC-3′, cKit_for, 5′-TCATCGAGTGTGATGGGAAA-3′, cKit_rev, 5′-GGTGACTTGTTTCAGGCACA-3′, Muc2_for, 5′-CAGTTTATTCCTGTGTGCCCAAGG-3′, Muc2_rev, 5′-GGCTTCAGAATAATGTACTGCTGC-3′, Hprt_for, 5′-AAGCTTGCTGGTGAAAAGGA-3′, Hprt_rev, 5′-TTGCGCTCATCTTAGGCTTT-3′.
Acknowledgments
We thank the Hubrecht mouse and imaging facility for taking care of mice and imaging analysis, E. R. Idris for his assistance during his internship course, Dr. Frederic J. de Sauvage (Genentech) for kindly providing us with Lgr5-DTR-eGFP mice, and the laboratory members for valuable discussions. This research was supported by grants to N. Sasaki [Japan Society for the Promotion of Science (JSPS) postdoctoral Fellowships for Research Abroad and Astellas Foundation for Research on Metabolic Disorders] and N. Sasaki, N. Sachs, H.B., M.v.d.B., J.H.v.E., W.R.K., V.S.W.L., and H.C. [National Institutes of Health (NIH)/Massachusetts Institute of Technology (MIT) Subaward 5710002735, Skolteck (SkTech) Skolokovo, and the European Union (EU) FP7 Tornado].
Footnotes
The authors declare no conflict of interest.
Data deposition: The data reported in this paper have been deposited in the Gene Expression Omnibus (GEO) database, www.ncbi.nlm.nih.gov/geo (accession nos. GSE63256 and GSE63365).
This article contains supporting information online at www.pnas.org/lookup/suppl/doi:10.1073/pnas.1607327113/-/DCSupplemental.
References
- 1.Lane SW, Williams DA, Watt FM. Modulating the stem cell niche for tissue regeneration. Nat Biotechnol. 2014;32(8):795–803. doi: 10.1038/nbt.2978. [DOI] [PMC free article] [PubMed] [Google Scholar]
- 2.Schofield R. The relationship between the spleen colony-forming cell and the haemopoietic stem cell. Blood Cells. 1978;4(1-2):7–25. [PubMed] [Google Scholar]
- 3.Morrison SJ, Spradling AC. Stem cells and niches: Mechanisms that promote stem cell maintenance throughout life. Cell. 2008;132(4):598–611. doi: 10.1016/j.cell.2008.01.038. [DOI] [PMC free article] [PubMed] [Google Scholar]
- 4.Morrison SJ, Scadden DT. The bone marrow niche for haematopoietic stem cells. Nature. 2014;505(7483):327–334. doi: 10.1038/nature12984. [DOI] [PMC free article] [PubMed] [Google Scholar]
- 5.Clevers H. The intestinal crypt, a prototype stem cell compartment. Cell. 2013;154(2):274–284. doi: 10.1016/j.cell.2013.07.004. [DOI] [PubMed] [Google Scholar]
- 6.Barker N. Adult intestinal stem cells: Critical drivers of epithelial homeostasis and regeneration. Nat Rev Mol Cell Biol. 2014;15(1):19–33. doi: 10.1038/nrm3721. [DOI] [PubMed] [Google Scholar]
- 7.Barker N, et al. Identification of stem cells in small intestine and colon by marker gene Lgr5. Nature. 2007;449(7165):1003–1007. doi: 10.1038/nature06196. [DOI] [PubMed] [Google Scholar]
- 8.Sato T, et al. Paneth cells constitute the niche for Lgr5 stem cells in intestinal crypts. Nature. 2011;469(7330):415–418. doi: 10.1038/nature09637. [DOI] [PMC free article] [PubMed] [Google Scholar]
- 9.Farin HF, Van Es JH, Clevers H. Redundant sources of Wnt regulate intestinal stem cells and promote formation of Paneth cells. Gastroenterology. 2012;143(6):1518–1529 e1517. doi: 10.1053/j.gastro.2012.08.031. [DOI] [PubMed] [Google Scholar]
- 10.Sato T, Clevers H. Growing self-organizing mini-guts from a single intestinal stem cell: Mechanism and applications. Science. 2013;340(6137):1190–1194. doi: 10.1126/science.1234852. [DOI] [PubMed] [Google Scholar]
- 11.Durand A, et al. Functional intestinal stem cells after Paneth cell ablation induced by the loss of transcription factor Math1 (Atoh1) Proc Natl Acad Sci USA. 2012;109(23):8965–8970. doi: 10.1073/pnas.1201652109. [DOI] [PMC free article] [PubMed] [Google Scholar]
- 12.Kim TH, Escudero S, Shivdasani RA. Intact function of Lgr5 receptor-expressing intestinal stem cells in the absence of Paneth cells. Proc Natl Acad Sci USA. 2012;109(10):3932–3937. doi: 10.1073/pnas.1113890109. [DOI] [PMC free article] [PubMed] [Google Scholar]
- 13.Altmann GG. Morphological observations on mucus-secreting nongoblet cells in the deep crypts of the rat ascending colon. Am J Anat. 1983;167(1):95–117. doi: 10.1002/aja.1001670109. [DOI] [PubMed] [Google Scholar]
- 14.Rothenberg ME, et al. Identification of a cKit(+) colonic crypt base secretory cell that supports Lgr5(+) stem cells in mice. Gastroenterology. 2012;142(5):1195–1205. doi: 10.1053/j.gastro.2012.02.006. [DOI] [PMC free article] [PubMed] [Google Scholar]
- 15.Kämäräinen M, et al. RELP, a novel human REG-like protein with up-regulated expression in inflammatory and metaplastic gastrointestinal mucosa. Am J Pathol. 2003;163(1):11–20. doi: 10.1016/S0002-9440(10)63625-5. [DOI] [PMC free article] [PubMed] [Google Scholar]
- 16.Cash HL, Whitham CV, Behrendt CL, Hooper LV. Symbiotic bacteria direct expression of an intestinal bactericidal lectin. Science. 2006;313(5790):1126–1130. doi: 10.1126/science.1127119. [DOI] [PMC free article] [PubMed] [Google Scholar]
- 17.Hirota S, et al. Gain-of-function mutations of c-kit in human gastrointestinal stromal tumors. Science. 1998;279(5350):577–580. doi: 10.1126/science.279.5350.577. [DOI] [PubMed] [Google Scholar]
- 18.Klein S, et al. Interstitial cells of Cajal integrate excitatory and inhibitory neurotransmission with intestinal slow-wave activity. Nat Commun. 2013;4:1630. doi: 10.1038/ncomms2626. [DOI] [PubMed] [Google Scholar]
- 19.Grün D, et al. Single-cell messenger RNA sequencing reveals rare intestinal cell types. Nature. 2015;525(7568):251–255. doi: 10.1038/nature14966. [DOI] [PubMed] [Google Scholar]
- 20.van Es JH, et al. Notch/gamma-secretase inhibition turns proliferative cells in intestinal crypts and adenomas into goblet cells. Nature. 2005;435(7044):959–963. doi: 10.1038/nature03659. [DOI] [PubMed] [Google Scholar]
- 21.Pellegrinet L, et al. Dll1- and dll4-mediated notch signaling are required for homeostasis of intestinal stem cells. Gastroenterology. 2011;140(4):1230–1240. doi: 10.1053/j.gastro.2011.01.005. [DOI] [PMC free article] [PubMed] [Google Scholar]
- 22.Troyer KL, et al. Growth retardation, duodenal lesions, and aberrant ileum architecture in triple null mice lacking EGF, amphiregulin, and TGF-alpha. Gastroenterology. 2001;121(1):68–78. doi: 10.1053/gast.2001.25478. [DOI] [PubMed] [Google Scholar]
- 23.Gregorieff A, et al. Expression pattern of Wnt signaling components in the adult intestine. Gastroenterology. 2005;129(2):626–638. doi: 10.1016/j.gastro.2005.06.007. [DOI] [PubMed] [Google Scholar]
- 24.Knoop KA, McDonald KG, McCrate S, McDole JR, Newberry RD. Microbial sensing by goblet cells controls immune surveillance of luminal antigens in the colon. Mucosal Immunol. 2015;8(1):198–210. doi: 10.1038/mi.2014.58. [DOI] [PMC free article] [PubMed] [Google Scholar]
- 25.Muñoz J, et al. The Lgr5 intestinal stem cell signature: robust expression of proposed quiescent '+4′ cell markers. EMBO J. 2012;31(14):3079–3091. doi: 10.1038/emboj.2012.166. [DOI] [PMC free article] [PubMed] [Google Scholar]
- 26.Lyubimova A, et al. Single-molecule mRNA detection and counting in mammalian tissue. Nat Protoc. 2013;8(9):1743–1758. doi: 10.1038/nprot.2013.109. [DOI] [PubMed] [Google Scholar]
- 27.Wang F, et al. Isolation and characterization of intestinal stem cells based on surface marker combinations and colony-formation assay. Gastroenterology. 2013;145(2):383–395. doi: 10.1053/j.gastro.2013.04.050. [DOI] [PMC free article] [PubMed] [Google Scholar]
- 28.Ritsma L, et al. Intestinal crypt homeostasis revealed at single-stem-cell level by in vivo live imaging. Nature. 2014;507(7492):362–365. doi: 10.1038/nature12972. [DOI] [PMC free article] [PubMed] [Google Scholar]
- 29.Tian H, et al. A reserve stem cell population in small intestine renders Lgr5-positive cells dispensable. Nature. 2011;478(7368):255–259. doi: 10.1038/nature10408. [DOI] [PMC free article] [PubMed] [Google Scholar]
- 30.Sato T, et al. Long-term expansion of epithelial organoids from human colon, adenoma, adenocarcinoma, and Barrett’s epithelium. Gastroenterology. 2011;141(5):1762–1772. doi: 10.1053/j.gastro.2011.07.050. [DOI] [PubMed] [Google Scholar]
- 31.Yin X, et al. Niche-independent high-purity cultures of Lgr5+ intestinal stem cells and their progeny. Nat Methods. 2014;11(1):106–112. doi: 10.1038/nmeth.2737. [DOI] [PMC free article] [PubMed] [Google Scholar]
- 32.van Es JH, et al. Wnt signalling induces maturation of Paneth cells in intestinal crypts. Nat Cell Biol. 2005;7(4):381–386. doi: 10.1038/ncb1240. [DOI] [PubMed] [Google Scholar]
- 33.Milano J, et al. Modulation of notch processing by gamma-secretase inhibitors causes intestinal goblet cell metaplasia and induction of genes known to specify gut secretory lineage differentiation. Toxicol Sci. 2004;82(1):341–358. doi: 10.1093/toxsci/kfh254. [DOI] [PubMed] [Google Scholar]
- 34.Wong GT, et al. Chronic treatment with the gamma-secretase inhibitor LY-411,575 inhibits beta-amyloid peptide production and alters lymphopoiesis and intestinal cell differentiation. J Biol Chem. 2004;279(13):12876–12882. doi: 10.1074/jbc.M311652200. [DOI] [PubMed] [Google Scholar]
- 35.McLin VA, Henning SJ, Jamrich M. The role of the visceral mesoderm in the development of the gastrointestinal tract. Gastroenterology. 2009;136(7):2074–2091. doi: 10.1053/j.gastro.2009.03.001. [DOI] [PubMed] [Google Scholar]
- 36.Powell DW, Pinchuk IV, Saada JI, Chen X, Mifflin RC. Mesenchymal cells of the intestinal lamina propria. Annu Rev Physiol. 2011;73:213–237. doi: 10.1146/annurev.physiol.70.113006.100646. [DOI] [PMC free article] [PubMed] [Google Scholar]
- 37.Ueo T, et al. The role of Hes genes in intestinal development, homeostasis and tumor formation. Development. 2012;139(6):1071–1082. doi: 10.1242/dev.069070. [DOI] [PubMed] [Google Scholar]
- 38.Guilmeau S, et al. Intestinal deletion of Pofut1 in the mouse inactivates notch signaling and causes enterocolitis. Gastroenterology. 2008;135(3):849–860. doi: 10.1053/j.gastro.2008.05.050. [DOI] [PMC free article] [PubMed] [Google Scholar]
- 39.van Es JH, et al. Dll1+ secretory progenitor cells revert to stem cells upon crypt damage. Nat Cell Biol. 2012;14(10):1099–1104. doi: 10.1038/ncb2581. [DOI] [PMC free article] [PubMed] [Google Scholar]
- 40.Tetteh PW, et al. Replacement of lost Lgr5-positive stem cells through plasticity of their enterocyte-lineage daughters. Cell Stem Cell. 2016;18(2):203–213. doi: 10.1016/j.stem.2016.01.001. [DOI] [PubMed] [Google Scholar]
- 41.Schepers AG, et al. Lineage tracing reveals Lgr5+ stem cell activity in mouse intestinal adenomas. Science. 2012;337(6095):730–735. doi: 10.1126/science.1224676. [DOI] [PubMed] [Google Scholar]
- 42.Oue N, et al. Expression and localization of Reg IV in human neoplastic and non-neoplastic tissues: Reg IV expression is associated with intestinal and neuroendocrine differentiation in gastric adenocarcinoma. J Pathol. 2005;207(2):185–198. doi: 10.1002/path.1827. [DOI] [PubMed] [Google Scholar]
- 43.Oue N, et al. Serum concentration of Reg IV in patients with colorectal cancer: Overexpression and high serum levels of Reg IV are associated with liver metastasis. Oncology. 2007;72(5-6):371–380. doi: 10.1159/000113147. [DOI] [PubMed] [Google Scholar]
- 44.Rafa L, et al. REG4 acts as a mitogenic, motility and pro-invasive factor for colon cancer cells. Int J Oncol. 2010;36(3):689–698. doi: 10.3892/ijo_00000544. [DOI] [PubMed] [Google Scholar]
- 45.Kaprio T, et al. REG4 independently predicts better prognosis in non-mucinous colorectal cancer. PLoS One. 2014;9(10):e109600. doi: 10.1371/journal.pone.0109600. [DOI] [PMC free article] [PubMed] [Google Scholar]
- 46.van Es JH, et al. A critical role for the Wnt effector Tcf4 in adult intestinal homeostatic self-renewal. Mol Cell Biol. 2012;32(10):1918–1927. doi: 10.1128/MCB.06288-11. [DOI] [PMC free article] [PubMed] [Google Scholar]
- 47.Ritsma L, et al. Surgical implantation of an abdominal imaging window for intravital microscopy. Nat Protoc. 2013;8(3):583–594. doi: 10.1038/nprot.2013.026. [DOI] [PubMed] [Google Scholar]
- 48.Sato T, et al. Single Lgr5 stem cells build crypt-villus structures in vitro without a mesenchymal niche. Nature. 2009;459(7244):262–265. doi: 10.1038/nature07935. [DOI] [PubMed] [Google Scholar]
- 49.Grün D, Kester L, van Oudenaarden A. Validation of noise models for single-cell transcriptomics. Nat Methods. 2014;11(6):637–640. doi: 10.1038/nmeth.2930. [DOI] [PubMed] [Google Scholar]


