

Significance
Humans need a stable, balanced gut microbiome (GM) to be healthy. The GM is influenced by bacteriophages that infect bacterial hosts. In this work, bacteriophages associated with the GM of healthy individuals were analyzed, and a healthy gut phageome (HGP) was discovered. The HGP is composed of core and common bacteriophages common to healthy adult individuals and is likely globally distributed. We posit that the HGP plays a critical role in maintaining the proper function of a healthy GM. As expected, we found that the HGP is significantly decreased in individuals with gastrointestinal disease (ulcerative colitis and Crohn’s disease). Together, these results reveal a large community of human gut bacteriophages that likely contribute to maintaining human health.
Keywords: gut microbiome bacteriophage, human gut viral metagenome, shared microbiome viruses, gut microbiome viruses
Abstract
The role of bacteriophages in influencing the structure and function of the healthy human gut microbiome is unknown. With few exceptions, previous studies have found a high level of heterogeneity in bacteriophages from healthy individuals. To better estimate and identify the shared phageome of humans, we analyzed a deep DNA sequence dataset of active bacteriophages and available metagenomic datasets of the gut bacteriophage community from healthy individuals. We found 23 shared bacteriophages in more than one-half of 64 healthy individuals from around the world. These shared bacteriophages were found in a significantly smaller percentage of individuals with gastrointestinal/irritable bowel disease. A network analysis identified 44 bacteriophage groups of which 9 (20%) were shared in more than one-half of all 64 individuals. These results provide strong evidence of a healthy gut phageome (HGP) in humans. The bacteriophage community in the human gut is a mixture of three classes: a set of core bacteriophages shared among more than one-half of all people, a common set of bacteriophages found in 20–50% of individuals, and a set of bacteriophages that are either rarely shared or unique to a person. We propose that the core and common bacteriophage communities are globally distributed and comprise the HGP, which plays an important role in maintaining gut microbiome structure/function and thereby contributes significantly to human health.
The human body supports a diverse community of microorganisms, the majority of which are thought to be bacteria residing in the lower gastrointestinal tract (1–4). A “healthy gut microbiome (GM)” concept, where similar, but not the same microbes provide common functions that promote human health is supported by metagenomic sequencing of microbes and comparative analyses of gene content (3). The healthy-GM structure is conserved among individuals at higher taxonomic levels (especially phylum) (2, 4), and a core GM at the species level shared by more than 90% of the individuals. Shared bacterial species have been proposed to form a “core bacterial community” that provides beneficial functions (3). This concept, however, is based almost entirely on bacterial sequence data and, with few exceptions (5–8), has not considered the role of bacteriophages.
Gut bacteria host a diverse bacteriophage community (phageome) that potentially helps determine microbial colonization and contributes to shaping GM structure and function. The active phageome of a healthy human (i.e., actively replicating as opposed to nonreplicating, integrated prophage) has been estimated to comprise 35–2,800 viruses (6, 8), the vast majority of which have no significant sequence homology to known bacteriophages. Although the phageome was found to be relatively stable within a person (6–8), comparative phageome analysis at a global scale has received little attention.
To address large-scale phageome overlap, we assembled metagenomic reads from a novel, deep bacteriophage dataset from stool samples of two healthy individuals and analyzed currently available data from 62 healthy people around the world. This analysis identified 23 bacteriophages that were present in more than one-half of all individuals. We then applied a sequence-based viral community network tool (9) to identify closely related viruses at higher taxonomic levels. This analysis identified 44 bacteriophage groups, of which 9 (20%) were shared across more than one-half of individuals around the globe. We propose shared bacteriophages as a healthy gut phageome (HGP) and that, together with their core bacterial hosts, play an essential role in maintaining GM function in the healthy human gut.
Results
Previous studies that identified a core GM in healthy people showed that increasing the depth of sequencing was critical to detect shared bacterial species (3). Thus, we conducted an ultradeep baseline study of the active human gut phageome of two healthy, unrelated adults at two sampling intervals (15 or 3 mo). We focused our efforts on DNA bacteriophages because of their relevance to host bacteria and because most (>95%) RNA viruses in the human gut are likely plant viruses (10). Total DNA was extracted from stool samples as well as purification of virus-like particles (VLPs). TEM analysis of VLPs showed a high concentration of head-tailed bacteriophages consistent with their taxonomic classification in the Caudovirales order (Podoviridae, Siphoviridae, and Myoviridae). Microviridae bacteriophages were also identified, and no eukaryotic virus sequences were found. 16S rDNA-based metagenomics (11) of total stool DNA confirmed that the bacterial community of both individuals was typical of healthy human adults, dominated by Bacteriodetes and Firmicutes. Also, as expected, the GM structure was stable between time points. Unlike previous studies, DNA extracted from VLPs was sequenced without prior amplification to avoid potential amplification bias. Sequencing yielded a total of 8.1 Gb of data, representing one of the most in-depth human gut phageome studies to date, even after deduplication of reads (Table S1). Rank abundance analysis indicated that sufficient sequencing depth was achieved per sample to detect dominant bacteriophages (Figs. S1 and S2).
Table S1.
Sequencing depth compared between datasets used in this study
| Dataset | No. of reads | No. of unique reads | % Unique reads | Length (bp)* | No. of total bp | No. of unique bp | n | bp per individual | Unique bp per individual | Unique sequencing depth comparison |
| Reyes | 1,318,248 | 1,229,707 | 93 | 251† | 331,454,378 | 312,560,713 | 12 | 27,621,198 | 26,046,726 | 82.23 |
| Minot | 907,909 | 904,562 | 100 | 544† | 493,947,707 | 492,539,860 | 6 | 82,324,618 | 82,089,977 | 26.09 |
| Norman | 153,591,468 | 80,230,006 | 52 | 250 | 38,397,867,000 | 19,057,800,725 | 62 | 619,320,435 | 307,383,883 | 6.97 |
| Manrique 1.1 | 5,813,020 | 3,588,782 | 62 | 300 | 1,743,906,000 | 974,237,582 | 1 | 4,031,007,600 | 2,278,580,409 | 0.94 |
| Manrique 1.2 | 7,623,672 | 4,945,215 | 65 | 300 | 2,287,101,600 | 1,304,342,827 | 1 | |||
| Manrique 2.1 | 6,631,762 | 3,621,775 | 55 | 300 | 1,989,528,600 | 957,459,794 | 1 | 4,126,410,600 | 2,005,029,078 | 1.07 |
| Manrique 2.2 | 7,122,940 | 3,895,252 | 55 | 300 | 2,136,882,000 | 1,047,569,284 | 1 |
n = number of individuals in study. Unique sequencing depth was calculated by dividing total of unique base pairs per individual in dataset by total unique base pairs per individual in Manrique dataset.
Length of untrimmed deduplicated reads.
Average read length. Original reads length was heterogeneous.
Fig. S1.

Bacteriophage community abundance distribution (A and B, individual 1; C and D, individual 2). (Left) Relative abundance of the most abundant bacteriophages (10–0.1% range) in the gut of study individuals. (Right) Percentage of normalized reads that are recruited to percentage of contigs shown in different abundance ranges of the community. On average, 7% of the bacteriophage contigs in each community account for 91% of the normalized reads, showing that a minority of the bacteriophage species dominates the bacteriophage community.
Fig. S2.

Percentage of bacteriophages present in more than 20% of healthy individuals. A total of 62 healthy individuals from three cohorts around the world were screened for all of the bacteriophages (complete and partial) assembled in this study (4,301). In total, 160 bacteriophages were present in more than 20% of the individuals, and the percentages of individuals that harbor them in each cohort are represented as a heat map. Each line of the heat map represents a virus.
Four individual active phageome datasets were assembled together resulting in 4,301 contigs (ALL). A total of 70 complete circular and 2 nearly-full length linear phage genomes, based on end sequence comparison were identified (Table S2; referred to as “complete” genomes). The remaining contigs were potentially complete or partial phage genomes. On average, 73% (range, 66–79%) of sequencing reads from each sample assembled into the ALL contigs, demonstrating a relatively even contribution from both individuals. Consistent with previous studies (6, 8), the diversity of the phage community was low (Shannon diversity index = 4.25; SD = 0.95), and the phage distribution was similar in each person, being dominated by a few phages, with no more than 115 genomes accounting for 75% of the normalized reads (Fig. S1). A total of 1,703 of the 4,301 contigs (40%), and 63 of the 72 (88%) complete genomes contained at least one ORF with homology to a phage protein demonstrating their viral origins. However, only 314 (7%) of ALL contigs contained a family taxon-specific phage orthologous group (mostly to Caudovirales). This indicates that the majority (60%) of active bacteriophages in the GM are novel, with only a limited subset that can be taxonomically classified. Taken together, this approach was successful in assembling complete phage genomes and showed the expected community structure.
Table S2.
Information about complete genomes
| Phage group in network | Phage | Genome length | Healthy individuals with phage (Norman dataset), n = 62 | Percentage of healthy individuals with phage | Taxonomy | Type of genome |
| Not in network | Phage 375 | 5,820 | 59 | 95 | Not classified | Circular |
| 13 | Phage 31 | 96,711 | 57 | 92 | Not classified | Circular |
| Not in network | Phage 468 | 6,401 | 53 | 85 | Microviridae | Circular |
| 37 | Phage 48 | 56,540 | 46 | 74 | Not classified | Circular |
| 12 | Phage 345 | 5,835 | 45 | 73 | Microviridae | Circular |
| 41 | Phage 25 | 84,871 | 39 | 63 | Caudovirales | Circular |
| 7 | Phage 58 | 61,291 | 38 | 61 | Caudovirales | Circular |
| 12 | Phage 536 | 5,769 | 38 | 61 | Not classified | Linear |
| 37 | Phage 14 | 96,114 | 37 | 60 | Caudovirales | Circular |
| 41 | Phage 81 | 85,111 | 32 | 52 | Caudovirales | Circular |
| 13 | Phage 26 | 96,024 | 30 | 48 | Not classified | Circular |
| 23 | Phage 23 | 94,753 | 28 | 45 | dsDNA viruses | Circular |
| 23 | Phage 18 | 96,620 | 26 | 42 | dsDNA viruses | Circular |
| 15 | Phage 11 | 156,560 | 26 | 42 | Not classified | Circular |
| Not in network | Phage 148 | 36,364 | 25 | 40 | dsDNA viruses | Circular |
| 7 | Phage 93 | 45,306 | 24 | 39 | Caudovirales | Circular |
| Not in network | Phage 20 | 102,927 | 22 | 35 | Not classified | Circular |
| 29 | Phage 51 | 43,881 | 21 | 34 | Caudovirales | Circular |
| 37 | Phage 115 | 39,855 | 20 | 32 | Caudovirales | Circular |
| 16 | Phage 68 | 57,271 | 20 | 32 | Caudovirales | Circular |
| 11 | Phage 29 | 96,982 | 20 | 32 | Not classified | Circular |
| 6 | Phage 85 | 45,769 | 20 | 32 | Caudovirales | Circular |
| 11 | Phage 33 | 96,365 | 19 | 31 | Not classified | Circular |
| 37 | Phage 97 | 43,545 | 18 | 29 | dsDNA viruses | Circular |
| 15 | Phage 13 | 152,970 | 18 | 29 | Not classified | Circular |
| 15 | Phage 12 | 155,773 | 18 | 29 | Not classified | Circular |
| 6 | Phage 67 | 56,277 | 17 | 27 | Caudovirales | Circular |
| 29 | Phage 82 | 45,634 | 16 | 26 | Caudovirales | Circular |
| Not in network | Phage 101 | 43,360 | 16 | 26 | Caudovirales | Circular |
| 6 | Phage 15 | 140,123 | 15 | 24 | Caudovirales | Circular |
| Not in network | Phage 10 | 177,409 | 15 | 24 | Not classified | Circular |
| Not in network | Phage 449 | 5,755 | 13 | 21 | Not classified | Circular |
| Not in network | Phage 516 | 5,504 | 13 | 21 | Not classified | Circular |
| Not in network | Phage 24 | 99,239 | 12 | 19 | Not classified | Circular |
| 24 | Phage 76 | 51,439 | 11 | 18 | Not classified | Circular |
| Not in network | Phage 43 | 77,090 | 10 | 16 | Caudovirales | Circular |
| 24 | Phage 77 | 51,074 | 9 | 15 | Not classified | Circular |
| 13 | Phage 36 | 87,718 | 8 | 13 | Not classified | Circular |
| 6 | Phage 141 | 37,732 | 7 | 11 | Caudovirales | Circular |
| 13 | Phage 35 | 90,345 | 7 | 11 | Not classified | Circular |
| 7 | Phage 61 | 41,548 | 6 | 10 | dsDNA viruses | Circular |
| 7 | Phage 106 | 41,925 | 6 | 10 | dsDNA viruses | Circular |
| Not in network | Phage 405 | 7,603 | 5 | 8 | Not classified | Circular |
| Not in network | Phage 98 | 43,537 | 5 | 8 | Caudovirales | Linear |
| 16 | Phage 132 | 35,573 | 4 | 6 | Caudovirales | Circular |
| 29 | Phage 198 | 23,531 | 4 | 6 | Caudovirales | Circular |
| 29 | Phage 136 | 37,523 | 4 | 6 | Caudovirales | Circular |
| 8 | Phage 94 | 44,194 | 4 | 6 | dsDNA viruses | Circular |
| Not in network | Phage 108 | 40,910 | 4 | 6 | Caudovirales | Circular |
| 7 | Phage 110 | 41,293 | 3 | 5 | dsDNA viruses | Circular |
| Not in network | Phage 73 | 44,832 | 3 | 5 | Caudovirales | Circular |
| Not in network | Phage 158 | 34,522 | 3 | 5 | Caudovirales | Circular |
| Not in network | Phage 70 | 50,286 | 3 | 5 | Caudovirales | Circular |
| 7 | Phage 46 | 77,094 | 2 | 3 | Caudovirales | Circular |
| Not in network | Phage 127 | 38,570 | 2 | 3 | dsDNA viruses | Circular |
| Not in network | Phage 72 | 54,603 | 2 | 3 | Myoviridae | Circular |
| Not in network | Phage 498 | 6,047 | 2 | 3 | Not classified | Circular |
| Not in network | Phage 2126 | 1,077 | 2 | 3 | Not classified | Circular |
| 6 | Phage 142 | 37,127 | 1 | 2 | Caudovirales | Circular |
| 35 | Phage 38 | 84,151 | 1 | 2 | dsDNA viruses | Circular |
| 41 | Phage 47 | 75,845 | 1 | 2 | Caudovirales | Circular |
| Not in network | Phage 71 | 54,702 | 1 | 2 | dsDNA viruses | Circular |
| Not in network | Phage 171 | 31,919 | 1 | 2 | Caudovirales | Circular |
| Not in network | Phage 145 | 37,040 | 1 | 2 | Caudovirales | Circular |
| 4 | Phage 622 | 3,811 | 0 | 0 | Not classified | Circular |
| 6 | Phage 107 | 40,223 | 0 | 0 | dsDNA viruses | Circular |
| 10 | Phage 66 | 44,776 | 0 | 0 | Podoviridae | Circular |
| 20 | Phage 32 | 96,526 | 0 | 0 | Not classified | Circular |
| Not in network | Phage 55 | 61,931 | 0 | 0 | dsDNA viruses | Circular |
| Not in network | Phage 545 | 5,360 | 0 | 0 | Microviridae | Circular |
| Not in network | Phage 2955 | 1,002 | 0 | 0 | Not classified | Circular |
| Not in network | Phage 1675 | 1,732 | 0 | 0 | Not classified | Circular |
To maximize the identification of shared phages between our two test subjects, reads from the four samples were mapped to the ALL contigs. Recruitment of a single read was used as evidence of phage presence in a particular sample, allowing the identification of both high- and low-abundance phages that were not originally assembled due to low coverage. As has been shown previously (6, 8), phageome structure was more similar within individuals over time [Bray–Curtis (BC) distance = 0.47; SD = 0.24] than between individuals (BC distance = 0.96; SD = 0.01). However, 17% of ALL contigs were present in both individuals in at least one time point, and 7% were present in both individuals at all time points. Of the 72 complete genomes, 56 (78%) were found in both individuals. These results reveal that there is a smaller but significant fraction of phage sequences shared between these two unrelated test subjects.
Given the high level of interindividual phageome variability previously reported, the identification of significant phageome overlap between our two test subjects was surprising, but consistent with the existence of a core microbial community identified by others (3, 12). This result led us to investigate the presence of ALL contigs in other human gut phageome datasets. The dataset by Norman et al. (7) was selected for comparison based on the large number of healthy (n = 62) and diseased subjects (n = 102), their geographic distribution, and the sequencing depth achieved (Table S1). The dataset was deduplicated, and 11% of the total reads were mapped to ALL contigs (Table S3). In total, 1,787 of the 4,301 ALL contigs (42%) were present in at least one person from the Norman dataset; 1,679 (39%) were present in 2–19% of people (termed “low overlap” bacteriophages), 132 (3%) were detected in 20–50% (termed “common” bacteriophages), and 23 (0.5%) were present in >50% (termed “core” bacteriophages) (Fig. S2). Of the 72 complete genomes from our two subjects, 10 (14%) were core and 23 (32%) were common bacteriophages (Fig. 1). One of the core bacteriophages is the recently identified “crAssphage” (13). Our independent identification of crAssphage supports the robustness of our approach and highlights the discovery of a significantly expanded set of core GM bacteriophages. Given their prevalence, we refer to both core and common bacteriophages as the “healthy gut phageome,” or HGP. It is important to note that the 155 bacteriophages comprising the HGP represented only 4% of the estimated total bacteriophage community, and we presume that a larger set of HGP bacteriophages will be discovered with increasing sequencing depth of additional individuals. Also, the observation that some HGP members were detected by a single sequencing read suggests that they are either rare members of the GM or that the sequencing depth of the Norman dataset was too low to accurately estimate their true presence (Fig. S3). Regardless, these results support the presence of a broadly distributed HGP in healthy human adults.
Table S3.
Number of reads from Reyes, Minot, and Norman datasets recruited to ALL contigs dataset
| Cohort | Individual | Total reads | Total reads used | % Reads used | Total unique reads* | % Unique reads* | Unique reads used | % Unique reads used |
| Minot | Healthy† | 907,909 | 112,535 | 11 | 904,562 | 100 | NA | NA |
| Reyes | Healthy† | 1,318,248 | 348,747 | 28 | 1,229,707 | 93 | NA | NA |
| Boston | Healthy 1 | 1,855,868 | 151,886 | 8.18 | 751,022 | 40 | 30,162 | 4 |
| Boston | Healthy 2 | 3,077,606 | 919,913 | 29.89 | 1,459,460 | 47 | 322,958 | 22 |
| Boston | Healthy 3 | 2,363,534 | 431,989 | 18.28 | 1,415,938 | 60 | 235,284 | 17 |
| Boston | Healthy 4 | 2,545,426 | 174,344 | 6.85 | 1,138,171 | 45 | 75,142 | 7 |
| Boston | Healthy 5 | 3,594,714 | 1,987,264 | 55.28 | 1,829,231 | 51 | 617,223 | 34 |
| Boston | Healthy 6 | 3,032,490 | 869,133 | 28.66 | 1,184,156 | 39 | 144,158 | 12 |
| Boston | Healthy 7 | 2,754,790 | 830,673 | 30.15 | 1,943,469 | 71 | 395,908 | 20 |
| Boston | Healthy 8 | 2,736,014 | 6,236 | 0.23 | 1,208,815 | 44 | 2,166 | 0 |
| Boston | Healthy 9 | 2,677,362 | 1,165,711 | 43.54 | 2,031,749 | 76 | 575,048 | 28 |
| Boston | Healthy 10 | 1,217,356 | 37,264 | 3.06 | 704,349 | 58 | 28,478 | 4 |
| Boston | Healthy 11 | 3,963,300 | 165,613 | 4.18 | 2,243,045 | 57 | 68,805 | 3 |
| Boston | Healthy 12 | 3,410,232 | 3,095 | 0.09 | 1,516,125 | 44 | 1,582 | 0 |
| Boston | Healthy 13 | 3,212,322 | 1,384,980 | 43.11 | 1,764,791 | 55 | 326,411 | 18 |
| Boston | Healthy 14 | 2,035,696 | 1,366,499 | 67.12 | 1,197,715 | 59 | 530,039 | 44 |
| Boston | Healthy 15 | 1,435,100 | 357,568 | 24.91 | 891,091 | 62 | 192,196 | 22 |
| Boston | Healthy 16 | 5,688,510 | 837,832 | 14.73 | 3,207,930 | 56 | 240,724 | 8 |
| Boston | Healthy 17 | 4,192,464 | 647,346 | 15.44 | 2,366,494 | 56 | 67,784 | 3 |
| Boston | Healthy 18 | 2,612,060 | 56,094 | 2.15 | 1,430,980 | 55 | 17,392 | 1 |
| Boston | Healthy 19 | 2,774,234 | 276,275 | 9.96 | 1,282,998 | 46 | 206,015 | 16 |
| Boston | Healthy 20 | 3,741,796 | 860,840 | 23.00 | 1,823,341 | 49 | 184,955 | 10 |
| Cambridge | Healthy 21 | 813,036 | 40,290 | 4.95 | 362,723 | 45 | 30,453 | 8 |
| Cambridge | Healthy 22 | 2,191,674 | 53,945 | 2.46 | 798,150 | 36 | 12,521 | 2 |
| Cambridge | Healthy 23 | 3,987,976 | 1,259,661 | 31.59 | 1,487,481 | 37 | 212,936 | 14 |
| Cambridge | Healthy 24 | 744,306 | 96,954 | 13.02 | 520,367 | 70 | 53,508 | 10 |
| Cambridge | Healthy 25 | 1,412,874 | 9,063 | 0.64 | 429,886 | 30 | 6,229 | 1 |
| Cambridge | Healthy 26 | 2,148,478 | 20,278 | 0.94 | 1,200,855 | 56 | 14,646 | 1 |
| Cambridge | Healthy 27 | 2,167,272 | 695,799 | 32.10 | 1,261,182 | 58 | 364,978 | 29 |
| Cambridge | Healthy 28 | 1,982,540 | 145,999 | 7.36 | 734,000 | 37 | 15,439 | 2 |
| Cambridge | Healthy 29 | 2,456,352 | 1,699,167 | 69.17 | 1,325,059 | 54 | 562,147 | 42 |
| Cambridge | Healthy 30 | 2,205,292 | 343,671 | 15.58 | 1,183,795 | 54 | 144,100 | 12 |
| Cambridge | Healthy 31 | 2,242,066 | 6,184 | 0.27 | 979,536 | 44 | 4,666 | 0 |
| Cambridge | Healthy 32 | 1,666,460 | 618,605 | 37.12 | 1,013,793 | 61 | 266,076 | 26 |
| Cambridge | Healthy 33 | 873,858 | 2,584 | 0.29 | 391,024 | 45 | 1,836 | 0 |
| Cambridge | Healthy 34 | 889,734 | 34,762 | 3.90 | 399,021 | 45 | 14,981 | 4 |
| Cambridge | Healthy 35 | 2,477,270 | 82,617 | 3.33 | 864,305 | 35 | 49,443 | 6 |
| Cambridge | Healthy 36 | 2,755,938 | 1,066,225 | 38.69 | 1,458,486 | 53 | 251,497 | 17 |
| Cambridge | Healthy 37 | 2,747,478 | 160,672 | 5.85 | 1,227,408 | 45 | 64,346 | 5 |
| Cambridge | Healthy 38 | 2,964,822 | 600,366 | 20.25 | 1,263,739 | 43 | 143,055 | 11 |
| Cambridge | Healthy 39 | 3,169,706 | 511,639 | 16.14 | 1,242,348 | 39 | 128,583 | 10 |
| Cambridge | Healthy 40 | 3,101,720 | 225,445 | 7.27 | 953,805 | 31 | 47,335 | 5 |
| Cambridge | Healthy 41 | 3,488,468 | 170,214 | 4.88 | 2,002,130 | 57 | 129,009 | 6 |
| Chicago | Healthy 42 | 2,403,326 | 14,722 | 0.61 | 1,391,663 | 58 | 5,223 | 0 |
| Chicago | Healthy 43 | 2,410,296 | 509,131 | 21.12 | 1,345,791 | 56 | 95,852 | 7 |
| Chicago | Healthy 44 | 2,368,680 | 580,817 | 24.52 | 1,321,717 | 56 | 133,899 | 10 |
| Chicago | Healthy 45 | 2,213,436 | 530,977 | 23.99 | 1,395,454 | 63 | 289,514 | 21 |
| Chicago | Healthy 46 | 3,332,532 | 72,812 | 2.18 | 1,983,779 | 60 | 22,311 | 1 |
| Chicago | Healthy 47 | 1,886,752 | 1,195,555 | 63.36 | 601,889 | 32 | 92,555 | 15 |
| Chicago | Healthy 48 | 2,414,120 | 307,535 | 12.74 | 1,347,958 | 56 | 193,963 | 14 |
| Chicago | Healthy 49 | 1,892,214 | 4,268 | 0.22 | 511,371 | 27 | 3,383 | 1 |
| Chicago | Healthy 50 | 2,731,028 | 180,879 | 6.62 | 1,702,024 | 62 | 58,545 | 3 |
| Chicago | Healthy 51 | 1,968,640 | 185,476 | 9.42 | 1,191,892 | 61 | 37,410 | 3 |
| Chicago | Healthy 52 | 1,981,600 | 19,512 | 0.98 | 1,374,198 | 69 | 8,691 | 1 |
| Chicago | Healthy 53 | 2,704,256 | 101,438 | 3.75 | 2,047,476 | 76 | 53,442 | 3 |
| Chicago | Healthy 54 | 2,699,190 | 205,790 | 7.62 | 1,470,581 | 54 | 38,420 | 3 |
| Chicago | Healthy 55 | 2,733,304 | 72,812 | 2.66 | 1,624,789 | 59 | 56,216 | 3 |
| Chicago | Healthy 56 | 2,574,044 | 581,983 | 22.61 | 1,301,623 | 51 | 123,267 | 9 |
| Chicago | Healthy 57 | 2,658,816 | 664,954 | 25.01 | 1,496,994 | 56 | 295,962 | 20 |
| Chicago | Healthy 58 | 2,182,842 | 112,919 | 5.17 | 1,481,366 | 68 | 90,999 | 6 |
| Chicago | Healthy 59 | 2,426,646 | 444,779 | 18.33 | 1,598,184 | 66 | 332,880 | 21 |
| Chicago | Healthy 60 | 1,590,130 | 468,032 | 29.43 | 742,336 | 47 | 79,208 | 11 |
| Chicago | Healthy 61 | 1,570,368 | 477,413 | 30.40 | 1,108,109 | 71 | 268,227 | 24 |
| Chicago | Healthy 62 | 1,441,054 | 2,383 | 0.16 | 700,849 | 49 | 1,598 | 0 |
| Boston | Disease 1 | 2,388,256 | 24,222 | 1.01 | NA | NA | 22,654 | NA |
| Boston | Disease 2 | 2,363,664 | 1,398,078 | 59.15 | NA | NA | 574,102 | NA |
| Boston | Disease 3 | 2,575,262 | 1,589,148 | 61.71 | NA | NA | 730,253 | NA |
| Boston | Disease 4 | 2,134,480 | 94,343 | 4.42 | NA | NA | 62,443 | NA |
| Boston | Disease 5 | 2,453,782 | 54,306 | 2.21 | NA | NA | 43,918 | NA |
| Boston | Disease 6 | 1,416,910 | 58,142 | 4.10 | NA | NA | 51,045 | NA |
| Boston | Disease 7 | 2,183,796 | 100,330 | 4.59 | NA | NA | 44,764 | NA |
| Boston | Disease 8 | 2,992,536 | 803,376 | 26.85 | NA | NA | 315,793 | NA |
| Boston | Disease 9 | 3,079,596 | 109,046 | 3.54 | NA | NA | 86,546 | NA |
| Boston | Disease 10 | 1,209,042 | 153,107 | 12.66 | NA | NA | 49,222 | NA |
| Boston | Disease 11 | 2,651,402 | 929,362 | 35.05 | NA | NA | 541,354 | NA |
| Boston | Disease 12 | 2,112,430 | 14,213 | 0.67 | NA | NA | 10,424 | NA |
| Boston | Disease 13 | 2,506,052 | 3,550 | 0.14 | NA | NA | 2,768 | NA |
| Boston | Disease 14 | 835,412 | 143,716 | 17.20 | NA | NA | 91,479 | NA |
| Boston | Disease 15 | 614,422 | 104,165 | 16.95 | NA | NA | 47,673 | NA |
| Boston | Disease 16 | 2,773,122 | 107,708 | 3.88 | NA | NA | 55,308 | NA |
| Boston | Disease 17 | 2,349,140 | 416,753 | 17.74 | NA | NA | 289,689 | NA |
| Boston | Disease 18 | 4,892,418 | 118,074 | 2.41 | NA | NA | 47,234 | NA |
| Boston | Disease 19 | 3,930,552 | 6,221 | 0.16 | NA | NA | 5,446 | NA |
| Boston | Disease 20 | 3,374,786 | 194,894 | 5.78 | NA | NA | 106,648 | NA |
| Boston | Disease 21 | 1,162,722 | 4,247 | 0.37 | NA | NA | 4,154 | NA |
| Boston | Disease 22 | 2,123,106 | 1,384,249 | 65.20 | NA | NA | 595,006 | NA |
| Boston | Disease 23 | 2,969,610 | 1,806,143 | 60.82 | NA | NA | 971,425 | NA |
| Boston | Disease 24 | 1,213,940 | 1,195 | 0.10 | NA | NA | 1,099 | NA |
| Boston | Disease 25 | 2,182,894 | 229,344 | 10.51 | NA | NA | 76,412 | NA |
| Cambridge | Disease 26 | 785,338 | 39,670 | 5.05 | NA | NA | 32,284 | NA |
| Cambridge | Disease 27 | 1,840,304 | 304,711 | 16.56 | NA | NA | 226,167 | NA |
| Cambridge | Disease 28 | 5,050,694 | 1,315,276 | 26.04 | NA | NA | 748,814 | NA |
| Cambridge | Disease 29 | 1,014,488 | 85,600 | 8.44 | NA | NA | 41,023 | NA |
| Cambridge | Disease 30 | 1,205,032 | 23,593 | 1.96 | NA | NA | 22,036 | NA |
| Cambridge | Disease 31 | 2,494,434 | 279,913 | 11.22 | NA | NA | 134,044 | NA |
| Cambridge | Disease 32 | 807,868 | 9,754 | 1.21 | NA | NA | 8,814 | NA |
| Cambridge | Disease 33 | 1,978,690 | 930,080 | 47.00 | NA | NA | 500,668 | NA |
| Cambridge | Disease 34 | 2,577,566 | 46,319 | 1.80 | NA | NA | 42,910 | NA |
| Cambridge | Disease 35 | 2,102,706 | 106,816 | 5.08 | NA | NA | 94,586 | NA |
| Cambridge | Disease 36 | 2,815,246 | 438 | 0.02 | NA | NA | 434 | NA |
| Cambridge | Disease 37 | 2,199,754 | 277,888 | 12.63 | NA | NA | 203,917 | NA |
| Cambridge | Disease 38 | 2,110,646 | 289 | 0.01 | NA | NA | 289 | NA |
| Cambridge | Disease 39 | 1,016,694 | 24,639 | 2.42 | NA | NA | 21,817 | NA |
| Cambridge | Disease 40 | 738,246 | 5,724 | 0.78 | NA | NA | 5,433 | NA |
| Cambridge | Disease 41 | 2,096,784 | 171,075 | 8.16 | NA | NA | 146,212 | NA |
| Cambridge | Disease 42 | 3,247,232 | 2,295,486 | 70.69 | NA | NA | 813,457 | NA |
| Cambridge | Disease 43 | 554,096 | 3,318 | 0.60 | NA | NA | 3,291 | NA |
| Cambridge | Disease 44 | 1,544,178 | 903,730 | 58.52 | NA | NA | 452,230 | NA |
| Cambridge | Disease 45 | 2,648,994 | 132,091 | 4.99 | NA | NA | 115,464 | NA |
| Cambridge | Disease 46 | 2,091,574 | 112,650 | 5.39 | NA | NA | 73,381 | NA |
| Cambridge | Disease 47 | 1,559,028 | 1,492 | 0.10 | NA | NA | 1,489 | NA |
| Cambridge | Disease 48 | 2,670,292 | 26,551 | 0.99 | NA | NA | 25,670 | NA |
| Cambridge | Disease 49 | 2,056,264 | 5,923 | 0.29 | NA | NA | 5,352 | NA |
| Cambridge | Disease 50 | 3,119,110 | 81,631 | 2.62 | NA | NA | 63,264 | NA |
| Cambridge | Disease 51 | 945,096 | 188,307 | 19.92 | NA | NA | 63,761 | NA |
| Cambridge | Disease 52 | 1,047,788 | 21,311 | 2.03 | NA | NA | 20,805 | NA |
| Cambridge | Disease 53 | 947,354 | 78,380 | 8.27 | NA | NA | 35,183 | NA |
| Cambridge | Disease 54 | 1,729,208 | 736,357 | 42.58 | NA | NA | 163,249 | NA |
| Cambridge | Disease 55 | 2,589,948 | 3,042 | 0.12 | NA | NA | 3,019 | NA |
| Cambridge | Disease 56 | 631,500 | 19,934 | 3.16 | NA | NA | 19,197 | NA |
| Cambridge | Disease 57 | 2,524,278 | 4,144 | 0.16 | NA | NA | 4,121 | NA |
| Cambridge | Disease 58 | 1,362,442 | 245,797 | 18.04 | NA | NA | 87,344 | NA |
| Cambridge | Disease 59 | 2,806,760 | 1,194,774 | 42.57 | NA | NA | 250,341 | NA |
| Cambridge | Disease 60 | 2,213,584 | 544,664 | 24.61 | NA | NA | 170,054 | NA |
| Cambridge | Disease 61 | 2,412,222 | 356 | 0.01 | NA | NA | 353 | NA |
| Cambridge | Disease 62 | 2,639,446 | 41,137 | 1.56 | NA | NA | 38,139 | NA |
| Cambridge | Disease 63 | 3,800,714 | 66,612 | 1.75 | NA | NA | 57,373 | NA |
| Cambridge | Disease 64 | 4,179,442 | 32,927 | 0.79 | NA | NA | 30,340 | NA |
| Cambridge | Disease 65 | 2,927,868 | 418 | 0.01 | NA | NA | 415 | NA |
| Cambridge | Disease 66 | 4,635,050 | 592,274 | 12.78 | NA | NA | 366,585 | NA |
| Cambridge | Disease 67 | 4,126,486 | 140,083 | 3.39 | NA | NA | 117,236 | NA |
| Cambridge | Disease 68 | 2,277,294 | 2,755 | 0.12 | NA | NA | 2,697 | NA |
| Cambridge | Disease 69 | 2,963,800 | 1,116,595 | 37.67 | NA | NA | 346,965 | NA |
| Cambridge | Disease 70 | 1,859,700 | 1,163 | 0.06 | NA | NA | 1,158 | NA |
| Cambridge | Disease 71 | 2,307,386 | 10,457 | 0.45 | NA | NA | 10,051 | NA |
| Cambridge | Disease 72 | 2,041,424 | 8,242 | 0.40 | NA | NA | 7,926 | NA |
| Cambridge | Disease 73 | 2,621,932 | 227,027 | 8.66 | NA | NA | 161,484 | NA |
| Cambridge | Disease 74 | 2,007,874 | 219 | 0.01 | NA | NA | 219 | NA |
| Cambridge | Disease 75 | 3,611,160 | 831,708 | 23.03 | NA | NA | 366,327 | NA |
| Cambridge | Disease 76 | 1,596,724 | 1,087 | 0.07 | NA | NA | 1,079 | NA |
| Cambridge | Disease 77 | 2,670,084 | 1,511 | 0.06 | NA | NA | 1,469 | NA |
| Chicago | Disease 78 | 2,299,262 | 1,010 | 0.04 | NA | NA | 1,005 | NA |
| Chicago | Disease 79 | 2,565,346 | 139 | 0.01 | NA | NA | 138 | NA |
| Chicago | Disease 80 | 2,342,156 | 68,152 | 2.91 | NA | NA | 49,162 | NA |
| Chicago | Disease 81 | 3,298,802 | 1,464,153 | 44.38 | NA | NA | 626,228 | NA |
| Chicago | Disease 82 | 2,539,358 | 1,901 | 0.07 | NA | NA | 1,855 | NA |
| Chicago | Disease 83 | 2,981,682 | 281,269 | 9.43 | NA | NA | 201,063 | NA |
| Chicago | Disease 84 | 2,394,688 | 91,325 | 3.81 | NA | NA | 77,979 | NA |
| Chicago | Disease 85 | 3,830,506 | 1,266,358 | 33.06 | NA | NA | 715,601 | NA |
| Chicago | Disease 86 | 3,502,954 | 16,400 | 0.47 | NA | NA | 15,722 | NA |
| Chicago | Disease 87 | 3,352,598 | 149,741 | 4.47 | NA | NA | 73,399 | NA |
| Chicago | Disease 88 | 2,929,918 | 331,619 | 11.32 | NA | NA | 252,323 | NA |
| Chicago | Disease 89 | 3,473,508 | 1,074,750 | 30.94 | NA | NA | 509,394 | NA |
| Chicago | Disease 90 | 1,214,702 | 3,317 | 0.27 | NA | NA | 3,220 | NA |
| Chicago | Disease 91 | 3,825,838 | 21,981 | 0.57 | NA | NA | 20,243 | NA |
| Chicago | Disease 92 | 2,431,028 | 388,718 | 15.99 | NA | NA | 110,424 | NA |
| Chicago | Disease 93 | 2,125,146 | 248,822 | 11.71 | NA | NA | 131,995 | NA |
| Chicago | Disease 94 | 2,879,428 | 469,166 | 16.29 | NA | NA | 115,545 | NA |
| Chicago | Disease 95 | 2,267,290 | 270,505 | 11.93 | NA | NA | 63,267 | NA |
| Chicago | Disease 96 | 2,804,470 | 579,565 | 20.67 | NA | NA | 187,402 | NA |
| Chicago | Disease 97 | 3,202,992 | 184,491 | 5.76 | NA | NA | 64,034 | NA |
| Chicago | Disease 98 | 2,759,690 | 24,435 | 0.89 | NA | NA | 23,751 | NA |
| Chicago | Disease 99 | 1,092,508 | 6,756 | 0.62 | NA | NA | 6,499 | NA |
| Chicago | Disease 100 | 3,637,688 | 328,733 | 9.04 | NA | NA | 141,947 | NA |
| Chicago | Disease 101 | 3,119,986 | 396,859 | 12.72 | NA | NA | 183,655 | NA |
| Chicago | Disease 102 | 2,732,006 | 1,316,100 | 48.17 | NA | NA | 522,713 | NA |
Initially, total reads (unduplicated) were mapped to ALL contigs. In healthy individuals, all reads were deduplicated and then mapped to our contigs. Because deduplication did not modify our results, in disease individuals only used reads (reads that mapped to our contigs initially) were further trimmed, deduplicated, and remapped.
Individuals from this dataset were not analyzed separately.
Fig. 1.

Heat map indicating the presence of the 72 complete bacteriophage genomes in the globally distributed 62 healthy individuals represented in the Norman dataset (7). The percentage of healthy individuals from three global locations (Boston, Cambridge, Chicago) that harbor each of the complete bacteriophage genomes is indicated. Nine bacteriophages, including crAssphage (bacteriophage 31), were present in >50% of the individuals (core), and 46% were found in >20% of the individuals (core and common). Each line is a bacteriophage (phage).
Fig. S3.

Detection of HGP bacteriophage using increasing detection threshold. Core healthy gut phageome (HGP) bacteriophages were identified in individuals by read recruitment of high-quality deduplicated reads to bacteriophage contigs. If there was one read recruited, the virus was considered present in an individual. The percentage of individuals in which we could detect these bacteriophages using increasing detection thresholds (1 read versus 2, 5, 10, 50, or 100) is represented.
To add confidence to these results, we reversed the process by first independently assembling the bacteriophage community from healthy individuals within the Norman dataset, followed by read recruitment from all of the individuals. We observed the same general findings. Of the 13,707 bacteriophage contigs from the 62 Norman healthy individuals, 1,408 (9%) were found in more than 20% of the individuals and 115 (0.83%) were found in more than 50% of the individuals. The average size of these contigs was 7 kb, compared with 32 kb of the HGP bacteriophages from our ALL dataset. This suggested that these contigs could be partial fragments from the core and common bacteriophages identified in the two test individuals. When we compared the HGPs from the two test individuals with the Norman HGP, we identified all of the HGP bacteriophages initially identified in our ALL set. Of the 1,408 shared bacteriophages in the Norman dataset, 1,013 (71%) were highly related to the HGP. We also identified additional potential core bacteriophages (n = 10) and common bacteriophages (n = 86) (Table S4). These results show that our approach of using only two test individuals but ultradeep sequencing their bacteriophage community was sufficient to detect a HGP. We speculate that a much larger HGP will be identified by analyzing additional healthy individuals.
Table S4.
HGP contigs identified in Norman individuals not previously identified in study individuals
| Phage contig | Network group* | Length, bp | Cohort | Type of phage | % Individuals with contig |
| Cross_Contig_26 | 1 | 37,893 | Cross | Common | 23 |
| Cross_Contig_43 | 1 | 21,615 | Cross | Common | 38 |
| Cross_Contig_241 | 1 | 12,042 | Cross | Common | 34 |
| Boston_contig_469 | 1 | 6,505 | Boston | Common | 27 |
| Boston_contig_638 | 1 | 5,530 | Boston | Common | 31 |
| Boston_contig_682 | 1 | 5,315 | Boston | Common | 28 |
| Chicago_contig_492 | 1 | 5,284 | Chicago | Common | 20 |
| Cambridge_contig_529 | 1 | 5,267 | Cambridge | Common | 23 |
| Boston_contig_353 | 2 | 8,332 | Boston | Common | 20 |
| Boston_contig_194 | 3 | 13,150 | Boston | Common | 28 |
| Cambridge_contig_359 | 3 | 6,330 | Cambridge | Core | 58 |
| Cambridge_contig_378 | 3 | 6,169 | Cambridge | Core | 56 |
| Boston_contig_524 | 3 | 6,163 | Boston | Common | 38 |
| Chicago_contig_388 | 3 | 6,120 | Chicago | Core | 55 |
| Cambridge_contig_392 | 3 | 6,079 | Cambridge | Core | 53 |
| Boston_contig_540 | 3 | 6,068 | Boston | Common | 30 |
| Boston_contig_1250 | 3 | 5,858 | Boston | Common | 41 |
| Chicago_contig_459 | 3 | 5,565 | Chicago | Common | 38 |
| Chicago_contig_515 | 3 | 5,176 | Chicago | Common | 25 |
| Cross_Contig_124 | 11 | 10,476 | Cross | Common | 34 |
| Cambridge_contig_553 | 11 | 5,122 | Cambridge | Common | 20 |
| Cross_Contig_11 | 20 | 94,996 | Cross | Common | 23 |
| Cambridge_contig_58 | 20 | 20,080 | Cambridge | Common | 20 |
| Cross_Contig_309 | 22 | 5,673 | Cross | Common | 34 |
| Boston_contig_86 | 23 | 22,335 | Boston | Common | 22 |
| Cross_Contig_21 | 29 | 14,389 | Cross | Common | 20 |
| Cross_Contig_67 | 29 | 13,787 | Cross | Common | 22 |
| Boston_contig_579 | 29 | 5,891 | Boston | Common | 22 |
| Boston_contig_11 | 41 | 51,927 | Boston | Common | 30 |
| Cross_Contig_198 | 41 | 30,179 | Cross | Common | 30 |
| Cross_Contig_240 | 41 | 12,059 | Cross | Common | 22 |
| Cross_Contig_16 | 42 | 42,054 | Cross | Common | 31 |
| Cambridge_contig_463 | 42 | 7,029 | Cambridge | Common | 22 |
| Cross_Contig_288 | 42 | 6,952 | Cross | Common | 20 |
| Cross_Contig_327 | 42 | 5,106 | Cross | Common | 25 |
| Cambridge_contig_313 | 49 | 6,699 | Cambridge | Common | 39 |
| Chicago_contig_530 | 49 | 5,040 | Chicago | Common | 34 |
| Chicago_contig_310 | 59 | 6,806 | Chicago | Common | 38 |
| Boston_contig_480 | 59 | 6,446 | Boston | Common | 22 |
| Cambridge_contig_722 | 59 | 6,289 | Cambridge | Common | 33 |
| Chicago_contig_670 | 59 | 5,589 | Chicago | Common | 27 |
| Cambridge_contig_544 | 59 | 5,176 | Cambridge | Common | 23 |
| Cross_Contig_125 | 68 | 10,471 | Cross | Common | 48 |
| Cambridge_contig_289 | 68 | 7,087 | Cambridge | Common | 44 |
| Chicago_contig_309 | 69 | 6,807 | Chicago | Core | 52 |
| Boston_contig_455 | 69 | 6,683 | Boston | Core | 53 |
| Boston_contig_472 | 69 | 6,487 | Boston | Common | 31 |
| Cambridge_contig_380 | 69 | 6,161 | Cambridge | Core | 56 |
| Cross_Contig_265 | 75 | 8,774 | Cross | Common | 23 |
| Chicago_contig_362 | 76 | 6,258 | Chicago | Common | 28 |
| Boston_contig_62 | 77 | 26,488 | Boston | Common | 20 |
| Boston_contig_246 | 77 | 10,888 | Boston | Common | 20 |
| Cambridge_contig_480 | 80 | 5,603 | Cambridge | Core | 50 |
| Boston_contig_76 | 82 | 23,429 | Boston | Common | 42 |
| Boston_contig_446 | 83 | 6,793 | Boston | Common | 20 |
| Cambridge_contig_326 | 83 | 6,605 | Cambridge | Common | 20 |
| Chicago_contig_389 | 83 | 6,115 | Chicago | Common | 25 |
| Cross_Contig_107 | 86 | 30,526 | Cross | Common | 28 |
| Cross_Contig_10 | 86 | 29,265 | Cross | Common | 33 |
| Cross_Contig_203 | 86 | 27,447 | Cross | Common | 39 |
| Cross_Contig_232 | 86 | 14,021 | Cross | Common | 27 |
| Chicago_contig_156 | 86 | 10,806 | Chicago | Common | 30 |
| Cross_Contig_136 | 86 | 6,963 | Cross | Common | 31 |
| Cambridge_contig_413 | 86 | 5,961 | Cambridge | Common | 27 |
| Cross_Contig_32 | 90 | 15,929 | Cross | Common | 28 |
| Cambridge_contig_372 | 100 | 6,226 | Cambridge | Common | 25 |
| Cambridge_contig_381 | 100 | 6,158 | Cambridge | Common | 20 |
| Chicago_contig_391 | 100 | 6,097 | Chicago | Common | 27 |
| Boston_contig_624 | 100 | 5,627 | Boston | Common | 27 |
| Boston_contig_607 | 103 | 8,783 | Boston | Common | 28 |
| Cambridge_contig_1460 | 103 | 6,335 | Cambridge | Common | 30 |
| Boston_contig_15 | 112 | 46,981 | Boston | Common | 20 |
| Boston_contig_197 | 116 | 13,014 | Boston | Common | 34 |
| Cross_Contig_194 | 128 | 54,756 | Cross | Common | 28 |
| Chicago_contig_34 | 128 | 27,151 | Chicago | Common | 23 |
| Cross_Contig_237 | 128 | 12,633 | Cross | Common | 20 |
| Boston_contig_389 | 128 | 7,556 | Boston | Common | 22 |
| Cambridge_contig_482 | 128 | 5,598 | Cambridge | Common | 20 |
| Boston_contig_238 | 154 | 11,135 | Boston | Common | 20 |
| Cross_Contig_112 | 171 | 20,983 | Cross | Common | 20 |
| Cambridge_contig_99 | 259 | 14,728 | Cambridge | Common | 30 |
| Cambridge_contig_349 | 355 | 6,389 | Cambridge | Common | 28 |
| Boston_contig_498 | 355 | 6,330 | Boston | Common | 25 |
| Cambridge_contig_360 | 355 | 6,328 | Cambridge | Common | 31 |
| Boston_contig_499 | 355 | 6,325 | Boston | Common | 28 |
| Boston_contig_534 | 355 | 6,090 | Boston | Common | 34 |
| Boston_contig_805 | 355 | 6,073 | Boston | Core | 50 |
| Chicago_contig_471 | 355 | 5,479 | Chicago | Common | 41 |
| Chicago_contig_517 | 355 | 5,166 | Chicago | Common | 34 |
| Boston_contig_712 | 374 | 5,185 | Boston | Common | 23 |
| Cambridge_contig_347 | 387 | 6,407 | Cambridge | Common | 23 |
| Boston_contig_512 | 387 | 6,218 | Boston | Common | 34 |
| Cambridge_contig_448 | 387 | 5,779 | Cambridge | Common | 20 |
| Cambridge_contig_318 | 478 | 6,674 | Cambridge | Common | 25 |
| Cross_Contig_82 | 678 | 7,268 | Cross | Common | 23 |
| Cross_Contig_65 | 686 | 15,244 | Cross | Core | 53 |
“Cross” indicates reference sequence from contigs from different cohorts assembled together through Geneious.
Network groups from this analysis do not correspond to the groups from the ALL dataset viral network reported in the main text.
Erroneous mapping of sequencing reads was tested by mapping over 38 million viral metagenomic reads from other environments (marine and hot spring environments) and a synthetic dataset to ALL contigs. No reads were recruited. We used the synthetic dataset to estimate the percentage of true positives by mapping the synthetic reads back to a collection of 1,197 Caudovirales (including the 50 genomes from which the synthetic reads were derived). The error rate used to create this dataset was set at 1.5% (a value set by the program) compared with the estimated Illumina error rate of 0.0046% (14). We found that 93% of the contigs called were true positives (Table S5) and that increasing the number of reads required to call a contig did not significantly change this percentage (Table S5). Given the high error rate in the synthetic dataset, the frequency of miscalled contigs in our experimental datasets is likely much lower (approximately one order of magnitude), providing confidence that using even a single read to identify shared bacteriophages is a valid approach.
Table S5.
Mapping error
| Number of reads used to deem a contig present | 1 read | 5 reads | 10 reads | 50 reads | 100 read |
| Number of miss-called contigs | 88 | 75 | 68 | 65 | 47 |
| Percentage of miss-called contigs | 7.35 | 6.27 | 5.68 | 5.43 | 3.93 |
| Percentage of reads assigned correctly | 92.9 | 93.6 | 94.2 | 95.4 | 95.7 |
To investigate whether HGP bacteriophages play a role in maintaining human health, we compared the prevalence of core bacteriophages in healthy individuals to those with irritable bowel disease (IBD) [n = 66 with ulcerative colitis (UC); n = 36 with Crohn’s disease (CD)] (7) (Fig. 2). Although core bacteriophages are found on average in 62% of healthy individuals, their prevalence was reduced by 42% and 54% on average in UC and CD patients, respectively (value of P < 0.0001) (Fig. 2A). Moreover, healthy subjects harbored on average 62% of the 23 core bacteriophages; however, in UC and CD patients, the average is significantly reduced to 37% and 30%, respectively (value of P < 0.0001) (Fig. 2B). These results suggest that the HGP is significantly perturbed in diseased patients.
Fig. 2.

Reduction of the HGP present in IBD patients. (A) Comparison of percentage of healthy individuals (H) (n = 62) versus IBD-diseased individuals (CD and UC) (n = 102) that harbor each of the 23 core HGPs identified in this study. (B) Percentage of core, common, and unique bacteriophages (unique and low-overlap bacteriophages were pooled) present in all healthy and IBD individuals. Median is shown with a horizontal black bar. The number of core and common bacteriophages that IBD individuals harbor is significantly lower compared with healthy individuals. Significance was calculated using a Sidak’s multiple-comparison test with a 95% confidence interval.
To analyze the HGP structure, we conducted a network analysis using ALL contigs. The network groups viruses based on sequence homology to identify related viruses and to organize short contigs from partial genomes that dominate metagenomic datasets (9). A total of 240 statistically supported groups was identified (clustering coefficient value of 0.667 and modularity value of 0.675), with 44 containing five or more contigs (Fig. 3A and Table S6). Groups with less than five contigs represented only 11% of the total reads and were excluded to focus on the largest groups of related sequences. Of the 72 complete genomes, 45 (63%) were present and belonged to 17 different groups. One of these groups contained crAssphage and three additional complete crAssphage-related genomes. Previously classified phage genomes were mapped onto the network to test the accuracy of the grouping, and in nearly all cases (25 of 28), phages belonging to the same family grouped together. We also evaluated 172 artificially fragmented Caudovirales genomes. The fragmented genomes clustered as expected, with 20 of 26 being family-specific groups. Only six groups had fragments from more than one family, which is consistent with the high level of horizontal gene transfer shown between bacteriophages (15). These results suggest that the 44 network-defined groups can be considered roughly as family-level groups. Only 14 of the 44 network-defined groups contained classified bacteriophages, supporting that novel bacteriophages are abundant in the human gut. The network analysis proved useful in reducing the complexity of metagenomic datasets by organizing contigs into biologically relevant groups. Whether the members of these groups carry out similar functions in the gut is a subject for future study.
Fig. 3.

Network-based analysis of the bacteriophage community in the human gut from two healthy individuals. (A) Graphical representation of the 44 network groups (colored by group) with greater than five contig membership. Each dot represents a contig. (B) Core groups (present in more than one-half of the individuals) are highlighted and labeled in red. (C) Heat map representing the percentage of individuals that have at least one member of each phage group. (D) Schematic organization of the bacteriophage community associated with the healthy gut microbiome.
Table S6.
Network phage groups membership
| Phage group | Partial or complete phage in group | Complete phage in group | Type of group |
| 0 | 8 | 0 | Common |
| 1 | 10 | 0 | Common |
| 2 | 15 | 0 | Common |
| 3 | 12 | 0 | Unique |
| 4 | 401 | 1 | Low overlap |
| 5 | 13 | 0 | Low overlap |
| 6 | 87 | 6 | Core |
| 7 | 55 | 6 | Core |
| 8 | 9 | 1 | Common |
| 9 | 7 | 0 | Low overlap |
| 10 | 31 | 1 | Unique |
| 11 | 5 | 2 | Common |
| 12 | 21 | 2 | Core |
| 13 | 38 | 4 | Core |
| 14 | 8 | 0 | Common |
| 15 | 34 | 3 | Common |
| 16 | 8 | 2 | Common |
| 17 | 6 | 0 | Unique |
| 18 | 14 | 0 | Common |
| 19 | 23 | 0 | Unique |
| 20 | 11 | 1 | Unique |
| 21 | 10 | 0 | Low overlap |
| 22 | 6 | 0 | Unique |
| 23 | 23 | 2 | Core |
| 24 | 17 | 2 | Low overlap |
| 25 | 6 | 0 | Unique |
| 26 | 86 | 0 | Low overlap |
| 27 | 13 | 0 | Unique |
| 28 | 5 | 0 | Common |
| 29 | 70 | 4 | Core |
| 30 | 21 | 0 | Common |
| 31 | 39 | 0 | Common |
| 32 | 18 | 0 | Unique |
| 33 | 9 | 0 | Unique |
| 34 | 27 | 0 | Common |
| 35 | 6 | 1 | Low overlap |
| 36 | 6 | 0 | Low overlap |
| 37 | 76 | 4 | Core |
| 38 | 24 | 0 | Core |
| 39 | 10 | 0 | Low overlap |
| 40 | 11 | 0 | Low overlap |
| 41 | 65 | 3 | Core |
| 42 | 5 | 0 | Low overlap |
| 43 | 5 | 0 | Low overlap |
| Not in network | 2,927 | 27 | NA |
The network analysis supports the global distribution of the HGP. The majority (41 of 44) of network-defined groups were present in at least one of our test subjects (Table S7); in the Norman study (Fig. 3C), 12 groups were present in 2–20% of individuals (low overlap group); 13 were present in 20–50% (common groups); and 9, including the crAssphage and 2 other groups with complete genome representatives, were present in >50% of healthy individuals (core groups, Fig. 3B). Overall, the viral network represents a more encompassing view of the viral community than can be seen by only looking at the limited number of specific taxa classified by fragmented sequence information and supports the existence of a definable HGP.
Table S7.
Percentage abundance of groups identified by network analysis in study individuals
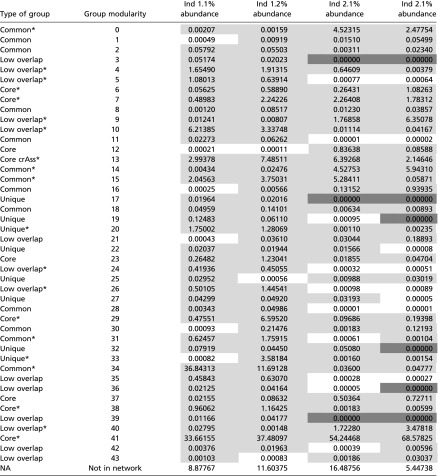 |
Light gray indicates group with more than 0.001% of abundance. Dark gray indicates groups that have no members in the specific individual and time point.
*Groups with more than 1% of abundance in at least one individual at one time point.
Discussion
The overall objective of this study was to investigate the presence of a HGP. We propose that the phageome of healthy people can be divided into three classes (Fig. 3D): (i) the core, found in more than one-half of all individuals; (ii) the common, shared among many individuals; and (iii) the low overlap/unique, found in a limited number of individuals. The core is composed of at least 23 bacteriophages in this study and is significantly reduced in UC and CD patients, suggesting that these bacteriophages play a role in maintaining human health. Our results do not account for temporal dynamics in either the GM or phageome. Therefore, our estimates of sharing (>50%, 20–50%, 2–20%) for these bacteriophage categories are conservative and may need to be refined with temporal data from more subjects.
The role of bacteriophages in the human GM is poorly understood. In most bacteria-dominated ecosystems, bacteriophages play a key role in shaping community structure and function (16, 17). Thus, it is expected that the human gut ecosystem is strongly affected by the activity of bacteriophages. Microbe–virus interactions are often dominated by lytic interactions in a prey–predator dynamic (18). However, community sequence analysis of the human gut indicates that lysogenic bacteriophages (prophages) dominate over lytic bacteriophages (6, 8, 19). It is thought that the majority of bacterial cells contain at least one prophage, and that selective activation of a subset of these prophages is what can be detected as the active phageome in stool samples. The dynamics that arise from a lytic–lysogenic balance in the gut are still unknown. However, the active gut bacteriophages have been shown to influence bacterial population dynamics in a murine gut microbial ecosystem model (20), and to confer advantages to certain microbiome members during stress, such as antibiotic exposure (21). We presume that the active phageome of healthy people plays a critical role in maintaining the structure and function of a healthy gut ecosystem. Although the HGP represents a small proportion of the overall potential gut bacteriophage community, elucidating the role of the active phageome in a healthy gut will be essential to fully understanding its potential roles in disease or rehabilitation following episodes of microbiome imbalance.
Identification of a human HGP was somewhat surprising. Currently, two somewhat contrasting views of human gut phageome exist. On one hand, there is evidence of more phageome similarity among relatives and household members compared with unrelated individuals (7, 8). On the other hand, there is evidence that some phages are common to unrelated people (13, 19, 20, 22). Stern et al. (19) identified 991 bacteriophage sequences from cellular metagenomes that were shared across 124 individuals. The majority of these bacteriophages appeared to be integrated prophages, and only a small fraction was present as VLPs. We found an expanded set of shared phages as well as phages that were unique to individuals. It is likely that the core HGP is hosted by core gut bacteria detected by others (3, 12). Our work provides a more comprehensive view and accurate estimate of phageome overlap. We presume even more overlap will be discovered with greater sequencing depth, the application of similar network analytical approaches, and consideration of more individuals.
In humans, viruses are often viewed as deleterious disease-causing agents, but the existence of an HGP suggests that the net influence of bacteriophages in the human gut is not deleterious, but rather beneficial. Despite large differences in the species composition of gut bacteria between people, there is a reproducible, higher-level taxonomic signature (4). This higher-level structure is thought to be a marker of a healthy gut ecosystem. We posit that bacteriophages play an essential role in this ecosystem and that the human HGP, arising from the large pool of cellular prophages, likely contributes to the proper function of the healthy GM by influencing the stability and maintenance of a healthy ecosystem through active lysis and predator–prey dynamics.
Our results increase the known repertoire of shared bacteriophages in healthy humans and expand the number of complete core HGP genomes from one (crAssphage) to nine representatives. Network analysis identified groups of related viruses, and provided a powerful tool to organize and reduce the complexity of fragmented metagenomic data. We suspect that our efforts (sequencing and computation) underestimated the full extent of the human HGP, and that larger studies will generate even more accurate estimates of HGP prevalence, which will allow for a better understanding of the cosmopolitan human phageome. Future studies are needed to address the role of the HGP in health and disease, and to assess the potential use of core bacteriophages for clinical therapeutics and controlled manipulation of the human gut ecosystem.
Materials and Methods
Sample Collection.
Samples were collected from two individuals of 26 and 55 y at two time points over a period from time 0–3 or 15 mo, respectively, under a protocol approved by the Internal Review Board of Montana State University. Both individuals were healthy, with normal bowel movement (at least once every 2 d and no more than three times a day), and had not received antibiotics for >2 mo before the collection of the samples. Collections were carried out with subject’s informed consent under an approved institutional review board protocol.
VLP Isolation, DNA Extraction, and Sequencing.
VLPs were purified based on Minot et al. (6) (modification: 0.45-μm filtration). The 1.5 g/cm3 fractions were pooled, dialyzed, and DNase treated, and DNA was extracted using PureLink Viral DNA/RNA extraction kit (Invitrogen) and sequenced using MiSeq Paired End Illumina Technology.
Bacteriophage Sequences Assemblies.
Bacteriophage sequences from two test individuals were initially assembled using MIRA 4.0 (23) and VICUNA (24) [quality trimmed reads using Trimmomatic v0.32 (25), 25-bp overlap at a minimum of 90% identity, and a minimum contig size of 1,000 bp]. Contigs generated by MIRA and VICUNA were further assembled to each other using Geneious 9.0.2 (contigs had to overlap across 250 bp at 98% identity to be assembled) (26). An ALL dataset was generated by assembling contigs from all time points and individuals together, at 500-bp overlap at a minimum of 98% identity, using Geneious. Norman dataset reads were quality trimmed using Trimmomatic. Individual reads were grouped by cohort, and pooled reads were cross-assembled with IDBA-UD (27) using minimum and maximum kmer lengths of 20 and 120, respectively (7). Contigs longer than 1,000 bp obtained were pooled together and assembled using Geneious and manually curated using the same parameters as in our experimental approach.
Bacteriophage Community Analysis.
Reads were recruited to contigs using Geneious with high-stringency parameters [a read needed to be >98% identical across its entire length (300 bp) to be recruited]. The number of reads per contig was normalized to the length of the contig (number of total base pairs aligned to contig/base pair of contig). The percentage of total normalized reads to a contig was considered the percentage of the bacteriophage community accounted for by a particular contig. BC distances and between communities and Shannon index were calculated using vegan package in R.
Taxonomic Classification and Detection of Bacteriophage Genes.
ORFs were predicted using the WebMGA server. Proteins longer than 100 aa with less than 1% of the length of ambiguities were queried against ACLAME database (e value < 1e-10) and contigs were classified based on Waller (28).
Detection of Contigs in Publicly Available Metagenomes.
Reads from the Norman dataset (7) were quality trimmed using Trimmomatic v0.32 (25) and deduplicated using cd-hit-dup (29). Trimmed unique reads were mapped to ALL contigs using high-stringency parameters [90% identity across the full length of the maximum read length (250 bp) using Geneious]. Reads shorter than this length will not be aligned; thus, these parameters only allow for high-quality deduplicated reads to be recruited to contigs.
Read Recruitment Controls.
Because read length from the hot springs datasets (9) was very heterogeneous (340–855 bp), reads were aligned at 90% over the minimum length of these datasets. Reads from marine metagenomes [deep ocean hydrothermal vent (SRR3133481)] were mapped with the same aligning parameters as the reads from the Norman dataset, adjusting the read length to the size of the reads from this dataset (202 bp). A synthetic dataset was generated from randomly selected 50 genomes from a list of 1,197 complete Caudovirales genomes downloaded from National Center for Biotechnology Information with Grinder (30). The generated 2,000,000 Illumina reads (250 bp) were mapped to ALL contigs and to the set of 1,197 genomes using the same parameters as for Norman reads (see above).
Network Analysis.
The network analysis was carried out based on Bolduc et al. (9). Briefly, network analysis is based on an all-versus-all BLASTn/leuvin search that incorporates both the number and strength of matches between contigs to group-related sequences into discrete groups. BLASTN analysis was performed with default parameters, except e-value cutoff was set to 1E-10 and max target sequences to 10,000. Matches were filtered based on the parameters of high-scoring segment pair (HSP) length > 200 (minimum alignment length) and 75% nucleotide identity. The network algorithm measures the number and weight (HSP and e value) of these connections and clusters sequences into groups of highly related sequences. The network was manually curated and visualized using Gephi with ARF view. A network control was performed on 172 complete Caudovirales genomes associated with bacterial host from the human gut (31). Genomes were fragmented into 9,000 with 50-bp overlap using an in-house python script (9), and network analysis was performed using the same parameters used in the ALL dataset network.
Identification of HGP Bacteriophages in Norman Assemblies.
HGP bacteriophages were identified via network analysis. Contigs from our ALL and Norman dataset were pooled together. An all-versus-all BLASTN analysis was performed and network analysis was applied (see above). Contigs that were in the same group as HGP bacteriophages identified in our analysis were considered closely related HGP bacteriophages.
Acknowledgments
We thank Dr. Herbert W. Virgin and Dr. Scott A. Handley of Washington University School of Medicine for sharing their data with us. This work was supported by National Institutes of Health Grant R01-1R01GM117361.
Footnotes
The authors declare no conflict of interest.
This article is a PNAS Direct Submission.
Data deposition: All sequence reads reported in this paper have been deposited in the National Center for Biotechnology Information Sequence Read Archive (accession nos. SAMN04415496–SAMN04415499).
This article contains supporting information online at www.pnas.org/lookup/suppl/doi:10.1073/pnas.1601060113/-/DCSupplemental.
References
- 1.Arumugam M, et al. MetaHIT Consortium Enterotypes of the human gut microbiome. Nature. 2011;473(7346):174–180. doi: 10.1038/nature09944. [DOI] [PMC free article] [PubMed] [Google Scholar]
- 2.Huttenhower C, et al. Human Microbiome Project Consortium Structure, function and diversity of the healthy human microbiome. Nature. 2012;486(7402):207–214. doi: 10.1038/nature11234. [DOI] [PMC free article] [PubMed] [Google Scholar]
- 3.Qin J, et al. MetaHIT Consortium A human gut microbial gene catalogue established by metagenomic sequencing. Nature. 2010;464(7285):59–65. doi: 10.1038/nature08821. [DOI] [PMC free article] [PubMed] [Google Scholar]
- 4.Peterson DA, Frank DN, Pace NR, Gordon JI. Metagenomic approaches for defining the pathogenesis of inflammatory bowel diseases. Cell Host Microbe. 2008;3(6):417–427. doi: 10.1016/j.chom.2008.05.001. [DOI] [PMC free article] [PubMed] [Google Scholar]
- 5.Minot S, et al. Rapid evolution of the human gut virome. Proc Natl Acad Sci USA. 2013;110(30):12450–12455. doi: 10.1073/pnas.1300833110. [DOI] [PMC free article] [PubMed] [Google Scholar]
- 6.Minot S, et al. The human gut virome: Inter-individual variation and dynamic response to diet. Genome Res. 2011;21(10):1616–1625. doi: 10.1101/gr.122705.111. [DOI] [PMC free article] [PubMed] [Google Scholar]
- 7.Norman JM, et al. Disease-specific alterations in the enteric virome in inflammatory bowel disease. Cell. 2015;160(3):447–460. doi: 10.1016/j.cell.2015.01.002. [DOI] [PMC free article] [PubMed] [Google Scholar]
- 8.Reyes A, et al. Viruses in the faecal microbiota of monozygotic twins and their mothers. Nature. 2010;466(7304):334–338. doi: 10.1038/nature09199. [DOI] [PMC free article] [PubMed] [Google Scholar]
- 9.Bolduc B, Wirth JF, Mazurie A, Young MJ. Viral assemblage composition in Yellowstone acidic hot springs assessed by network analysis. ISME J. 2015;9(10):2162–2177. doi: 10.1038/ismej.2015.28. [DOI] [PMC free article] [PubMed] [Google Scholar]
- 10.Zhang T, et al. RNA viral community in human feces: Prevalence of plant pathogenic viruses. PLoS Biol. 2006;4(1):e3. doi: 10.1371/journal.pbio.0040003. [DOI] [PMC free article] [PubMed] [Google Scholar]
- 11.Kozich JJ, Westcott SL, Baxter NT, Highlander SK, Schloss PD. Development of a dual-index sequencing strategy and curation pipeline for analyzing amplicon sequence data on the MiSeq Illumina sequencing platform. Appl Environ Microbiol. 2013;79(17):5112–5120. doi: 10.1128/AEM.01043-13. [DOI] [PMC free article] [PubMed] [Google Scholar]
- 12.Tap J, et al. Towards the human intestinal microbiota phylogenetic core. Environ Microbiol. 2009;11(10):2574–2584. doi: 10.1111/j.1462-2920.2009.01982.x. [DOI] [PubMed] [Google Scholar]
- 13.Dutilh BE, et al. A highly abundant bacteriophage discovered in the unknown sequences of human faecal metagenomes. Nat Commun. 2014;5:4498. doi: 10.1038/ncomms5498. [DOI] [PMC free article] [PubMed] [Google Scholar]
- 14.Ross MG, et al. Characterizing and measuring bias in sequence data. Genome Biol. 2013;14(5):R51. doi: 10.1186/gb-2013-14-5-r51. [DOI] [PMC free article] [PubMed] [Google Scholar]
- 15.Lima-Mendez G. Reticulate classification of mosaic microbial genomes using NeAT website. Methods Mol Biol. 2012;804:81–91. doi: 10.1007/978-1-61779-361-5_5. [DOI] [PubMed] [Google Scholar]
- 16.Rohwer F, Prangishvili D, Lindell D. Roles of viruses in the environment. Environ Microbiol. 2009;11(11):2771–2774. doi: 10.1111/j.1462-2920.2009.02101.x. [DOI] [PubMed] [Google Scholar]
- 17.Suttle CA. Marine viruses—Major players in the global ecosystem. Nat Rev Microbiol. 2007;5(10):801–812. doi: 10.1038/nrmicro1750. [DOI] [PubMed] [Google Scholar]
- 18.Rodriguez-Valera F, et al. Explaining microbial population genomics through phage predation. Nat Rev Microbiol. 2009;7(11):828–836. doi: 10.1038/nrmicro2235. [DOI] [PubMed] [Google Scholar]
- 19.Stern A, Mick E, Tirosh I, Sagy O, Sorek R. CRISPR targeting reveals a reservoir of common phages associated with the human gut microbiome. Genome Res. 2012;22(10):1985–1994. doi: 10.1101/gr.138297.112. [DOI] [PMC free article] [PubMed] [Google Scholar]
- 20.Reyes A, Wu M, McNulty NP, Rohwer FL, Gordon JI. Gnotobiotic mouse model of phage-bacterial host dynamics in the human gut. Proc Natl Acad Sci USA. 2013;110(50):20236–20241. doi: 10.1073/pnas.1319470110. [DOI] [PMC free article] [PubMed] [Google Scholar]
- 21.Modi SR, Lee HH, Spina CS, Collins JJ. Antibiotic treatment expands the resistance reservoir and ecological network of the phage metagenome. Nature. 2013;499(7457):219–222. doi: 10.1038/nature12212. [DOI] [PMC free article] [PubMed] [Google Scholar]
- 22.Reyes A, et al. Gut DNA viromes of Malawian twins discordant for severe acute malnutrition. Proc Natl Acad Sci USA. 2015;112(38):11941–11946. doi: 10.1073/pnas.1514285112. [DOI] [PMC free article] [PubMed] [Google Scholar]
- 23.Chevreux B, Wetter T, Suhai S. 1999. Genome sequence assembly using trace signals and additional sequence information. Computer Science and Biology: Proceedings of the German Conference on Bioinformatics (Gesellschaft für Biotechnologische Forschung, Braunschweig, Germany), Vol 99, pp 45–56.
- 24.Yang X, et al. De novo assembly of highly diverse viral populations. BMC Genomics. 2012;13:475. doi: 10.1186/1471-2164-13-475. [DOI] [PMC free article] [PubMed] [Google Scholar]
- 25.Bolger AM, Lohse M, Usadel B. Trimmomatic: A flexible trimmer for Illumina sequence data. Bioinformatics. 2014;30(15):2114–2120. doi: 10.1093/bioinformatics/btu170. [DOI] [PMC free article] [PubMed] [Google Scholar]
- 26.Kearse M, et al. Geneious Basic: An integrated and extendable desktop software platform for the organization and analysis of sequence data. Bioinformatics. 2012;28(12):1647–1649. doi: 10.1093/bioinformatics/bts199. [DOI] [PMC free article] [PubMed] [Google Scholar]
- 27.Peng Y, Leung HC, Yiu SM, Chin FY. IDBA-UD: A de novo assembler for single-cell and metagenomic sequencing data with highly uneven depth. Bioinformatics. 2012;28(11):1420–1428. doi: 10.1093/bioinformatics/bts174. [DOI] [PubMed] [Google Scholar]
- 28.Waller AS, et al. Classification and quantification of bacteriophage taxa in human gut metagenomes. ISME J. 2014;8(7):1391–1402. doi: 10.1038/ismej.2014.30. [DOI] [PMC free article] [PubMed] [Google Scholar]
- 29.Fu L, Niu B, Zhu Z, Wu S, Li W. CD-HIT: Accelerated for clustering the next-generation sequencing data. Bioinformatics. 2012;28(23):3150–3152. doi: 10.1093/bioinformatics/bts565. [DOI] [PMC free article] [PubMed] [Google Scholar]
- 30.Angly FE, Willner D, Rohwer F, Hugenholtz P, Tyson GW. Grinder: A versatile amplicon and shotgun sequence simulator. Nucleic Acids Res. 2012;40(12):e94. doi: 10.1093/nar/gks251. [DOI] [PMC free article] [PubMed] [Google Scholar]
- 31.Ogilvie LA, et al. Comparative (meta)genomic analysis and ecological profiling of human gut-specific bacteriophage φB124-14. PLoS One. 2012;7(4):e35053. doi: 10.1371/journal.pone.0035053. [DOI] [PMC free article] [PubMed] [Google Scholar]