

Abstract
Background:
Recent developments in molecular pathology and genetic/epigenetic analysis of cancer tissue have resulted in a marked increase in objective and measurable data. In comparison, the traditional morphological analysis approach to pathology diagnosis, which can connect these molecular data and clinical diagnosis, is still mostly subjective. Even though the advent and popularization of digital pathology has provided a boost to computer-aided diagnosis, some important pathological concepts still remain largely non-quantitative and their associated data measurements depend on the pathologist's sense and experience. Such features include pleomorphism and heterogeneity.
Methods and Results:
In this paper, we propose a method for the objective measurement of pleomorphism and heterogeneity, using the cell-level co-occurrence matrix. Our method is based on the widely used Gray-level co-occurrence matrix (GLCM), where relations between neighboring pixel intensity levels are captured into a co-occurrence matrix, followed by the application of analysis functions such as Haralick features. In the pathological tissue image, through image processing techniques, each nucleus can be measured and each nucleus has its own measureable features like nucleus size, roundness, contour length, intra-nucleus texture data (GLCM is one of the methods). In GLCM each nucleus in the tissue image corresponds to one pixel. In this approach the most important point is how to define the neighborhood of each nucleus. We define three types of neighborhoods of a nucleus, then create the co-occurrence matrix and apply Haralick feature functions. In each image pleomorphism and heterogeneity are then determined quantitatively. For our method, one pixel corresponds to one nucleus feature, and we therefore named our method Cell Feature Level Co-occurrence Matrix (CFLCM). We tested this method for several nucleus features.
Conclusion:
CFLCM is showed as a useful quantitative method for pleomorphism and heterogeneity on histopathological image analysis.
Keywords: Cancer, heterogeneity, pleomorphism, quantification
INTRODUCTION
Digitization of histological slides has gained wide usage after the commercialization of whole slide imaging (WSI) scanners. On the computer side, many free software tools for analyzing these images have become available on the Internet. Digital pathology is still in a developing stage, and many problems need to be solved, for example, standardization of image data format, color balance, resolution level, data compaction, etc., There are many uses of digital histology images: Archiving, research, pathology education,[1,2,3] telepathology,[4,5] and the development of computer-aided diagnosis (CAD) systems.[6,7,8,9,10,11] Except for simple archiving, most computer-processing of histopathological images follow a similar process.[12,13,14,15,16,17] The first step is the standardization of the color balance[18] and resolution. Then, a region of interest (ROI) is selected. Next, an analysis of the image is performed that segments and measures target objects such as nuclei and glands.[10,19,20,21] The accuracy of the segmentation step has a great impact on the accuracy of all subsequent processes, and segmentation itself will be dependent on image quality and standardization. The next step after segmentation is feature measurement. In this step, raw pixel data are changed into quantitative and objective features which can then be used by statistical analysis and/or machine learning techniques. During the measurement process, over one-hundred features may be extracted from each segmented object. Some features have a biological or intuitive meaning such as nucleus size, roundness, contour length, and staining luminance. Some other features, such as fractal dimension or texture features, are difficult to interpret biologically and medically; however, these features have been shown to carry important information for analysis and diagnosis sometimes. In particular, for CAD, the emphasis is often put on the accuracy of final diagnosis, while the interpretability of the features is less important. Conversely, some features commonly used by pathologists may not be used by the computer because they are too subjective and ambiguous in their definition.
In breast cancer grading, the Nottingham Histologic Score system (the Elston-Ellis modification of the Scarff-Bloom-Richardson grading system) is widely used. In that grading system, three factors are scored: Gland formation level, nucleus pleomorphism, and mitotic cell counting. Each factor is scored from one to three for a maximum total score of nine. Gland formation and nucleus pleomorphism are widely used concepts in pathology, not only in breast cancer but also in any other cancer diagnosis. Unfortunately, these features are subjective and consequently the scoring varies among pathologists. Historically, mathematical approaches for tissue section analysis including graph analysis have been conducted since the late 1970s,[22,23] showing that the challenges of analyzing histologic patterns are not new. In this paper, we aim to create quantitative measurement methods for pleomorphism as well as for its close cousin, heterogeneity. The emphasis is on developing a robust and simple technique that can be applied with little computational cost.
Pleomorphism denotes the variability in the size, shape, and texture of cells and/or nuclei in a micro-environmental area. On the other hand, morphological heterogeneity is the difference between micro-environmental areas. Pleomorphism and heterogeneity are not direct measurement concepts such as nucleus size, roundness, and shape, but rather relationship concepts between segmented objects such as texture analysis. For example, in intra-nucleus chromatin texture analysis, the gray-level co-occurrence matrix (GLCM) is a commonly used statistical algorithm.[12,15] In our approach, we use a co-occurrence matrix method, applied to each cell profile data, so our algorithm is named cell feature level co-occurrence matrix (CFLCM). For clinical data analysis, CFLCM provides features that may be combined with other features, such as CellProfiler output data. CFLCM parameters (co-occurrence matrix size, neighborhood search area, etc.) may be adapted to different image conditions or tissue types. The CFLCM method explained in this technical note is easy to implement and provides important features with significant information about the tissue conditions.
MATERIALS AND METHODS
Samples
We analyzed a total of 23 specimens: 20 invasive breast cancer and 3 breast ductal carcinoma in situ (DCIS) obtained from formalin-fixed, paraffin-embedded (FFPE) blocks. All samples were diagnosed and surgically obtained at Shinshu University Hospital. This study was performed according to the Helsinki Declaration and was approved by the Ethics Committee of Shinshu University Hospital.
Tissue preparation and whole slide scanning
All FFPE samples were sectioned with a thickness of 4 μm. After hematoxylin and eosin (H and E) staining according to the standard method, all slides were scanned using a WSI scanner (Nanozoomer 2.0-HT slide scanner; Hamamatsu Corp., Hamamatsu, Shizuoka, Japan) at ×20 and were stored as tag image file format files on a computer system.
Analytical image selection
From the WSI images, several ROI were selected manually for analysis. Each ROI size is 2048 by 2048 pixels, corresponding approximately to 1 mm2. We also create micro-ROIs by splitting evenly each ROI into 9 micro-ROIs, thus extending the analysis to 31 × 9 = 279 ROIs.
Since the main purpose of this paper is to confirm the effectiveness of the CHLCM algorithm, we positioned the ROIs manually at the sites of typical tissue structural areas. One should note that this approach is not suited to deliver quantitative clinical measures of heterogeneity as the size and position of these ROIs strongly influences the statistics of measured features. Algorithms will need to be developed to appropriately select ROIs for given organs, cancer types, and purpose of heterogeneity measure. Such algorithms are beyond the scope of this paper.
Segmentation and cell (nucleus) features measurement
For each ROI image, a nucleus extraction (segmentation) process is performed. For this process, we used two free software programs, “Ilastick,”[24] “Fiji,”[25] as well as our original analysis tool.[26] These software packages each have their own advantages and disadvantages depending on staining and tissue condition; we selected the most reasonable segmentation for each ROI image [Figure 1a and b]. The next step is the creation of a mask image in which all nonnucleus areas are set to zero [Figure 1c] and are multiplied with the original image [Figure 1d]. The resulting masked image is then input into “CellProfiler,”[27] a free software package for quantitative analysis of pathology images, to measure cell features. Note that for stromal cells, areas of lymphocyte invasion are excluded. The original H and E stained images are changed to gray-level and masked images [Supplementary Figure 1a (829.2KB, tif) and b (829.2KB, tif) ]. CellProfiler outputs the image with the nuclei selected for feature measurement, as well as a part of the table of measured features [Supplementary Figure 1c (829.2KB, tif) ]. The features consist of 16 nucleus shape-related features, 12 nucleus texture radius distribution features, 52 GLCM texture features and nucleus position coordinate data.
Figure 1.

Nuclei extraction process: for measuring nuclei features, intermediate images on the computer system are shown. (a) Original H and E image (b) extraction and segmentation of nuclei (c) binary mask image showing inside and outside of nuclei area (d) final masked image for input to CellProfiler nuclei measurements
CellProfiler intermediate images and results. (a) segmented nuclei image (b) marked green nuclei are targets of measurement, marked pink nuclei are ignored (c) CellProfiler measurements of target nuclei
GLCM is a popular texture analysis technique in image analysis. The original image is first converted into a gray level bitmap. Then, for each pixel and for each neighboring pixel (direction), their respective intensity level is measured, and the corresponding co-occurrence entry into a two-dimensional level matrix is incremented [Figure 2a]. The matrix size depends on the number of gray levels considered (for the standard 256 levels, the resulting matrix has a size of 256 × 256). Usually, 4 directions (θ =0, 45, 90, and 135) are considered and a total of 4 co-occurrence matrices are generated [Figure 2b]. Finally, from all co-occurrence matrices, a set of metrics are calculated that are referred to as Haralick features [Supplementary Figure 2 (489.9KB, tif) ].
Figure 2.
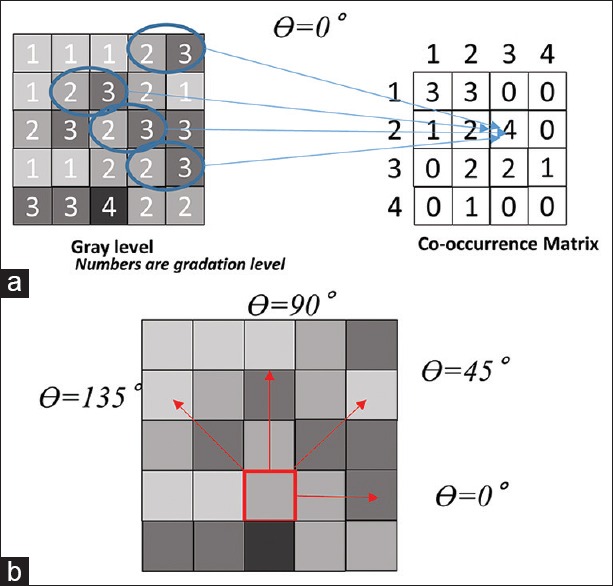
Gray-level co-occurrence matrix: Explanation of gray-level co-occurrence matrix process. (a) From intensity level of gray scale (left) to co-occurrence matrix creation (right) (b) various directions for gray-level co-occurrence matrix measurement
Haralick functions for co-occurrence matrix
Cell feature level co-occurrence matrix
GLCM matrices are obtained from intensity-level co-occurrences between neighboring pixels. We extend this concept to segmented nuclei and propose to measure the co-occurrence of features between neighboring nuclei. We employ three different methods to select the neighboring nuclei: Nearest, circle, and lattice [Figure 3]. The “Nearest” method selects as neighbor the nearest nucleus measured by the Euclidian distance between their centers of gravity [Figure 3a]. When the distance to the nearest nucleus is larger than five times the average nucleus diameter, we define that nucleus as having no neighborhood. With this method, one nucleus is selected as the neighborhood nucleus and this process is performed for all nuclei on the ROI image to create the CFLCM.
Figure 3.

Neighborhood selection methods: Three methods of neighborhood selection, (a) nearest (b) circle and (c) lattice
The “Circle” method selects as neighbors, all nuclei located within a radius of five times the average nucleus long axis [Figure 3b]. The “Lattice” method [Figure 3c] selects as neighbors all nuclei within the same lattice tile. The square lattice is created at intervals of twice the average nuclear long axis. Since both “Lattice” and “Circle” methods obtain several nuclei as neighbors, the averages of their features are used for the CFLCM creation. From each of the three co-occurrence matrices, we calculate the Haralick features as described in Supplementary Figure 2 (489.9KB, tif) .
The results shown here were obtained with a CFLCM co-occurrence matrix size of 256, and 79 features were measured by the following CellProfiler Modules: MeasureObjectsSizeShape, MesureTexture, and MeasureObjectRadialDistribution. From all those features, we selected the following 4: nucleus size, Roundness, GLCM Contrast, and GLCM entropy, because they allow an intuitive understanding the CFLCM results. Regarding for calculation of the Haralick features, we used MATLAB, R2016a.
RESULTS
Testing on artificial patterns and easy case tissues
Before applying to actual case images, we tested the methods with artificially generated patterns emulating the distributions of nucleus sizes. Figure 4 shows two artificially generated images which have the same averages and standard deviations (StdDev) of nucleus area sizes. Figure 4a shows so-called “front formation” patterns that have clear boundaries. Such a pattern is typical for boundaries between two components, such as neoplastic lesions and normal lesions, and it is often used as evidence for the diagnosis. In contrast, Figure 4b is a representative pattern for the center of malignant tissues. Using statistical parameters such as average and StdDev, it is difficult to discriminate between these two patterns. However, CFLCM nearest (contrast) values for nucleus size are 33 and 2065, respectively, for the two patterns, demonstrating the great discriminatory power of this technique. This shows the importance of applying the new method and not just relies on first-order statistical measurements.
Figure 4.
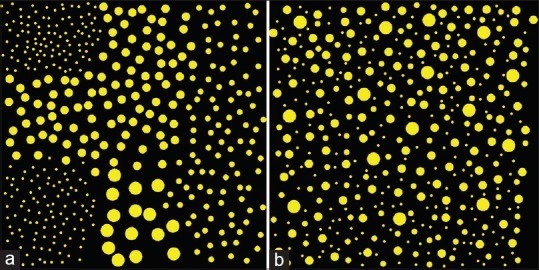
Artificial pattern diagrams: The patterns, which have the same average and standard deviations, exhibit significant differences in cell feature level co-occurrence matrix measurements. (a) Circles of different sizes are distributed according to which 9-sub-square they belong to (b) circles of different sizes are distributed randomly
Figure 5 is a typical sample of invasive breast cancer tissues. Figure 5a is low to intermediate grade and Figure 5b is high-grade pleomorphism. CFLCM nearest (contrast) values for nucleus size are 76.4 and 149.3, respectively. However, CFLCM nearest (contrast) values for roundness are almost the same: 3313.8 and 3252.9, respectively. Figure 5a and b have marked differences of nucleus size but not of roundness. In general, for human eyes, nucleus size pleomorphism and heterogeneity can be detected intuitively, but other parameters such as roundness or intra-nucleus texture-based differences may be difficult to assess.
Figure 5.
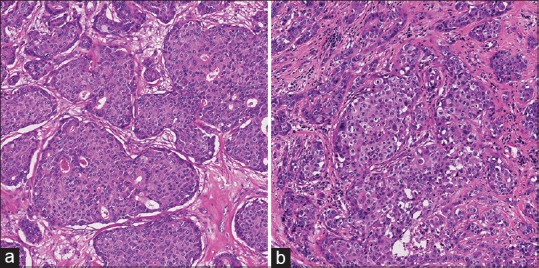
Typical images: Low to intermediate and high grade samples on pleomorphism of breast cancer. (a) Low to Intermediate grade breast cancer (b) high grade invasive breast cancer
Measured data for actual case tissues
At the nuclei level, “CellProfiler” provides 52 features. Applying 3 methods of selecting a neighborhood nucleus (nearest, circle, and lattice) to create 3 CFLCM matrices and extracting 14 Haralick functions from each of them, a total of 52 × 14 × 3 =2,184 pleomorphism and heterogeneity features were generated. We choose to focus on five nuclei-level features: Two morphologic features (nucleus size and nucleus roundness) and 3 GLCM texture features (contrast, homogeneity, and entropy). We also select 4 Haralick functions to extract features from the 3 CFLCM matrices: Second angular moment, contrast, homogeneity, and entropy [f1, f2, f5, and f9, respectively, in Supplementary Figure 2 (489.9KB, tif) ]. This way we consider a set of 5 × 3 × 4 = 60 features.
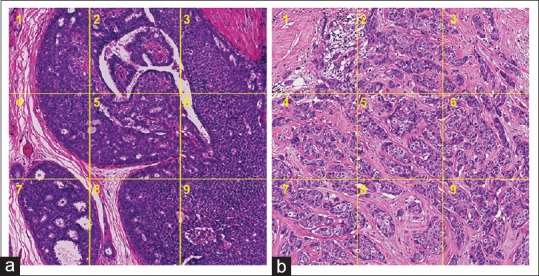
Representative case images for DCIS and Invasive are shown in Figures 6 and 7, respectively. In each figure, (a) shows the selected ROI positions on the WSI image and (b) shows the corresponding selected ROI images. Each ROI size is 2048 × 2048 pixels (corresponding to an area of about 1 mm2). To check micro-environmental pleomorphism and heterogeneity, we split the ROI images into 9 micro-ROI images (size 682 × 682 pixels) [Figure 8].
Figure 6.
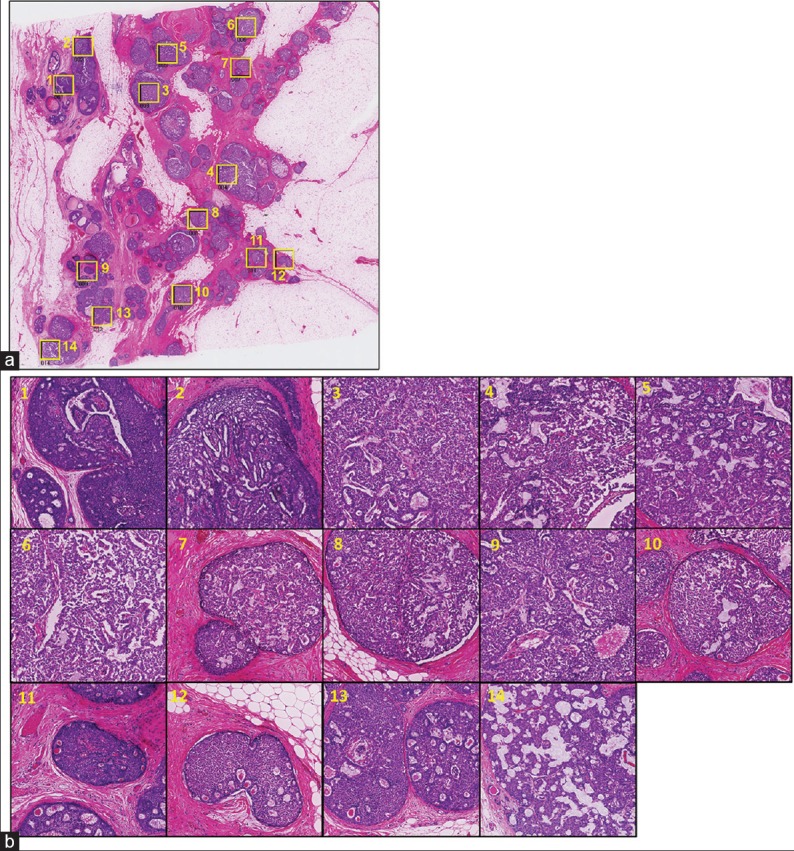
Ductal carcinoma in situ case: Analysis target position map and region of interest images on ductal carcinoma in situ case (a) yellow squares show the selected positions of region of interests (b) the selected region of interests at higher magnification. The numbers on each region of interest correspond to those on image (a)
Figure 7.

Invasive case: Analysis target position map and region of interest images on Invasive case. (a) Yellow squares show the selected positions of region of interests (b) the selected region of interests at higher magnification. The numbers on each region of interest correspond to those on image (a)
Figure 8.
Micro-region of interests: For the purpose of measuring heterogeneity and pleomorphism at a micro-environmental level, we split region of interests evenly into 9 micro-region of interests
Nucleus features average and standard deviation
As an initial statistical evaluation, we analyze the correlation between average and StdDev for several nucleus-level features over a ROI. On Figure 9, we plot the nucleus size for the full size ROIs (top row) and the micro-ROIs (bottom row). In all cases, the nucleus size StdDev is strongly correlated to the nucleus size average. The plots for all morphologic and texture features for both full ROIs and micro-ROIs can be found on Supplementary Figures 3 (1.3MB, tif) and 4 (1.3MB, tif) . For intra-nucleus texture features (GLCM contrast, entropy and homogeneity), StdDev shows weak correlation to its average. However, for roundness (0 is perfect circle, 1 is line shape), StdDev shows a strong negative correlation.
Figure 9.

Nucleus size average versus standard deviation: Measured Average and standard deviation data plot for ductal carcinoma in situ and Invasive cases
average versus standard deviation scatterplots for each full region of interest (2048 × 2048 pixels) (a) nucleus shape features (nucleus size and roundness) (b) Intra-nucleus features gray-level co-occurrence matrix (contrast, entropy and homogeneity)
CellProfiler intermediate images and results. (a) segmented nuclei image (b) marked green nuclei are targets of measurement, marked pink nuclei are ignored (c) CellProfiler measurements of target nuclei
Evaluation of neighborhood selection and feature extraction methods
Figure 10 shows nucleus size pleomorphism/heterogeneity features for the three neighborhood selection methods (nearest, circle, and lattice) based co-occurrence matrix and applied Haralick functions contrast [Supplementary Figure 2 (489.9KB, tif) , f2]. Entropy [Supplementary Figure 2 (489.9KB, tif) , f9] versus StdDev is shown in Supplementary Figure 5 (724.9KB, tif) . Although there are small differences in absolute values, we notice that the CFLCM nearest and CFLCM circle methods produce very similar values. In Table 1, we report the correlation coefficient values for average, StdDev, CFLCM nearest (contrast), CFLCM circle (contrast) and CFLCM lattice (contrast) versus nucleus size, roundness, intra-nucleus texture GLCM (contrast) and intra-nucleus texture GLCM (entropy) on all measured ROIs. Again, we notice that CFLCM nearest and circle show a high correlation for each parameter. Hence, the remaining evaluation will focus on the CFLCM nearest method and using the contrast feature.
Figure 10.

Nucleus size standard deviation versus three methods: Nucleus size standard deviation versus nearest, circle, and lattice method based cell feature level co-occurrence matrix values are plotted
Table 1.
Correlation coefficient: Average, standard deviation and three cell feature level co-occurrence matrix measured correlation matrix values for nucleus size, roundness, gray-level co-occurrence matrix contrast and entropy
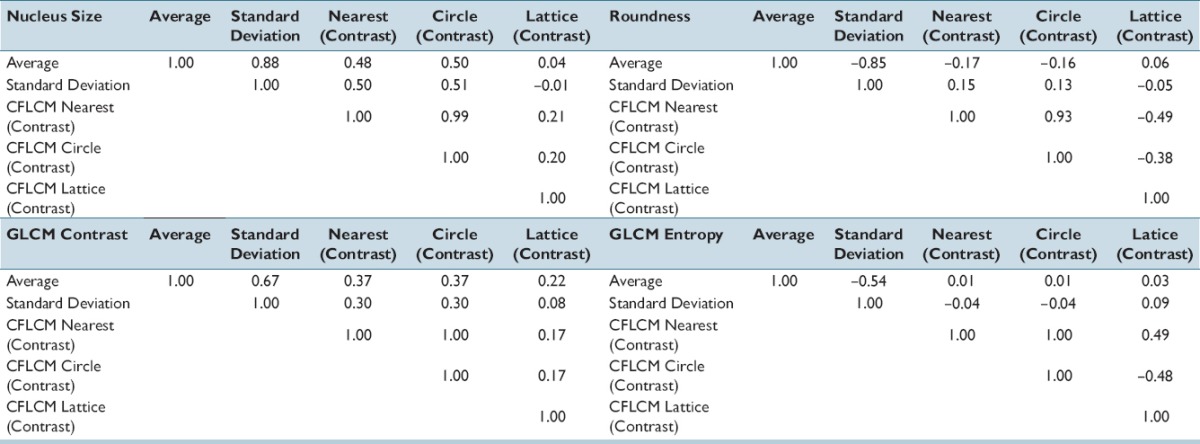
Three neighborhood selection methods by contrast and entropy functions for ductal carcinoma in situ 2048 pixels region of interests
Evaluation of nearest (contrast) features for nucleus shape and intra-nucleus texture data
Figure 11 shows a plot of CFLCM nearest (contrast) feature versus StdDev of nucleus size for invasive breast cancer cases and DCIS cases (2048 pixels-based ROIs). The plot shows that the CFLCM nearest (contrast) feature is able to separate the invasive cases from the DCIS cases almost perfectly, while the nucleus size StdDev is clearly not able to do so. To quantify this result, we perform linear discriminant analysis (LDA) on both features and obtain coefficients of 0.384 for nucleus size StdDev and of 1.487 for the CFLCM nearest contrast feature.
Figure 11.
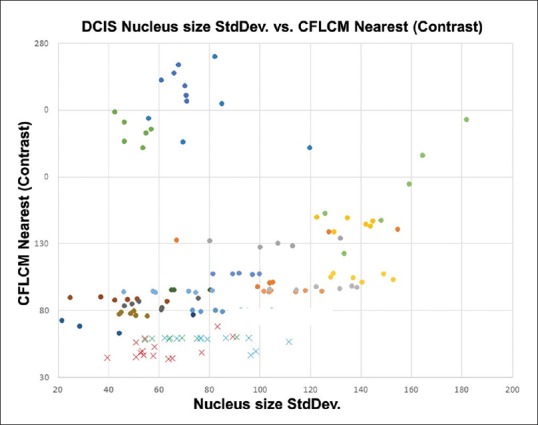
Nucleus size CFLCM nearest (contrast) versus standard deviation: All measured invasive and ductal carcinoma in situ cases data are plotted as a scatter diagram. Standard deviation shows a wide spread for both invasive and ductal carcinoma in situ cases. CFLCM, on the other hand, exhibits a very good separation between invasive and ductal carcinoma in situ cases
The result of LDA showed that the linear discrimination coefficient of StdDev and CFLCM nearest (contrast) values are 0.384 (P = 0.1122) and 1.487 (P < 0.001), respectively. These results mean that StdDev could not discriminate these histological differences sufficiently; on the other hand, our CFLCM method discriminates these histological differences clearly.
DISCUSSION
Digital histopathology's merits are preservability, shareability, but most of all it is changing diagnosis from subjective to quantitative and objective. However, there are differences between computer measured features and those of a pathologist. Computer-measured features are direct, objective reflection of measured data (e.g. a nucleus area is 250 pixels), while the pathologist's features are product of her observations and past experience, making them more relative and subjective in nature. Furthermore, the definition of some widely used pathological features is often ambiguous. For example, the agreement among pathologists for the pleomorphism feature of the Nottingham criteria for breast cancer has been shown to be relatively low.[28]
Cancer tissues have some heterogeneity. Higher heterogeneity cases can lead to poor prognosis and lead to drug resistance.[29,30] Recent publications show that heterogeneity is no longer only understood to be a morphological finding, but they extend the concept to include genetic heterogeneity based on next generation sequencer data,[31] and phenotypic heterogeneity determined by immunohistochemistry staining.[32] Gerlinger et al. provided evidence of genetic intra-tumor heterogeneity of renal carcinomas based on multi-region genetic analysis.[33] In results of comprehensive molecular analysis of human breast tumors, authors demonstrated the existence of four main breast cancer classes and hypothesized that heterogeneity occurs within the major biological subtypes of breast cancer.[34] Morphological heterogeneity is an important piece of the puzzle, even if often described by pathologists with unprecise words such as “ugly” or “tidy,” because the traditional morphological analysis approach to pathology diagnosis can connect molecular big data analysis with clinical diagnosis. In this study, we describe an objective measurement method for morphological heterogeneity and hope it will help shine some quantitative light on this very subjective feature. When creating diagnosis assistance systems, reducing false positive and false negative rates are primary concerns. However, providing assistance to the pathological thinking process is also a key factor. Using the novel approach of CFLCM, we quantify a concept derived from pathologists’ accumulated experience, making it objective and measurable.
We consider several levels of heterogeneity: Inter-case, intra-case, and micro-environmental. A higher CFLCM nearest (contrast) value means higher heterogeneity. However, inter-case heterogeneity should be compared with a range of ROIs because each case has its own baseline measurement value. Intra-case heterogeneity is obtained by comparing ROIs of the same case, for example, in the DCIS case, ROIs number 1, 2, and 9 show larger heterogeneity values. Heterogeneity is a comparative concept while the detection of outlier ROIs is a simple classification task. Micro-environmental heterogeneity (internal heterogeneity of one fixed area ROI) is shown in Figure 8, DCIS #1 and Invasive #1 ROI [Figures 6 and 7, respectively] each with 9 micro-ROIs. DCIS #5 micro-ROI, and invasive case #1 micro-ROI show large heterogeneity and both areas contain necrotic tissue. A wide variation of micro-environmental heterogeneity values within a ROI is a robust indication of high heterogeneity.
We have presented a method for the objective measurement of pleomorphism and/or heterogeneity. Our method is simple and effective; furthermore, the implementation and running costs are very small. However, many important factors remain to be studied. Selecting a ROI size, position and/or what kind of nucleus feature (nucleus size, roundness, or intra-nucleus texture, etc.) are used for analysis are crucial issues. For the human eye, nucleus size based pleomorphism/heterogeneity can be evaluated intuitively, but other parameters such as intra-nucleus texture are extremely difficult to evaluate. Our method shows that several nuclear features can be used to compute pleomorphism/heterogeneity features. Recent developments in digital pathology include many quantitative analysis techniques. However, most software and tools are using first order statistics of nuclei morphology, making these approaches similar to cytological analysis. Pathological tissue samples contain a lot more information than first-order measurements from nuclei. The relation between a nucleus and its neighboring nuclei contains important information and we provide in this paper a way to quantify it. Many challenges remain to be solved; in particular, the accuracy of the underlying nuclei segmentation is a fundamental problem. The selection of the nuclei features for our CFLCM approach is also an issue that deserves more study. Finally, the power of our CFLCM features needs to be further established by a larger clinical study. However, we believe this work to be an important first step in establishing the usefulness of quantitative heterogeneity features.
Financial support and sponsorship
This work was supported by JSPS KAKEN Grant Number JP15K18428.
Conflicts of interest
There are no conflicts of interest.
Footnotes
Available FREE in open access from: http://www.jpathinformatics.org/text.asp?2016/7/1/36/189699
REFERENCES
- 1.Leifer Z. The use of virtual microscopy and a wiki in pathology education: Tracking student use, involvement, and response. J Pathol Inform. 2015;6:30. doi: 10.4103/2153-3539.158063. [DOI] [PMC free article] [PubMed] [Google Scholar]
- 2.Brochhausen C, Winther HB, Hundt C, Schmitt VH, Schömer E, Kirkpatrick CJ. A virtual microscope for academic medical education: The pate project. Interact J Med Res. 2015;4:e11. doi: 10.2196/ijmr.3495. [DOI] [PMC free article] [PubMed] [Google Scholar]
- 3.Dee FR. Virtual microscopy in pathology education. Hum Pathol. 2009;40:1112–21. doi: 10.1016/j.humpath.2009.04.010. [DOI] [PubMed] [Google Scholar]
- 4.Farahani N, Pantanowitz L. Overview of telepathology. Surg Pathol Clin. 2015;8:223–31. doi: 10.1016/j.path.2015.02.018. [DOI] [PubMed] [Google Scholar]
- 5.Krupinski EA. Virtual slide telepathology workstation of the future: Lessons learned from teleradiology. Hum Pathol. 2009;40:1100–11. doi: 10.1016/j.humpath.2009.04.011. [DOI] [PMC free article] [PubMed] [Google Scholar]
- 6.Veta M, Kornegoor R, Huisman A, Verschuur-Maes AH, Viergever MA, Pluim JP, et al. Prognostic value of automatically extracted nuclear morphometric features in whole slide images of male breast cancer. Mod Pathol. 2012;25:1559–65. doi: 10.1038/modpathol.2012.126. [DOI] [PubMed] [Google Scholar]
- 7.Kiyuna T, Saito A, Marugame A, Yamashita Y, Ogura M, Cosatto E, et al. Automatic classification of hepatocellular carcinoma images based on nuclear and structural features. Proc SPIE. 2013 8676,86760Y-1. [Google Scholar]
- 8.Aziz MA, Kanazawa H, Murakami Y, Kimura F, Yamaguchi M, Kiyuna T, et al. Enhancing automatic classification of hepatocellular carcinoma images through image masking, tissue changes and trabecular features. J Pathol Inform. 2015;6:26. doi: 10.4103/2153-3539.158044. [DOI] [PMC free article] [PubMed] [Google Scholar]
- 9.Dong F, Irshad H, Oh EY, Lerwill MF, Brachtel EF, Jones NC, et al. Computational pathology to discriminate benign from malignant intraductal proliferations of the breast. PLoS One. 2014;9:e114885. doi: 10.1371/journal.pone.0114885. [DOI] [PMC free article] [PubMed] [Google Scholar]
- 10.Kowal M, Filipczuk P. Nuclei segmentation for computer-aided diagnosis of brest cancer. Int J Appl Math Comput Sci. 2014;24:19–31. [Google Scholar]
- 11.Dalle JR, Leow WK, Racoceanu D, Tutac AE, Putti TC. Automatic breast cancer grading of histopathological images 2008. 2008:3052–5. doi: 10.1109/IEMBS.2008.4649847. [DOI] [PubMed] [Google Scholar]
- 12.Gurcan MN, Boucheron LE, Can A, Madabhushi A, Rajpoot NM, Yener B. Histopathological image analysis: A review. IEEE Rev Biomed Eng. 2009;2:147–71. doi: 10.1109/RBME.2009.2034865. [DOI] [PMC free article] [PubMed] [Google Scholar]
- 13.Ghaznavi F, Evans A, Madabhushi A, Feldman M. Digital imaging in pathology: Whole-slide imaging and beyond. Annu Rev Pathol. 2013;8:331–59. doi: 10.1146/annurev-pathol-011811-120902. [DOI] [PubMed] [Google Scholar]
- 14.Bourzac K. Software: The computer will see you now. Nature. 2013;502:S92–4. doi: 10.1038/502s92a. [DOI] [PubMed] [Google Scholar]
- 15.Bhattacharjee S, Mukherjee J, Nag S, Marita I, Bandyopadhyay SK. Review on histopathological slide analysis using digital microscopy. Int J Adv Sci Technol. 2014;62:65–96. [Google Scholar]
- 16.Saito A, Cosatto E, Kiyuna T, Sakamoto M. Dawn of the digital diagnosis assisting system, can it open a new age for pathology? Proc SPIE. 2013 8676,867602-1. [Google Scholar]
- 17.Mousavi HS, Monga V, Rao G, Rao AU. Automated discrimination of lower and higher grade gliomas based on histological image analysis. J Pathol Inform. 2015;6:15. doi: 10.4103/2153-3539.153914. [DOI] [PMC free article] [PubMed] [Google Scholar]
- 18.Murakami Y, Abe T, Hashiguchi A, Yamaguchi M, Saito A, Sakamoto M. Color correction for automatic fibrosis quantification in liver biopsy specimens. J Pathol Inform. 2013;4:36. doi: 10.4103/2153-3539.124009. [DOI] [PMC free article] [PubMed] [Google Scholar]
- 19.Veta M, van Diest PJ, Kornegoor R, Huisman A, Viergever MA, Pluim JP. Automatic nuclei segmentation in H and E stained breast cancer histopathology images. PLoS One. 2013;8:e70221. doi: 10.1371/journal.pone.0070221. [DOI] [PMC free article] [PubMed] [Google Scholar]
- 20.Sertel O, Lozanski G, Shana’ah A, Gurcan MN. Computer-aided detection of centroblasts for follicular lymphoma grading using adaptive likelihood-based cell segmentation. IEEE Trans Biomed Eng. 2010;57:2613–6. doi: 10.1109/TBME.2010.2055058. [DOI] [PMC free article] [PubMed] [Google Scholar]
- 21.Irshad H, Veillard A, Roux L, Racoceanu D. Methods for nuclei detection, segmentation, and classification in digital histopathology: A review-current status and future potential. IEEE Rev Biomed Eng. 2014;7:97–114. doi: 10.1109/RBME.2013.2295804. [DOI] [PubMed] [Google Scholar]
- 22.Prewitt JM. Graphs and grammars for histology: An introduction. Proc Annu Symp Comput Appl Med Care. 1979;17:18–25. [Google Scholar]
- 23.Preston K., Jr Tissue section analysis: Feature selection and image processing. Pattern Recognit. 1981;13:17–36. [Google Scholar]
- 24. [Last accessed on 2016 Aug 08]. Available from: http://www.ilastik.org/
- 25. [Last accessed on 2016 Aug 08]. Available from: http://www.fiji.sc/Fiji .
- 26.Malon C, Cosatto E. Dynamic Radial Contour Extraction by Splitting Homogenous Areas, CAIP Part I, LNCS 6854. Germany: Springer; 2011. pp. 269–77. [Google Scholar]
- 27. [Last accessed on 2016 Aug 08]. Available from: http://www.cellprofiler.org/
- 28.Malon C, Brachtel E, Cosatto E, Graf HP, Kurata A, Kuroda M, et al. Mitotic figure recognition: Agreement among pathologists and computerized detector. Anal Cell Pathol (Amst) 2012;35:97–100. doi: 10.3233/ACP-2011-0029. [DOI] [PMC free article] [PubMed] [Google Scholar]
- 29.Mroz EA, Tward AD, Hammon RJ, Ren Y, Rocco JW. Intra-tumor genetic heterogeneity and mortality in head and neck cancer: Analysis of data from the cancer genome atlas. PLoS Med. 2015;12:e1001786. doi: 10.1371/journal.pmed.1001786. [DOI] [PMC free article] [PubMed] [Google Scholar]
- 30.Cooke SL, Temple J, Macarthur S, Zahra MA, Tan LT, Crawford RA, et al. Intra-tumour genetic heterogeneity and poor chemoradiotherapy response in cervical cancer. Br J Cancer. 2011;104:361–8. doi: 10.1038/sj.bjc.6605971. [DOI] [PMC free article] [PubMed] [Google Scholar]
- 31.Vogelstein B, Papadopoulos N, Velculescu VE, Zhou S, Diaz LA, Jr, Kinzler KW. Cancer genome landscapes. Science. 2013;339:1546–58. doi: 10.1126/science.1235122. [DOI] [PMC free article] [PubMed] [Google Scholar]
- 32.Potts SJ, Krueger JS, Landis ND, Eberhard DA, Young GD, Schmechel SC, et al. Evaluating tumor heterogeneity in immunohistochemistry-stained breast cancer tissue. Lab Invest. 2012;92:1342–57. doi: 10.1038/labinvest.2012.91. [DOI] [PubMed] [Google Scholar]
- 33.Gerlinger M, Rowan AJ, Horswell S, Larkin J, Endesfelder D, Gronroos E, et al. Intratumor heterogeneity and branched evolution revealed by multiregion sequencing. N Engl J Med. 2012;366:883–92. doi: 10.1056/NEJMoa1113205. [DOI] [PMC free article] [PubMed] [Google Scholar]
- 34.Cancer Genome Atlas Network. Comprehensive molecular portraits of human breast tumours. Nature. 2012;490:61–70. doi: 10.1038/nature11412. [DOI] [PMC free article] [PubMed] [Google Scholar]
Associated Data
This section collects any data citations, data availability statements, or supplementary materials included in this article.
Supplementary Materials
CellProfiler intermediate images and results. (a) segmented nuclei image (b) marked green nuclei are targets of measurement, marked pink nuclei are ignored (c) CellProfiler measurements of target nuclei
Haralick functions for co-occurrence matrix
average versus standard deviation scatterplots for each full region of interest (2048 × 2048 pixels) (a) nucleus shape features (nucleus size and roundness) (b) Intra-nucleus features gray-level co-occurrence matrix (contrast, entropy and homogeneity)
CellProfiler intermediate images and results. (a) segmented nuclei image (b) marked green nuclei are targets of measurement, marked pink nuclei are ignored (c) CellProfiler measurements of target nuclei
Three neighborhood selection methods by contrast and entropy functions for ductal carcinoma in situ 2048 pixels region of interests