Abstract
The pattern of myelination over the cerebral cortex, termed myeloarchitecture, is an established and often-used feature to visualize cortical organization with histology in a variety of primate species. In this paper, we use in vivo magnetic resonance imaging (MRI) and advanced image processing using surface rendering to visualize and characterize myeloarchitecture in a small non-human primate, the common marmoset (Callithrix jacchus). Through images made in four female adult marmosets, we produce a representative 3D map of marmoset myeloarchitecture and flatten and annotate this map to show the location and extent of a variety of major areas of the cortex, including the primary visual, auditory, and somatosensory areas. By treating our MRI data as a surface, we can measure the surface area of cortical areas and we present these measurements here to summarize cortical organization in the marmoset.
Keywords: magnetic resonance imaging, brain mapping, cortex, myelin, primate
Introduction
Magnetic resonance imaging (MRI) is widely used in studies of the brain. This is because it is an in vivo imaging modality that produces excellent contrast between different tissues of the nervous system. MRI is an inherently three-dimensional (3D) imaging technique, so that images show the shape and spatial relationships of features over the entire brain, free of distortion. With proper image processing, a wide range of metrics can be used to characterize neuroanatomy, including the volume and location of structures1, patterns of folding in the cortex2, and cortical thickness3. With functional MRI (fMRI) it is also possible to map the function of areas of the brain over the underlying neuroanatomy.
MRI is primarily used in human brain mapping studies, where the availability of histological data is limited to post-mortem cases. However, it is gaining ground in animal studies, especially in rare or protected species like non-human primates where the ability to image neuroanatomy in vivo precludes sacrificing the animal and allows repeated data acquisition throughout its lifetime, enabling longitudinal investigations to be carried out. For instance, several groups (ours included) use MRI to study neuroanatomy in the brains of common marmosets (Callithrix jacchus), which are small, New World monkeys. 4,5,6 Recently, transgenic marmosets have been produced7, opening up the possibility of genetic studies of brain organization in primates. The ability to follow brain anatomy and function non-invasively with MRI on necessarily limited numbers of transgenic marmosets is crucial to the feasibility of such studies.
While human and animal anatomical MRI gives good spatial information and contrast over the entire brain at the level of gross neuroanatomy, the cortex tends to appear as a homogenous gray sheet. This does disservice to the rich detail seen in cortical substructure with histology. While there have been initial MRI studies in live rodents to visualize the layered structure of the cortex based on its cytoarchitecture using contrast agents8 or specialized MRI pulse sequences9, the images require a very high resolution (<100 μm) to resolve the different layers. The cortex is a unique structure in that its thickness is largely preserved across species. Unfortunately, the attainable resolution of MRI becomes worse as brain size increases; thus, it is not possible to adequately visualize cortical layers in larger brains in vivo with current MRI and work in this direction is limited to rodents.
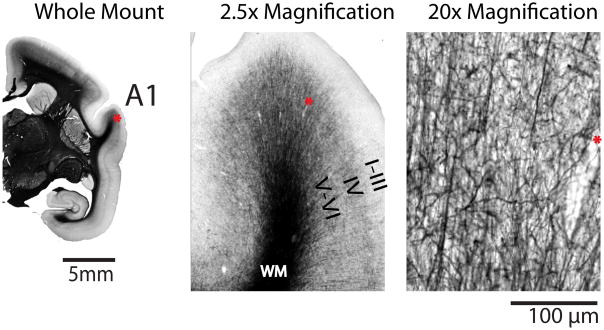
There is anotheranatomical feature of the cortex, however, that can be used to visualize its organization with MRI: myelination. Although most myelin in the brain is located in discrete white matter tracts that connect gray matter areas, a significant amount resides in small bundles of fibers within the layers of the cortical gray matter that run either parallel or perpendicular to the cortical sheet (see Figure 1 for representative histology from a marmoset). Several classical10,11 and contemporary histology studies12,13 have identified specific cortical areasin humans on the basis of this so-called myeloarchitecture and in many primate species, histology can readily identify the major primary sensory areas of the brain (visual, auditory, and somatosensory) by their high myelin content relative to surrounding areas. For this reason, it is desirable to visualize myeloarchitecture: both on its own to study cortical organization in various species, and to complement information derived from other forms of histology and functional studies.
Figure 1.
Representative cortical myelination in the marmoset. A 40 μm-thick coronal histological section stained for myelin using a modified Gallyas silver staining method. At the whole mount level of magnification showing half of the brain, distinct dense areas of staining are seen which correspond to specific cortical areas (for example, the primary auditory cortex (A1)). At 2.5 times magnification, dark stained fibres can been seen running vertically from the white matter (WM) through Layers VI and V. At 20 times magnification in Layer IV, the fibres are arborized and vertical and horizontal stained branches can be seen. There is little myelin staining through Layers III -I. The same pattern is seen in other myelinated areas of the marmoset cortex, save for the primary visual cortex (V1) where the density of myelination is highest in Layer IV (the Stripe of Gennari). The asterix denotes the same blood vessel at each magnification.
MRI is sensitive to myelin and this sensitivity is widely used to generate contrast between gray and white matter structures in the brain. This leads to the intriguing possibility that myeloarchitecture can be imaged with MRI. In fact, it has been shown that MRI can identify specific human cortical areas with a high myelin content in vivo at standard clinical image resolutions (for example the primary visual14,15,16 and auditory cortices17). These studies are greatly aided by the fact that myelination persists through several layers of the cortical depth so that patterns in myelination over the cortical surface can be resolved at a lower image resolution than patterns in the cortical layering based on cytoarchitecture can. We should note here that we are referring to detecting cortical myelin based on its changing the relaxation properties of tissue. There is another MRI technique called diffusion tensor image (DTI) that is used to visualize and follow major white matter features in the brain that is based on the preferential diffusion of water along the direction of axonal tracts18. There is probably too little myelin present in the cortex to produce sensitive DTI measures.
To date, human MRI studies of myeloarchitecture have been localized to specific cortical areas. In a previous paper19, we showed that we could in fact image the entire pattern of cortical myelination in living common marmosets (Callithrix jacchus) using whole-brain 3D MRI. The contrast in these images was based on longitudinal relaxation time, or T1, a commonly used MRI parameter for anatomical brain imaging. In that paper, we roughly visualized the pattern of myeloarchitecture over the cortex using volume rendering. Here, we show how image processing based instead on surface rendering can robustly visualize the pattern of myeloarchitecture over the cortex in marmosets and allow for this pattern to be quantified through measurements of surface area. We have imaged four female marmosets and created a representative 3D map of cortical organization in one individual and flattened and annotated this map. As well, we use surface areas measurements across all four marmosets to quantitatively summarize the major features of the marmoset cortex.
Methods
Animal Methods
All experiments were approved by the NINDS Animal Care and Use Committee. Experiments were carried out in four female common marmosets: two three-year old young adults, and two eight-year old middle aged monkeys20. The first were young adults, whereas the latter were already approaching middle age, when most of the developmental changes in the cortex are well and truly over. Marmosets were housed two to a cage with a twelve-hour light/dark cycle on an ad libitum diet of Zupreem canned marmoset food, Purina 5040 biscuits, unfiltered water, P.R.A.N.G. rehydrator, and fruit and vegetable treats.
On the day of each marmoset's MRI experiment, the animal was fasted for 12 hours, then retrieved from its cage and transported to the MRI laboratory. It was sedated with an intramuscular injection of 10 mg/kg ketamine and placed in a prone sphinx-like position on an MRI-compatible cradle. The animal's head was fixed to a stereotaxic frame with blunted earpieces placed in the ear canals after application of 2% lidocaine as a topical analgesic. The animal was allowed to breathe freely, and was anesthetized through a nose cone with isoflurane in a 2:2:1 mixture of medical air, nitrogen, and oxygen. Throughout the MRI session, the isoflurane concentration was varied around 2% to maintain anaesthesia, which was monitored by end tidal CO2, heart rate, and SPO2 using a capnograph and pulse oximeter (Surgivet, Waukesha, WI, USA). Rectal temperature was continuously monitored and the body temperature was maintained at 38.5 °C with a water heating pad.
MRI
MRI was performed on a 7T/30 cm MRI scanner (Bruker Biospin Corp., Ettlingen, Germany) equipped with a 15 cm gradient set of 450 mT/m strength (Resonance Research Inc., Billerica, MA, USA). A custom-built 16-rung high pass birdcage radiofrequency coil with a 12 cm inner diameter was used for transmission, and a four-element phased-array receiver coil (Bruker Biospin) for reception. The elements of the receiver coil were arranged in a 2 by 2 array of 5 cm by 5 cm dimensions. The inner surface of the coil was slightly curved and was placed directly on top of the marmoset's head, approximately centered over the parietal cortex.
High resolution 3D T1-weighted imaging was performed over the whole brain using a magnetization-prepared rapidly-acquired gradient echo (MP-RAGE) pulse sequence with centric phase encoding (Inversion time = 1200 ms, TE = 4 ms, TR = 12.5 ms, Flip Angle = 12 degrees, FOV = 42.0 × 42.0 × 21.0 mm, Matrix = 256 × 256 × 128, Number of segments = 4, Segment delay = 6000 ms, Number of averages = 1). This produced an isotropic resolution of 164 μm in about 51 minutes. The sequence was previously optimized to produce intracortical contrast in the marmoset at 7 Tesla19. B1 inhomogeneities were corrected using a reference image method 21. Marmosets were imaged with three averages in two imaging sessions on separate days and recovered after each session. The resulting images were co-registered via an affine transformation and averaged in Amira (Visage Imaging Inc., Tewksbury, MA, USA).
Image Processing
The resulting 3D image from each marmoset was processed with the goal of visualizing the T1-weighted MRI enhancement pattern over the cortical surface. First, the entire cortex was segmented as a 3D volume in Amira using intensity thresholding followed by manual correction of the volume's outside border. The outside of this volume represented the outer surface of the cortex. The volume was then repeatedly morphologically eroded in 3D by one voxel in each direction until the outside lay in the strongest T1 enhancing layers in the cortex. The correct location of the outside of the volume at this middle depth in the cortex was confirmed by eye.
Next, a digital surface was computed in Amira from the eroded volume. This surface consisted of a series of vertices (or points) in space through the middle depth of the cortex that defined triangles to be used by rendering routines for display. To visualize the MRI enhancement on this surface, we first smoothed our 3D image using a 3 × 3 × 3 Gaussian kernel (σ= 0.4), then mapped the intensity from this image at the location of each triangle onto that triangle in the surface. By smoothing the original 3D image, the intensity mapped to each triangle over the surface represented the intensity sampled through a depth of cortex, rather than the intensity exactly at the level of the triangle in the cortex.
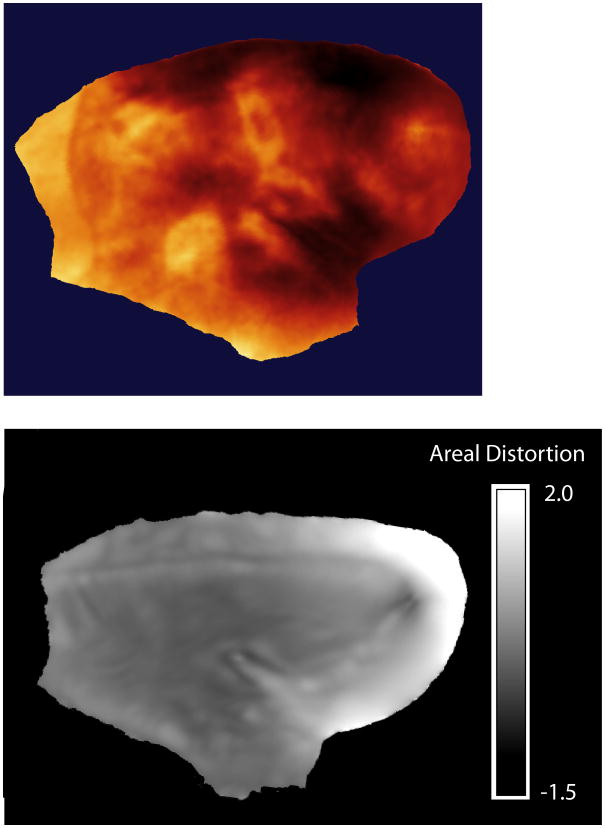
The resulting maps were viewed in Amira in 3D using surface rendering routines. Additionally, one representative map was flattened so the entire cortical surface could be visualized in a single view. For this, we trimmed our digital surface to remove the ventral cortex and the majority of the occipital cortex. We trimmed the occipital cortex because the curvature in the calcarine sulcus was too great relative to the overall curvature of the cortex for proper flattening and would have introduced extreme distortions in our flattened image. This is a problem specific to the marmoset because the calcarine sulcus is such a major cortical feature; in humans, where the calcarine is a more minor feature, the occipital cortex can be flattened well and displayed. We exported our trimmed surface to Caret, a software system for flattening22. The surface was flattened using an initial inflation operation, followed by conversion of the surface to a sphere, then the projection of the sphere to a flat surface. Distortions in the resulting surface were reduced using the multi-resolution morphing operation in Caret (although the resulting flattened surface is still distorted – see Supplementary Figure 1). Finally, the flattened surface was imported back into Amira, where the 3D MRI intensity data corresponding to the location of triangles on the original surface were mapped to the corresponding triangles in the flattened surface for visualization.
Surface Area Measurements
To avoid errors in surface area measurements introduced by distortion during the flattening process, we made all of our surface area measurements over the four marmosets in the 3D maps. We defined areas of the cortex based on intensity in the map using labeling tools in Amira, then summed the areas of the triangles in the surface underlying each map to estimate overall surface areas.
Results
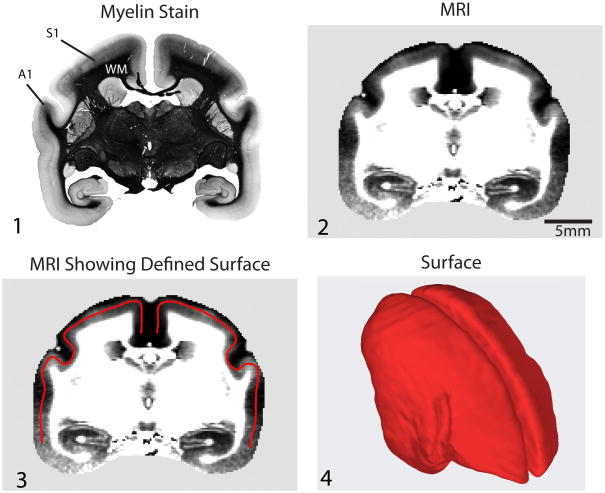
In Figure 2, we show a myelin-stained histological coronal section from an excised marmoset brain and a corresponding section at the same level from one of our in vivo 3D MRIs. The contrast between gray and white matter in the T1-weighted MRI is much higher than is typically seen in MRIs of the brain because we have optimized the imaging sequence to highlight the subtle T1differences. This increased contrast results in enhancements in the MRI in the cortex which spatially correspond to areas of high myelination seen on the histology. In our previous paper, we showed there were similar MRI enhancements in all major myelinated areas in the marmoset cortex19. This suggests that our intracortical contrast is generated mainly by myelin, although more experiments are needed to verify this as mentioned below in the Discussion. Viewing the enhancement pattern in serial views from the 3D MRI only gives a vague sense of the pattern of myelination over the marmoset cortex; thus, we process the images to show them as surfaces. A similar approach called flat-mounting is often used in histology studies where the cortex is flattened prior to sectioning and staining to better show the distribution of stained areas over the surface of the cortex.
Figure 2.
Image Processing. A 40 μm-thick representative coronal histological section stained for myelin (Panel 1) and a matching 165 μm thick corresponding T1-weighted MRI section from a 3D image (Panel 2). The density of myelination is generally highest in a middle depth of the cortex (around Layer VI); thus, we define our surface at this depth (Panel 3). The 3D surface over the entire cortex at a middle depth is shown using surface rendering (Panel 4). The final step in our processing is to project the local MRI image intensity onto this surface to make a map.
The first step in our processing is to digitally define a surface at a middle depth throughout the entire cortex (Figure 2). The local MRI intensity data is then projected on this surface to make a map. The intensity at each point on the map is actually a sample of the MRI intensity over several cortical layers (see Methods) rather than the intensity exactly at the middle depth of the cortex. In this way, our map differs from those made in traditional flat-mounting, where only the myelination pattern at the exact cortical depth the cut was made at is represented. This hopefully reduces variability in our maps versus those made from flat mounts, although it may also slightly blur out fine detail in the myeloarchitecture.
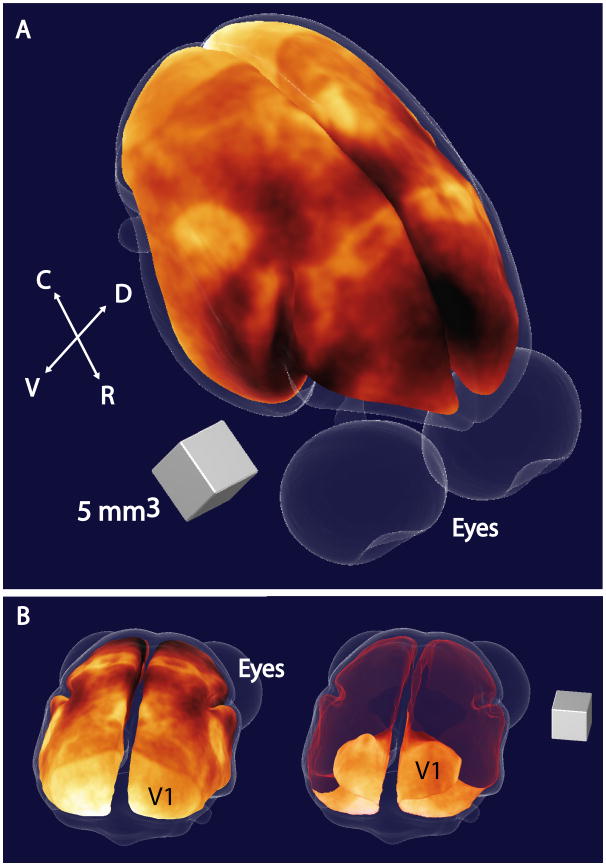
We can display ourmap in 3D using rendering techniques (Figure 3). This presentation is useful for seeing the spatial relationship between areas in the in vivo conformation. On a computer screen, the image is dynamic and can be rotated, as can a global map of the Earth and this is in fact the best way to view surface data free of distortions. This is demonstrated in Figure 3 where we have rotated the map by 180 degrees to show the extent of the primary visual cortex (V1) over the dorsal surface of the occipital cortex and into the calcarine fissure.
Figure 3.
3D map of myeloarchitecture in a representative 3-year old female common marmoset. The figure shows a view of a 3D map of the cortex in a marmoset centered on the dorsal parietal cortex (Panel 1). Here, the MRI intensity data is displayed using a hot colourmapto highlight contrast and areas of enhancement represent cortical areas with high myelin contents. The map is placed at a middle depth in the cortex, and the surface corresponding to the outside of the cortex is shown in light transparent blue. By rotating the map to a view centered on the occipital cortex (Panel 2), we can better see the primary visual cortex (V1) and by making the dorsal surface of our map transparent (shown in red), we can see the extension of V1 into the calcarine fissure. (C = caudal, R = rostral, V = ventral, D = dorsal)
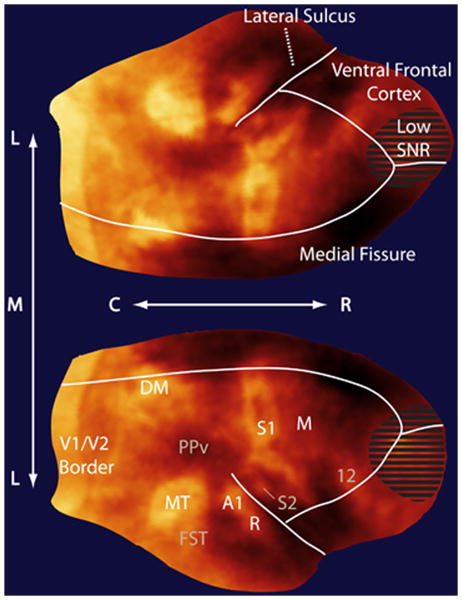
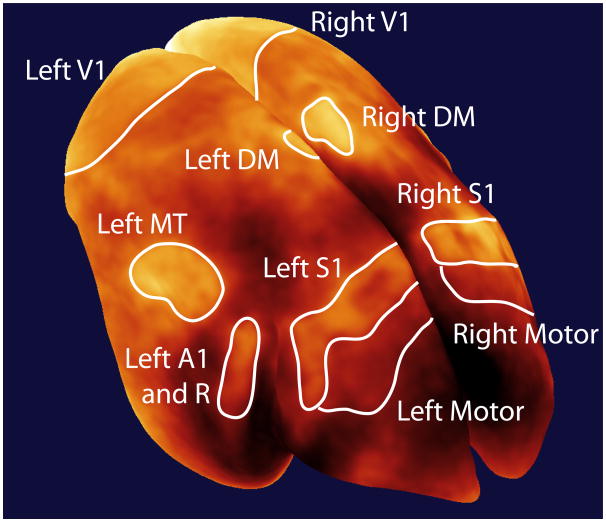
The map can also be digitally flattened to show the entire cortex in a single image (Figure 4). While flattening introduces spatial distortions over cortex, it is useful for producing images that are suited to print presentation and also reveals cortical areas that may be obscured by cortical folding. Even in the marmoset, which has the lowest degree of cortical folding of all the primates23, flattening is useful to see obscured structures such as the secondary somatosensory cortex (S2), which is found in the medial bank of the lateral sulcus. Since the flattened map shows all enhancing cortical areas, we have chosen to annotate this presentation to summarize myeloarchitecture in the common marmoset.
Figure 4.
Flattened map of myeloarchitecture in a representative 3-year old female common marmoset. The dorsal cortical surface from the map in Figure 3 is flattened with the major enhancing areas labeled. Note that the flattening produces spatial distortions in the surface (see Supplemental Figure 1 for details); however, the flattening allows for easier visualization of cortical features and their spatial relationships. “Low SNR” denotes an MRI artifact where poor radiofrequency coil coverage led to a non-specific image enhancement. This was because the RF coil did not provide coverage rostrally completely to the frontal pole This distinct area of low SNR was readily apparent during our corrections for B1 inhomogeneity in the images.(C = caudal, R = rostral, L = lateral, M = medial). (Major myelinated cortical areas are labeled in white: V1 = primary visual area, MT = middle temporal area, A1 = primary auditory area, R = rostral auditory area, S1 = primary somatosensory cortex, M = motor cortex including primary and premotor areas and the frontal eye fields). (Cortical features are labeled in gray: DM = dorsomedial area, PPv = ventral posterior parietal cortex, FST = fundus of the superior temporal area, S2 = secondary somatosensory cortex, PV= parietal ventral area, 12 = area 12).
Several major cortical areas are immediately visible as enhancements in the flattened map and we have labeled these enhancing areas with reference to the literature on myeloarchitecture. For an area to be identified in our map, there must be contrast between it and surrounding areas. We have avoided annotating areas whose borders are not readily observed in our images, as these definitions would be arbitrary. We also do not annotate areas that cannot be identified based on myeloarchitecture alone. To comprehensively show cortical organization in the marmoset, such as in an atlas, it would be better to show a composite map derived from myeloarchitecture, other forms of histology, and functional studies.
Three primary sensory areas are readily identified in the map: the primary visual (V1)24,25, auditory (A1)26,27, and somatosensory (S1)28 cortices. The border between V1 and the secondary visual cortex (V2) is readily delineated since the density of myelin throughout the layers of V2 is far lower than in V1. In the map, we do not show the entire extent of V1 over the occipital cortex because of difficulties flattening the calcarine fissure without introducing widespread distortions in the rest of the cortex. The rostral border of V2 is not discernable in our map because there is not a great enough difference in myelination between V2 and adjoining rostral areas. The extent of V2 is traditionally visualized using cytochrome oxidase staining29, rather than myelin staining, and our inability to delineate V2 in our map shows the limitation of describing cortical organization based on only one contrast mechanism.
Further along in the rostral direction in Figure 4, we can clearly see A1 in the dorsal temporal cortex, extending into the lateral sulcus. Continuous with A1 is another myelinated auditory area, the rostral auditory area (R). The other primary sensory region, S1, is seen as the dog leg structure in the parietal cortex. Within the medial wall of the lateral sulcus, S228 can also be seen. This is continuous with another myelinated region, the parietal ventral area (PV)28.
The two other major enhancing areas in our map are extrastriate visual areas: the middle temporal (MT)30 and dorsomedial (DM)31 areas. MT is readily identified by its kidney-like shape and ventral and anterior to MT is an enhancing area corresponding to the fundus of the superior temporal area (FST)32. The shape and extent of DM is not well defined in the literature based on its myelination; however, it has strong enhancement and we have labeled it in our map although its actual borders are indistinct. Another neighbouring feature, the ventral posterior parietal cortex (PPv) is clearly identifiable because of its low myelin content33 relative to the rest of the parietal cortex.
In the frontal cortex of our map, the motor areas are visible. Even though these output areas contain less myelin than the primary sensory areas, their caudal border is readily identified because of contrast with S1 which is heavily myelinated and their rostral border is visible as there is very little myelin in the rest of the frontal cortex. Although the large motor area we have identified contains many subdivisions, including the primary motor cortex, the premotor areas, and the frontal eye fields34,35, there is little contrast between these regions, so they must be grouped into a common area. Area 12 in the dorsolateral and orbital frontal cortex is relatively well-myelinated36 and is easily identified in our map. Interestingly, this area is an important source of projections to the heavily myelinated MT area37.
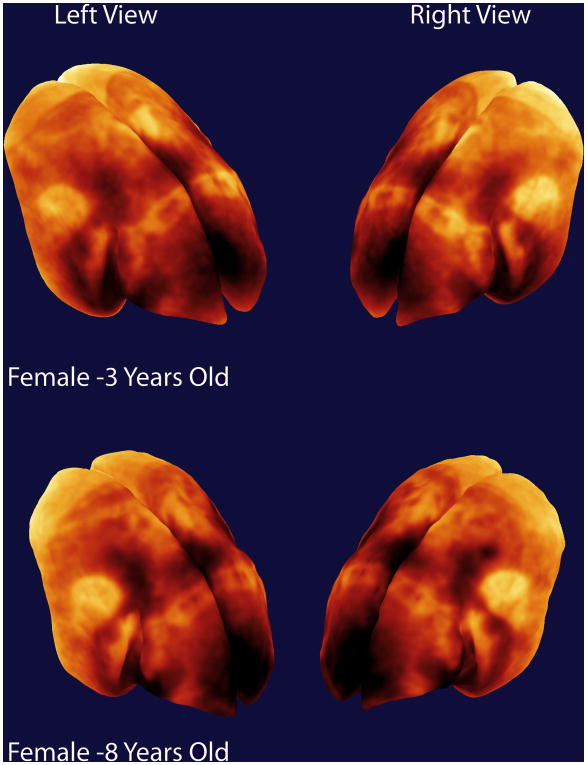
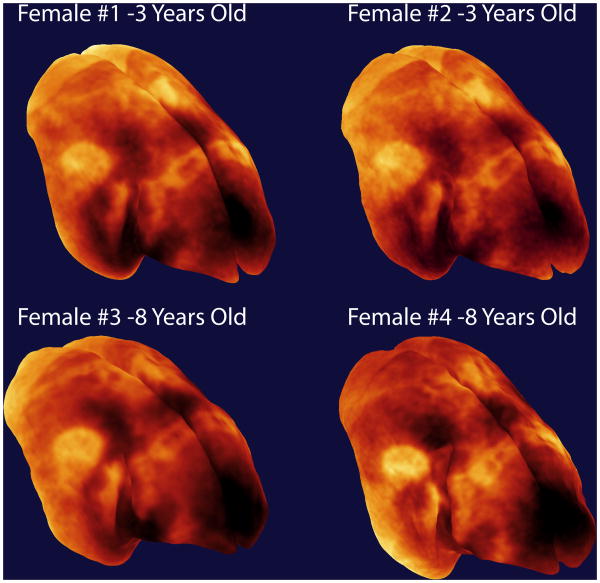
While we only show one representative flattened map of the marmoset cortex in this paper, the four marmosets showed a similar pattern of myelination over the cortex in the 3D maps (see Supplemental Figure 2). We do not actually expect major differences in neuroanatomy between the individuals in this study as they were all female and were in their adult years20. Figure 5 shows 3D maps from a 3 year-old female marmoset and an 8 year-old female marmoset and the maps are very similar suggesting a good reproducibility of our mapping technique.
Figure 5.
Comparative 3D maps of myeloarchitecture from representative 3-year old and 8-year old female common marmosets. Both animals are adults and the maps show a similar pattern of cortical organization.
To quantitatively summarize cortical organization in the marmoset, we measured the surface areas of the major enhancing areas in our maps from all four monkeys (see Figure 6 and Table 1). Since A1 and R are continuous, we have necessarily combined their areas as a single measure. Since we only had four animals in the study, we have pooled our measurements rather than look for differences in cortical organization between the marmosets. The low standard deviations in our measurements suggest that the size of cortical areas may be largely preserved over different individuals, although a more statistically rigorous study with a large number of animals would be required to confirm this. Comparing measurements between hemispheres, we again see little variation, although more animals would also be needed to statistically confirm this.
Figure 6. Definition of cortical areas for surface area measurements.
Table 1. Surface area measurements.
| Region | Surface Area (mm2) | Percent of Total Cortical Surface Area of Hemisphere |
|---|---|---|
| Left Cortex | 1005 ± 21 | - |
| Left V1 | 219 ± 12 | 22 |
| Left Motor | 36 ± 2 | 4 |
| Left S1 | 28 ± 4 | 3 |
| Left MT | 17 ± 3 | 2 |
| Left A1 and R | 11 ± 3 | 1 |
| Left DM | 8 ± 1 | 1 |
| Right Cortex | 1007 ± 34 | - |
| Right V1 | 222 ± 3 | 22 |
| Right Motor | 37 ± 3 | 4 |
| Right S1 | 30 ± 4 | 3 |
| Right MT | 19 ± 2 | 2 |
| Right A1 and R | 11 ± 3 | 1 |
| Right DM | 7 ± 1 | 1 |
The measurements of the left and right cortex include the entire cortical surface, including the ventral surface and occipital area not shown in the flattened map. (n =4, surface areas reported as mean ± standard deviation).
What we do see in our surface area data is that a large proportion of the marmoset cortex is devoted to vision, since V1 is almost five times as large as all the motor areas combined, seven times as large as S1, and almost 22 times as large as A1+R! If we count MT and DM as visual areas as well, then at least a quarter of the marmoset cortex is devoted to vision. These types of measures are useful in comparative studies of cortical organization.
Discussion
In this paper, we show that in vivo MRI and advanced image processing well visualize myeloarchitecture in common marmosets. The ability to show the entire pattern of myeloarchitecture over the cortex provides a compact summary of cortical organization in the marmoset and the location and extent of many important cortical areas can be readily identified. Also, accurate surface area measurements can be made for specific cortical areas in 3D maps which are free from the distortion and shrinkage associated with surface area measurements in from histology. In reality, our data compares quite closely with data from studies performed with traditional histology: we found the average surface area of V1 to be 220 mm2, whereas previous studies38,39 have reported averages of 205 mm2 and 200 mm2 respectively.
The surface area data is invaluable for comparative studies of cortical organization in different species too. For instance, we can also compare our results to a study performed with traditional histology in black-tufted marmosets (Callithrix penicillatta)30. We found MT to be 18 mm2 (averaged over both hemispheres) and V1 to be 220 mm2 in our common marmosets, versus 14 mm2 for MT and 182 mm2 measured from myelin-stained histology in the black-tufted marmosets. This shows close agreement between the two very similar species of marmoset.
A drawback of our technique is that is only allows visualization of major myelinated cortical areas and we lack the ability to delineate areas based on subtle variations in myelination patterns across the cortical areas. In reality, this level of resolution is probably beyond that of in vivo MRI, and highly detailed analyses of cortical organization are best left for traditional post-mortem histology. There is great utility; however, in being able to quantitatively follow major cortical areas in vivo.
One main application of our technique is in longitudinal studies of the morphological and functional changes of these heavily myelinated cortical areas that occur during development or in response to plastic reorganization induced by processes such as learning or injury. Because of our ability to follow each animal longitudinally, the technique could be used to monitor post-natal maturation and development of the primary sensory areas (A1, S1, and V1), as well as MT, which have been shown to be the first to mature in the marmoset 40. As well, our technique can be used to study the functional reorganization of these sensory areas that are known to occur following brain injuries associated with diseases such as stroke41 and multiple sclerosis 42 or in response to trauma43.
The image contrast in our technique is based on the effect of myelin shortening the T1 of water in the cortex. While the specific mechanisms of this effect are not fully identified in cortical gray matter, previous studies have shown that there are two apparent components to T1 in white matter: a short component associated with water trapped in the myelin sheaths, and a longer component associated with intra- and extracellular water44. While we cannot rule out contributions from other sources, including paramagnetic metals such as iron45 and manganese, we have observed a strong spatial correlation between cortical decreases in T1 with local increases in myelination. However, further studies are needed to fully elucidate the actual mechanisms by which myelin affects T1 in the cortex.
In theory, our technique can be used to visualize myeloarchitecture in any species (provided it can fit in an MRI scanner). Since MRI is non-destructive, our it is especially suited for studies in rare species or in longitudinal studies of cortical organization. It is also more accessible and does not require the same level of technical expertise needed for histological studies. A good knowledge of myelination patterns in the species in question is still needed, however, to interpret the MRI images. Overall, this paper shows the real potential of quantifying cortical organization in vivo with MRI.
Figure 7.
Areal distortion introduced by flattening. The figure shows the areal distortion produced when the right hemisphere was flattened in Figure 4. The original surface can be represented as a mesh of triangles. The areal distortion is a localized measure of the expansion or contraction of these triangles produced by the flattening operation. It is defined as ADi = log2(ASi/AFi) where i indexes a given triangle, ASi is its area in the original surface and AFi is its area in the flattened surface. In the figure, areal distortions tending towards black represent shrinkage, while those tending towards white represent expansions. One can see that the distortion is not uniform over the cortex, and it is greatest in regions with a high degree of curvature in the original image, like the frontal pole.
Figure 8.
Views of the surface rendered images from each of the four marmosets in the study.
Table 2.
| Region | Percent of Total Cortical Surface Area |
|---|---|
| V1 | 22 |
| Motor | 7 |
| S1 | 3 |
| MT | 2 |
| A1 and R | 1 |
| DM | 1 |
Acknowledgments
We wish to thank Dr. John Kaas for providing an expert review of our annotated maps of the marmoset cortex and Ms. Lisa Zhang for her excellent animal support.
References
- 1.Ashburner J, Friston KJ. Voxel-based morphometry--the methods. Neuroimage. 2000;11(6):805–821. doi: 10.1006/nimg.2000.0582. [DOI] [PubMed] [Google Scholar]
- 2.Thompson PM, Hayashi KM, Sowell ER, Gogtay N, Giedd JN, Rapoport JL, de Zubicaray GI, Janke AL, Rose SE, Semple J, Doddrell DM, Wang Y, van Erp TGM, Cannon TD, Toga AW. Mapping cortical change in Alzheimer's disease, brain development, and schizophrenia. Neuroimage. 2004;23(1):S2–18. doi: 10.1016/j.neuroimage.2004.07.071. [DOI] [PubMed] [Google Scholar]
- 3.Lerch JP, Pruessner J, Zijdenbos AP, Collins DL, Teipel SJ, Hampel H, Evans AC. Automated cortical thickness measurements from MRI can accurately separate Alzheimer's patients from normal elderly controls. Neurobiol Aging. 2008;29(1):23–30. doi: 10.1016/j.neurobiolaging.2006.09.013. [DOI] [PubMed] [Google Scholar]
- 4.Hikishima K, Quallo MM, Komaki Y, Yamada M, Kawai K, Momoshima S, Okano HJ, Sasaki E, Tamaoki N, Lemon RN, Iriki A, Okano H. Population-averaged standard template brain atlas for the common marmoset (Callithrix jacchus) Neuroimage. 2010;54(4):2741–2749. doi: 10.1016/j.neuroimage.2010.10.061. [DOI] [PubMed] [Google Scholar]
- 5.Bock NA, Kocharyan A, Silva AC. Manganese-enhanced MRI visualizes V1 in the non-human primate visual cortex. NMR Biomed. 2009;22(7):730–736. doi: 10.1002/nbm.1384. [DOI] [PMC free article] [PubMed] [Google Scholar]
- 6.Newman JD, Kenkel WM, Aronoff EC, Bock NA, Zametkin MR, Silva AC. A combined histological and MRI brain atlas of the common marmoset monkey, Callithrix jacchus. Brain Res Rev. 2009;62(1):1–18. doi: 10.1016/j.brainresrev.2009.09.001. [DOI] [PMC free article] [PubMed] [Google Scholar]
- 7.Sasaki E, Suemizu H, Shimada A, Hanazawa K, Oiwa R, Kamioka M, Tomioka I, Sotomaru Y, Hirakawa R, Eto T, Shiozawa S, Maeda T, Ito M, Ito R, Kito C, Yagihashi C, Kawai K, Miyoshi H, Tanioka Y, Tamaoki N, Habu S, Okano H, Nomura T. Generation of transgenic non-human primates with germline transmission. Nature. 2009;459(7246):523–527. doi: 10.1038/nature08090. [DOI] [PubMed] [Google Scholar]
- 8.Silva A, Lee J, Wu C, Tucciarone J, Pelled G, Aoki I, Koretsky A. Detection of cortical laminar architecture using manganese-enhanced MRI. J Neurosci Methods. 2008;167(2):246–257. doi: 10.1016/j.jneumeth.2007.08.020. [DOI] [PMC free article] [PubMed] [Google Scholar]
- 9.Marques JP, Maddage R, Mlynarik V, Gruetter R. On the origin of the MR image phase contrast: an in vivo MR microscopy study of the rat brain at 14.1 T. Neuroimage. 2009;46(2):345–352. doi: 10.1016/j.neuroimage.2009.02.023. [DOI] [PubMed] [Google Scholar]
- 10.Vogt C, Vogt O. Allgemeinere ergebnisse unserer hirnforschung. J Psychol Neurol. 1919;25:292–398. [Google Scholar]
- 11.Elliott Smith G. A new topographical survey of the human cerebral cortex, being an account of the anatomically distinct cortical areas and their relationship to the cerebral sulci. J Anat. 1907;41(4):237–254. [PMC free article] [PubMed] [Google Scholar]
- 12.Schleicher A, Morosan P, Amunts K, Zilles K. Quantitative Architectural Analysis: A New Approach to Cortical Mapping. J Autism Dev Disord. 2009;39(11):1568–1581. doi: 10.1007/s10803-009-0790-8. [DOI] [PubMed] [Google Scholar]
- 13.Annese J, Pitiot A, Dinov ID, Toga AW. A myelo-architectonic method for the structural classification of cortical areas. Neuroimage. 2004;21(1):15–26. doi: 10.1016/j.neuroimage.2003.08.024. [DOI] [PubMed] [Google Scholar]
- 14.Barbier E, Marrett S, Danek A, Vortmeyer A, van GP, Duyn J, Bandettini P, Grafman J, Koretsky A. Imaging cortical anatomy by high-resolution MR at 3.0T: detection of the stripe of Gennari in visual area 17. Magn Reson Med. 2002;48(4):735–738. doi: 10.1002/mrm.10255. [DOI] [PubMed] [Google Scholar]
- 15.Turner R, Oros-Peusquens A, Romanzetti S, Zilles K, Shah NJ. Optimised in vivo visualisation of cortical structures in the human brain at 3 T using IR-TSE. Magn Reson Imaging. 2008;26(7):935–942. doi: 10.1016/j.mri.2008.01.043. [DOI] [PubMed] [Google Scholar]
- 16.Bridge H, Clare S, Jenkinson M, Jezzard P, Parker AJ, Matthews PM. Independent anatomical and functional measures of the V1/V2 boundary in human visual cortex. J Vis. 2005;5(2):93–102. doi: 10.1167/5.2.1. [DOI] [PubMed] [Google Scholar]
- 17.Sigalovsky IS, Fischl B, Melcher JR. Mapping an intrinsic MR property of gray matter in auditory cortex of living humans: a possible marker for primary cortex and hemispheric differences. Neuroimage. 2006;32(4):1524–1537. doi: 10.1016/j.neuroimage.2006.05.023. [DOI] [PMC free article] [PubMed] [Google Scholar]
- 18.Mori S, Oishi K, Faria AV. White matter atlases based on diffusion tensor imaging. Curr Opin Neurol. 2009;22(4):362–369. doi: 10.1097/WCO.0b013e32832d954b. [DOI] [PMC free article] [PubMed] [Google Scholar]
- 19.Bock NA, Kocharyan A, Liu JV, Silva AC. Visualizing the entire cortical myelination pattern in marmosets with magnetic resonance imaging. J Neurosci Methods. 2009;185(1):15–22. doi: 10.1016/j.jneumeth.2009.08.022. [DOI] [PMC free article] [PubMed] [Google Scholar]
- 20.Abbott DH, Barnett DK, Colman RJ, Yamamoto ME, Schultz-Darken NJ. Aspects of common marmoset basic biology and life history important for biomedical research. Comp Med. 2003;53(4):339–350. [PubMed] [Google Scholar]
- 21.Wang J, Qiu M, Constable R. In vivo method for correcting transmit/receive nonuniformities with phased array coils. Magn Reson Med. 2005;53(3):666–674. doi: 10.1002/mrm.20377. [DOI] [PubMed] [Google Scholar]
- 22.Van Essen DC, Drury HA, Dickson J, Harwell J, Hanlon D, Anderson CH. An integrated software suite for surface-based analyses of cerebral cortex. J Am Med Inform Assoc. 2001;8(5):443–459. doi: 10.1136/jamia.2001.0080443. [DOI] [PMC free article] [PubMed] [Google Scholar]
- 23.Zilles K, Armstrong E, Moser KH, Schleicher A, Stephan H. Gyrification in the cerebral cortex of primates. Brain Behav Evol. 1989;34(3):143–150. doi: 10.1159/000116500. [DOI] [PubMed] [Google Scholar]
- 24.Rosa MG, Tweedale R. Visual areas in lateral and ventral extrastriate cortices of the marmoset monkey. J Comp Neurol. 2000;422(4):621–651. doi: 10.1002/1096-9861(20000710)422:4<621::aid-cne10>3.0.co;2-e. [DOI] [PubMed] [Google Scholar]
- 25.Lyon D, Kaas J. Connectional and architectonic evidence for dorsal and ventral V3, and dorsomedial area in marmoset monkeys. J Neurosci. 2001;21(1):249–261. doi: 10.1523/JNEUROSCI.21-01-00249.2001. [DOI] [PMC free article] [PubMed] [Google Scholar]
- 26.Pistorio AL, Hendry SH, Wang X. A modified technique for high-resolution staining of myelin. J Neurosci Methods. 2006;153(1):135–146. doi: 10.1016/j.jneumeth.2005.10.014. [DOI] [PubMed] [Google Scholar]
- 27.Reser DH, Burman KJ, Richardson KE, Spitzer MW, Rosa MGP. Connections of the marmoset rostrotemporal auditory area: express pathways for analysis of affective content in hearing. Eur J Neurosci. 2009;30(4):578–592. doi: 10.1111/j.1460-9568.2009.06846.x. [DOI] [PubMed] [Google Scholar]
- 28.Krubitzer LA, Kaas JH. The organization and connections of somatosensory cortex in marmosets. J Neurosci. 1990;10(3):952–974. doi: 10.1523/JNEUROSCI.10-03-00952.1990. [DOI] [PMC free article] [PubMed] [Google Scholar]
- 29.Jeffs J, Ichida JM, Federer F, Angelucci A. Anatomical evidence for classical and extra-classical receptive field completion across the discontinuous horizontal meridian representation of primate area V2. Cereb Cortex. 2009;19(4):963–981. doi: 10.1093/cercor/bhn142. [DOI] [PMC free article] [PubMed] [Google Scholar]
- 30.Pessoa V, Abrahao J, Pacheco R, Pereira L, Magalhaes-Castro B, Saraiva P. Relative sizes of cortical visual areas in marmosets: functional and phylogenetic implications. Exp Brain Res. 1992;88(2):459–462. doi: 10.1007/BF02259123. [DOI] [PubMed] [Google Scholar]
- 31.Rosa MG, Schmid LM. Visual areas in the dorsal and medial extrastriate cortices of the marmoset. J Comp Neurol. 1995;359(2):272–299. doi: 10.1002/cne.903590207. [DOI] [PubMed] [Google Scholar]
- 32.Rosa MG, Elston GN. Visuotopic organisation and neuronal response selectivity for direction of motion in visual areas of the caudal temporal lobe of the marmoset monkey (Callithrix jacchus): middle temporal area, middle temporal crescent, and surrounding cortex. J Comp Neurol. 1998;393(4):505–527. [PubMed] [Google Scholar]
- 33.Rosa MGP, Palmer SM, Gamberini M, Burman KJ, Yu H, Reser DH, Bourne JA, Tweedale R, Galletti C. Connections of the dorsomedial visual area: pathways for early integration of dorsal and ventral streams in extrastriate cortex. J Neurosci. 2009;29(14):4548–4563. doi: 10.1523/JNEUROSCI.0529-09.2009. [DOI] [PMC free article] [PubMed] [Google Scholar]
- 34.Burman KJ, Palmer SM, Gamberini M, Spitzer MW, Rosa MGP. Anatomical and physiological definition of the motor cortex of the marmoset monkey. J Comp Neurol. 2008;506(5):860–876. doi: 10.1002/cne.21580. [DOI] [PubMed] [Google Scholar]
- 35.Burish MJ, Stepniewska I, Kaas JH. Microstimulation and architectonics of frontoparietal cortex in common marmosets (Callithrix jacchus) J Comp Neurol. 2008;507(2):1151–1168. doi: 10.1002/cne.21596. [DOI] [PubMed] [Google Scholar]
- 36.Burman KJ, Rosa MGP. Architectural subdivisions of medial and orbital frontal cortices in the marmoset monkey (Callithrix jacchus) J Comp Neurol. 2009;514(1):11–29. doi: 10.1002/cne.21976. [DOI] [PubMed] [Google Scholar]
- 37.Burman KJ, Palmer SM, Gamberini M, Rosa MGP. Cytoarchitectonic subdivisions of the dorsolateral frontal cortex of the marmoset monkey (Callithrix jacchus), and their projections to dorsal visual areas. J Comp Neurol. 2006;495(2):149–172. doi: 10.1002/cne.20837. [DOI] [PubMed] [Google Scholar]
- 38.Fritsches KA, Rosa MG. Visuotopic organisation of striate cortex in the marmoset monkey (Callithrix jacchus) J Comp Neurol. 1996;372(2):264–282. doi: 10.1002/(SICI)1096-9861(19960819)372:2<264::AID-CNE8>3.0.CO;2-1. [DOI] [PubMed] [Google Scholar]
- 39.Missler M, Wolff A, Merker HJ, Wolff JR. Pre- and postnatal development of the primary visual cortex of the common marmoset. II. Formation, remodelling, and elimination of synapses as overlapping processes. J Comp Neurol. 1993;333(1):53–67. doi: 10.1002/cne.903330105. [DOI] [PubMed] [Google Scholar]
- 40.Burman KJ, Lui LL, Rosa MGP, Bourne JA. Development of non-phosphorylated neurofilament protein expression in neurones of the New World monkey dorsolateral frontal cortex. Eur J Neurosci. 2007;25(6):1767–1779. doi: 10.1111/j.1460-9568.2007.05442.x. [DOI] [PubMed] [Google Scholar]
- 41.Jiang Q, Zhang ZG, Chopp M. MRI evaluation of white matter recovery after brain injury. Stroke. 2010;41(10 Suppl):S112–3. doi: 10.1161/STROKEAHA.110.595629. [DOI] [PMC free article] [PubMed] [Google Scholar]
- 42.Filippi M, Rocca MA, Benedict RHB, Deluca J, Geurts JJG, Rombouts SARB, Ron M, Comi G. The contribution of MRI in assessing cognitive impairment in multiple sclerosis. Neurology. 2010;75(23):2121–2128. doi: 10.1212/WNL.0b013e318200d768. [DOI] [PMC free article] [PubMed] [Google Scholar]
- 43.Zhang Y, Xiong Y, Mahmood A, Meng Y, Liu Z, Qu C, Chopp M. Sprouting of corticospinal tract axons from the contralateral hemisphere into the denervated side of the spinal cord is associated with functional recovery in adult rat after traumatic brain injury and erythropoietin treatment. Brain Res. 2010;1353:249–257. doi: 10.1016/j.brainres.2010.07.046. [DOI] [PMC free article] [PubMed] [Google Scholar]
- 44.Labadie C, Lee J, Rooney W, Springer C, Moller H. Proceedings of the 16th Annual Meeting of ISMRM. 2008. Detection of the myelin water fraction in 4 Tesla longitudinal relaxation data by cross-regularized inverse Laplace transform. [Google Scholar]
- 45.Fukunaga M, Li T, van Gelderen P, de Zwart JA, Shmueli K, Yao B, Lee J, Maric D, Aronova MA, Zhang G, Leapman RD, Schenck JF, Merkle H, Duyn JH. Layer-specific variation of iron content in cerebral cortex as a source of MRI contrast. Proc Natl Acad Sci U S A. 2010;107(8):3834–3839. doi: 10.1073/pnas.0911177107. [DOI] [PMC free article] [PubMed] [Google Scholar]


