Abstract
Hyperspectral imaging (HSI) is an emerging modality for medical applications and holds great potential for noninvasive early detection of cancer. It has been reported that early cancer detection can improve the survival and quality of life of head and neck cancer patients. In this paper, we explored the possibility of differentiating between premalignant lesions and healthy tongue tissue using hyperspectral imaging in a chemical induced oral cancer animal model. We proposed a novel classification algorithm for cancer detection using hyperspectral images. The method detected the dysplastic tissue with an average area under the curve (AUC) of 0.89. The hyperspectral imaging and classification technique may provide a new tool for oral cancer detection.
Keywords: Hyperspectral imaging, 4NQO-induced oral cancer, early cancer detection, superpixel, random forest, image classification
1. INTRODUCTION
In 2015, approximately 45,780 people are expected to be diagnosed with oral cavity and pharynx cancer and 8,650 were expected to die from the disease in the United States [1]. If oral and pharynx cancer are diagnosed at an early stage, the 5-year survival rate is 83% [2]. However, about 75% of the cases have regional or distant spread of their disease at the time of diagnosis, with 5-year survival rates ranging from 37% to 61% [2]. Late stage diagnosis is also associated with high rates of second primary tumor and recurrence of the tumor [3]. Early detection represents one of the most promising approaches to improve both survival and quality of life of cancer patients because it enables a surgical, curative approach. For the overall population, shifting all cases to early detection would have a significant impact on overall cancer mortality and economic burden [4]. Screening methods that can detect precursor lesions or in situ disease hold even more promise, namely the possibility of eliminating the invasive condition and reducing the burden of the disease.
More than 90% of malignant neoplasms of the oral cavity and oropharynx occur in mucosal epithelium, some of which can be directly visualized [5]. Thus, the most common procedure for cancer screening consists of visual inspection of the entire tissue surface at risk under white light illumination, followed by biopsy of any suspicious tissue regions to make definitive diagnosis of its type and cancerous potential [6]. However, it is often difficult even for an experienced clinician to differentiate benign lesions from premalignant lesions and subsequently decide the area to biopsy. Due to the heterogeneous morphology and visual appearance of the lesions, biopsy diagnosis may not be representative of the highest pathological grade of a tumor due to the small sampling area [7]. This biopsy procedure is time-consuming and invasive. In addition, the interpretation of the histological slides of the biopsy tissue is subjective and inconsistent due to intra-observer and inter-observer variation [6] [8]. Therefore, a technique that can detect premalignant changes and lesions at an earlier stage in a reliable and noninvasive way would be very useful in the clinic.
Hyperspectral imaging (HSI) has the potential to detect malignant lesions earlier before they become macroscopically visible. In addition, HSI may prove to be a more objective technique supplementing the clinical impression, which is known to vary among medical practitioners. HSI is a label-free, noninvasive, and nonionizing imaging technology that expands human vision from visible to the ultraviolet (UV) to near-infrared (NIR) region of light. The basic principle of HSI is to acquire a stack of two-dimensional (2D) images over continuous spectral across a wide range of electromagnetic spectra e.g. from the UV to NIR regions. The rationale for cancer detection with HSI is that the spectral fingerprint of light diffusely reflected from tissue is influenced by biochemical and morphological changes that occur as disease changes tissue pathology. Hyperspectral images, which contain high-dimensional spectral information at each image location, can be analyzed by computer vision and machine learning methods for visualization, characterization and quantification of biological processes at the cellular, molecular, tissue and organ levels [9].
Our group has investigated the feasibility of using HSI for cancer detection in a tumor mouse model of prostate cancer [10] as well as head and neck cancer [11] [12] [13] [14] [15]. In this study, we aim to evaluate the capability of HSI for early detection of head and neck cancer in a chemically-induced cancer model. A 4-nitroquinoline-1-oxide (4NQO)-induced oral cancer model is imaged at multiple time points with hyperspectral imaging to study the carcinogenesis process of tongue cancer in mice. 4NQO is water soluble and can be added to the drinking water of the rodents to induce squamous cell carcinoma (SCC) of the palate, tongue, and esophagus. This model is ideal for studying premalignant lesions since the development of fully malignant SCC is clearly preceded by increasing grades of dysplastic changes, which mimics the development of oral cancer in human. A novel supervised classification scheme was proposed to distinguish dysplastic lesions from healthy tongue tissue.
2. MATERIALS AND METHODS
2.1 Instrumentation
A CRI Maestro in-vivo imaging system was used to acquire hyperspectral images. This system consists of a Xenon light source, a solid-state liquid crystal filter and a 16-bit high-resolution charge-coupled device (CCD). Details about this system has been described in our previous papers [16] [17]. This system is capable of obtaining reflectance images over the range of 450-950 nm with 5 nm increment, as well as fluorescence images under different excitation light.
2.2 Mouse Tongue Carcinogenesis Model
Six-week-old female CBA/J mice were purchased from the Jackson Laboratory and were used for the studies with 4-NQO. Animals were housed in the Animal Resource Facility of our institution under controlled conditions and fed sterilized special diet (Teklad global 10% protein rodent diet, Harlan) and autoclaved water. 4-NQO powder (Sigma Aldrich, St. Louis, USA) was diluted in the drinking water for mice. The water was changed once a week. Mice were allowed access to the drinking water at all times during the treatment. The body weights of the mice were measured once a week to monitor the tumor burden. Mice were scanned with hyperspectral imaging once a month for up to 24 weeks or until the signs of sickness or weight loss.
2.3 Data Acquisition
All the mice were scanned with our hyperspectral imaging system at week 8, 12, 20, 24 for reflectance images. The imaging procedures mainly involve the following steps: 1) Acquire white and dark reference hypercube before the mouse imaging; White reference image cubes are acquired by placing a standard white reference board in the field of view. The dark reference cubes are acquired by keeping the camera shutter closed. 2) Euthanize the mice and acquire the tongue tissue for immediate ex vivo imaging. Hyperspectral reflectance images are acquired with both the white light source and the interior near-infrared light over the wavelength range of 450-950 nm with 5 nm increment.
Immediately after imaging, selected mice were euthanized and their tongues were procured for histological processing. The ventral surface of the tongue was inked with blue on the left side and with red on the right side, and kept in 10% formalin overnight. Tongue tissue from both 4NQO-treated and control groups were embedded in paraffin, sectioned vertically down the dorsal surface into 5 µm sections, and stained with hematoxylin and eosin (H&E). The H&E slides were then reviewed by an experienced pathologist specialized in oral cancer, who segmented the section into pathological regions of normal, dysplasia, carcinoma in situ, and squamous cell carcinoma.
2.4 Overview of the Hyperspectral Imaging Approach
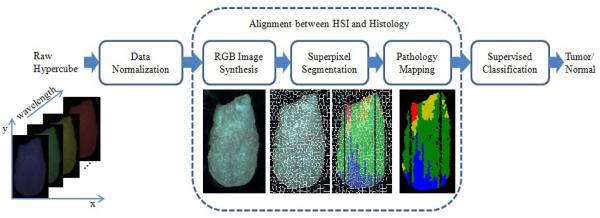
The flowchart of the proposed method is shown in Figure 1. First, the raw reflectance hypercube of the ex vivo tongue is preprocessed to normalized the reflectance data using the white and dark reference images. Next, the pathological gold standard is aligned with the ex vivo tongue. To achieve the alignment, three steps are conducted: (1) synthesize an RGB image from each normalized hyercube; (2) run the simple linear iterative clustering (SLIC) superpixel segmentation algorithm [18] on the RGB image to over-segment the tongue; (3) build a pathological gold standard matrix with each row represent one line on the tongue, and map the pathological matrix onto the tongue to obtain the label for each segment. Finally, a supervised classification method is applied to classify the superpixels of the tongue into normal or tumor tissue.
Figure 1.
Flowchart of the proposed method
2.5 Data Normalization
Data normalization is required to eliminate the spectral non-uniformity of the illumination and the influence of the dark current. Then the raw data can be converted into normalized reflectance using the following equation:
| (1) |
where Ireflect (λ) is the calculated normalized reflectance value for each wavelength. Iraw (λ) is the intensity value of a sample pixel. Iwhite(λ) and Idark (λ) are the corresponding pixel from the white and dark reference images at the same wavelength as the sample image.
2.6 Alignment between HSI and Histology
To compare the cancer detection results from the hyperspectral images with histology gold standard, a two-dimensional color-coded pathology map was created for each tongue specimen. Each tongue specimen was sectioned into a series of 5 µm tissue sections with 100 µm intervals between sections. Each tissue section represented one longitudinal line parallel to the midline on the dorsal surface of the tongue. The H&E slide from each section was reviewed by an experienced head and neck pathologist, who segmented the section into regions of normal, dysplasia, carcinoma in situ and carcinoma. The length of the tongue slice and the length of different pathological regions along each slice were measured. So the gold standard can be constructed as a matrix with each row as one tongue slice and each column as one pathology type. Missing sections or sections without a pathology reading are denoted by zero entries in the matrix. Therefore a color-coded pathology map can be created and aligned with the hyperspectral images of the tongue.
RGB images were synthesized from the reflectance hypercubes of the ex vivo tongues, and then over-segmented into multiple superpixels. The pathology matrix was then mapped onto each tongue and overlaid with the superpixels. The pathological reading for each superpixel was determined by the majority pathological type of the pixels within each superpixels.
2.7 Supervised Classification and Evaluation
The spectral curves of individual pixels within each superpixel segment were averaged as the feature of the superpixel. Dysplasia, carcinoma in situ and carcinoma were all considered as tumor in this study. Each superpixel was assigned a label of tumor or normal after classification. Five mice from week 12 and week 20 with pathological reading were selected to test the supervised classification. The leave-one-out cross validation method was used in the study. For each run, four of the mice were chosen to build the training database, and the rest one was tested on the model. Six different classifiers, including random forest (RF) [19], linear discriminate analysis (LDA) [20], support vector machine (SVM) [21], naïve bayes (NB), k-nearest neighbors (KNN) [22], and decision trees (DT) [23], were used and compared for classification. Receiver operating characteristic (ROC) curves and the areas under the ROC curve were used to assess the performance of the supervised classification.
3. RESULTS AND DISCUSSIONS
3.1 Spectral Fingerprints
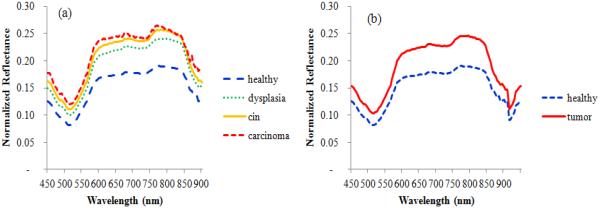
Figure 2 shows the average spectral curve of pre-malignant lesion (red dotted line) and normal tissue (blue solid line) from a typical 4NQO-treated tongue. It was observed that the average intensity of tumor tissue was higher than normal tissue across all the wavelengths for all the five mice. In addition, the differences between tumor and normal tissue were much larger within the wavelength region of 600-850 nm than other wavelength regions. Reflectance intensities from 900 to 950 nm were removed from features due to high noise in this wavelength range.
Figure 2.
Example spectral curves of tumor and normal tissue from a 4NQO-treated tongue. (a) Spectral curves of healthy, dysplasia, carcinoma in situ (cin) and carcinoma. (b) Spectral curves of healthy and tumor (including dysplasia, carcinoma in situ, and carcinoma).
3.2 Classification Results
Table 1 shows the AUC values of the six different classifiers (RF: random forest, LDA: linear discriminate analysis, SVM: support vector machine, NB: naïve bayes, KNN: k-nearest neighbors, and DT: decision trees) for distinguishing tumor from normal tissue. It can be seen that the random forest classifier performed the best among all the six classifiers, with an average AUC value of 0.892. In this experiment, 1500 trees were chosen to grow in parallel in MATLAB for each random forest.
Table 1.
Performance comparison of different classifiers for differentiating normal and tumor tissue.
| Classifier | Mouse #1 | Mouse #2 | Mouse #3 | Mouse #4 | Mouse #5 | Average |
|---|---|---|---|---|---|---|
| RF | 0.807 | 0.930 | 0.917 | 0.903 | 0.905 | 0.892 |
| LDA | 0.799 | 0.925 | 0.897 | 0.932 | 0.898 | 0.890 |
| SVM | 0.801 | 0.936 | 0.893 | 0.913 | 0.899 | 0.889 |
| NB | 0.637 | 0.868 | 0.898 | 0.869 | 0.902 | 0.835 |
| KNN | 0.713 | 0.859 | 0.865 | 0.859 | 0.838 | 0.827 |
| DT | 0.621 | 0.788 | 0.752 | 0.797 | 0.766 | 0.745 |
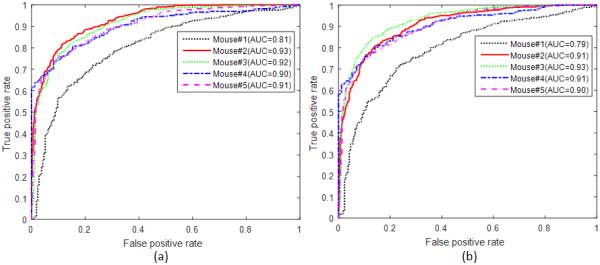
Figure 3 shows the ROC curves of all five mice with the RF classifier. All the curves are above the diagonal line. These curves demonstrated that the random forest method is effective in classifying tumor from normal tongue tissue.
Figure 3.
ROC curves of all five mice with the random forest classifiers. (a) Differentiation between normal and tumor (including dysplasia, carcinoma in situ, and carcinoma) (b) differentiation between normal and precursor lesions (dysplasia)
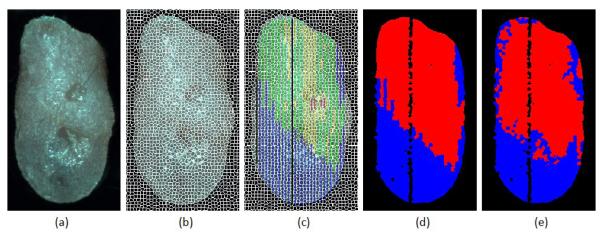
Figure 4 demonstrates the process of the pathology gold standard generation from histology slides for the tongue and the prediction map from the random forest classification method. The SLIC superpixel method captures the natural boundary of the local regions in the tongue, and over-segmented the tongue into small regions of about 25 pixels. Averaging the spectral curves of individual pixels within each superpixel suppressed the within-class variations in the spectral curve, and provided a characterizing feature for each superpixel. It can be found from (c) that carcinoma and carcinoma in situ regions could be small and isolated regions, so it would be difficult to identify these small regions if they were considered as a separate class. In addition, dysplasia tissue is the most commonly seen pathological type in all the 4NQO-treated mice, which make it possible to automatically distinguish between pre-malignant lesion and normal tissue. Hence, we proceeded to binarize the tongue into normal and tumor regions. The color map in (e) is the classification map provided by the random forest classifier with an AUC value of 0.93.
Figure 4.
Comparison of the histological gold standard map and the image classification result. (a) Synthetic RGB image from the reflectance hypercube. (b) Over-segmented tongue image using the SLIC superpixel method. (c) Gold standard overlaid with superpixels to generate pathological readings for each superpixel. Blue color denotes healthy tissue, green color denotes dysplasia, yellow color denotes carcinoma in situ, and red color denotes carcinoma. (d) Binarized gold standard map with the healthy tissue region in blue and non-healthy region in red. (e) Prediction by the random forest classifier with the healthy tissue region in blue and the non-healthy region in red.
To the best of our knowledge, it is the first time that reflectance hyperspectral imaging was tested on a chemically-induced tongue cancer model for non-invasive early cancer detection. The proposed method employed superpixel over-segmentation combined with pathologic mapping to align histology sections with ex vivo tongues. The random forest based classifier was found to be the most effective classifier among the six classifiers for the distinction of tumor from normal tissue in our study.
4. CONCLUSIONS
In this paper, we developed a hyperspectral imaging method for monitoring the oral carcinogenesis process and proposed a new classification algorithm for tongue cancer detection using hyperspectral images. With the proposed classification method, we were able to differentiated cancer from healthy tissue in our animal cancer model. Further development and translation of this technology are warranted to provide a potential tool for early detection of oral cancer in human patients. Hyperspectral imaging may be used as a noninvasive tool for tongue cancer screening.
Table 2.
Comparison of different classifiers for differentiating dysplasia from normal tissue
| Classifier | Mouse #1 | Mouse #2 | Mouse #3 | Mouse #4 | Mouse #5 | Average |
|---|---|---|---|---|---|---|
| SVM | 0.785 | 0.924 | 0.914 | 0.914 | 0.893 | 0.886 |
| LDA | 0.791 | 0.904 | 0.908 | 0.921 | 0.888 | 0.883 |
| RF | 0.773 | 0.916 | 0.918 | 0.898 | 0.896 | 0.880 |
| NB | 0.631 | 0.854 | 0.898 | 0.859 | 0.897 | 0.828 |
| KNN | 0.670 | 0.741 | 0.783 | 0.761 | 0.726 | 0.736 |
| DT | 0.668 | 0.731 | 0.783 | 0.717 | 0.743 | 0.729 |
ACKNOWLEDGEMENTS
This research is supported in part by NIH grants (CA176684 and CA156775). We thank Ms. Jennifer Shelton from the Pathology Core Lab at Winship Cancer Institute of Emory University for her help in histologic processing.
REFERENCES
- [1].Siegel RL, Miller KD, Jemal A. Cancer statistics, 2015. CA Cancer J Clin. 2015;65(1):5–29. doi: 10.3322/caac.21254. [DOI] [PubMed] [Google Scholar]
- [2].N. C. Institute, [SEER Stat Fact Sheets: Oral Cavity and Pharynx Cancer] http://seer.cancer.gov/statfacts/html/oralcav.html(2015)
- [3].Gerstner AO. Early detection in head and neck cancer - current state and future perspectives. GMS Curr Top Otorhinolaryngol Head Neck Surg. 2008;7:Doc06. [PMC free article] [PubMed] [Google Scholar]
- [4].Etzioni R, Urban N, Ramsey S, et al. The case for early detection. Nat Rev Cancer. 2003;3(4):243–52. doi: 10.1038/nrc1041. [DOI] [PubMed] [Google Scholar]
- [5].Bedard N, Pierce M, El-Nagger A, et al. Emerging roles for multimodal optical imaging in early cancer detection: a global challenge. Technol Cancer Res Treat. 2010;9(2):211–7. doi: 10.1177/153303461000900210. [DOI] [PMC free article] [PubMed] [Google Scholar]
- [6].van den Brekel MWM, Lodder WL, Stel HV, et al. Observer variation in the histopathologic assessment of extranodal tumor spread in lymph node metastases in the neck. Head & Neck. 2012;34(6):840–845. doi: 10.1002/hed.21823. [DOI] [PubMed] [Google Scholar]
- [7].Roblyer D, Richards-Kortum R, Sokolov K, et al. Multispectral optical imaging device for in vivo detection of oral neoplasia. Journal of biomedical optics. 2008;13(2):024019. doi: 10.1117/1.2904658. [DOI] [PMC free article] [PubMed] [Google Scholar]
- [8].Ismail SM, Colclough AB, Dinnen JS, et al. Observer variation in histopathological diagnosis and grading of cervical intraepithelial neoplasia. Bmj. 1989;298(6675):707–10. doi: 10.1136/bmj.298.6675.707. [DOI] [PMC free article] [PubMed] [Google Scholar]
- [9].Lu G, Fei B. Medical hyperspectral imaging: a review. J Biomed Opt. 2014;19(1):10901. doi: 10.1117/1.JBO.19.1.010901. [DOI] [PMC free article] [PubMed] [Google Scholar]
- [10].Akbari H, Halig LV, Zhang H, et al. Detection of Cancer Metastasis Using a Novel Macroscopic Hyperspectral Method. Proc. SPIE. 2012;8317:831711. doi: 10.1117/12.912026. 8317. [DOI] [PMC free article] [PubMed] [Google Scholar]
- [11].Lu G, Halig L, Wang D, et al. Spectral-spatial classification for noninvasive cancer detection using hyperspectral imaging. J Biomed Opt. 2014;19(10):106004. doi: 10.1117/1.JBO.19.10.106004. [DOI] [PMC free article] [PubMed] [Google Scholar]
- [12].Pike R, Lu G, Wang D, et al. A Minimum Spanning Forest Based Method for Noninvasive Cancer Detection with Hyperspectral Imaging. Biomedical Engineering, IEEE Transactions on. 2015;(99):1–1. doi: 10.1109/TBME.2015.2468578. [DOI] [PMC free article] [PubMed] [Google Scholar]
- [13].Lu G, Halig L, Wang D, et al. Spectral-Spatial Classification Using Tensor Modeling for Cancer Detection with Hyperspectral Imaging. Proc. SPIE. 2014;9034:903413. doi: 10.1117/12.2043796. [DOI] [PMC free article] [PubMed] [Google Scholar]
- [14].Lu G, Qin X, Wang D, et al. Quantitative wavelength analysis and image classification for intraoperative cancer diagnosis with hyperspectral imaging. Proc. SPIE. 2015;9415:94151B. doi: 10.1117/12.2082284. [DOI] [PMC free article] [PubMed] [Google Scholar]
- [15].Lu G, Wang D, Qin X, et al. A Framework for Hyperspectral Image Processing and Quantification for Cancer Detection during Animal Tumor Surgery. Journal of Biomedical Optics. 2015 doi: 10.1117/1.JBO.20.12.126012. In press. [DOI] [PMC free article] [PubMed] [Google Scholar]
- [16].Lu G, Halig L, Wang D, et al. Hyperspectral Imaging for Cancer Surgical Margin Delineation: Registration of Hyperspectral and Histological Images. Proc. SPIE. 2014;9036:90360s. doi: 10.1117/12.2043805. [DOI] [PMC free article] [PubMed] [Google Scholar]
- [17].Lu G, Qin X, Wang D, et al. Estimation of tissue optical parameters with hyperspectral imaging and spectral unmixing. Proc. SPIE. 2015;9417:94170Q. doi: 10.1117/12.2082299. [DOI] [PMC free article] [PubMed] [Google Scholar]
- [18].Achanta R, Shaji A, Smith K, et al. SLIC Superpixels Compared to State-of-the-Art Superpixel Methods. Pattern Analysis and Machine Intelligence, IEEE Transactions on. 2012;34(11):2274–2282. doi: 10.1109/TPAMI.2012.120. [DOI] [PubMed] [Google Scholar]
- [19].Breiman L. Random Forests. Machine Learning. 2001;45(1):5–32. [Google Scholar]
- [20].Guo Y, Hastie T, Tibshirani R. Regularized linear discriminant analysis and its application in microarrays. Biostatistics. 2007;8(1):86–100. doi: 10.1093/biostatistics/kxj035. [DOI] [PubMed] [Google Scholar]
- [21].Chang C-C, Lin C-J. LIBSVM: A library for support vector machines. ACM Trans. Intell. Syst. Technol. 2011;2(3):1–27. [Google Scholar]
- [22].Mitchell TM. McGraw-Hill, Inc.; 1997. [Machine Learning] [Google Scholar]
- [23].Breiman L, Friedman J, Stone CJ, et al. CRC press; 1984. [Classification and regression trees] [Google Scholar]


