

Abstract
Background & Aims
Pancreatic cancer is a leading cause of cancer mortality and mortality has not decreased in recent years. We sought to determine global trends in pancreatic cancer mortality.
Methods
We derived data on deaths from pancreatic cancer from the World Health Organization database for 59 countries, from 1980 through 2013. Age-standardized mortalities were computed for persons of all ages and for persons 35–64 years old; for selected countries, they were computed for persons 25–49 years old. Joinpoint regression models were used to identify significant changes in mortality. For selected larger countries, we predicted numbers of deaths and mortality for 2017.
Results
Between 1980 and 2013, overall pancreatic cancer mortality in men increased in the European Union (EU), as well as in southern and eastern Europe, Brazil, Japan, and Republic of Korea. Overall pancreatic cancer mortality decreased in most northern European countries, Australia, Canada, Mexico, and the United States (US). In women, mortality increased in the EU, Brazil, US, Japan, and Republic of Korea but decreased in Canada and Mexico. In 2012, Eastern Europe and Japan had the highest pancreatic cancer mortality, for both sexes. In men 25–49 years old, mortality decreased in the EU, US, Japan, and most large European countries. Based on our data, we predict overall pancreatic cancer mortality in 2017 to level off in men in the EU and US, but increase in Japan. In women, mortality will continue to increase in most countries except the US; the greatest increase is predicted to occur in Japan.
Conclusions
Mortality from pancreatic cancer has not decreased as it has for other cancers in recent years. A notable exception is a decrease in mortality in men 25–49 years old, which could indicate a reversal in the current increasing global trends.
Keywords: pancreatic tumor, rate of death, predictions, trends
INTRODUCTION
Pancreatic cancer is a leading cause of cancer mortality worldwide with over 330,000 new cases and approximately the same number of deaths annually.1–3 In contrast to most other common cancers, mortality from pancreatic cancer has not decreased in the previous decade.4 Moreover, the number of pancreatic cancer deaths is likely to further rise in the coming years in the United States (US), and pancreatic cancer may become the second cause of cancer death.5
We updated our previous reports on global trends in pancreatic cancer mortality4, 6 by analyzing data from the World Health Organization (WHO) database over the years 2002–2012 in Europe, North America, South America, Asia, and Australia. For major countries worldwide, we used joinpoint regression to analyze trends in pancreatic cancer mortality from 1980 to 2013 or most recent available year and provided predictions of number of deaths and mortality to 2017.
METHODS
Official death certification data for pancreatic cancer for 37 European countries and 22 other countries worldwide over the period 1980–2013 were derived from the World Health Organization (WHO) database available on electronic support.7 We considered countries with: (i) at least two million inhabitants in the last year available; (ii) data available for 20 years or more; and (iii) death certification coverage higher than 90%. Thus, in Europe, we considered 37 countries, excluding Albania whose national coverage was below 80%, and Cyprus whose data were available only for a few recent years. Most countries of the former Soviet Union were also excluded because of the low coverage. The European Union (EU) was defined as the union of 28 member states as of July 2013, with the exclusion of Cyprus. For the Americas, data from 14 countries were included (i.e., Argentina, Brazil, Canada, Chile, Colombia, Costa Rica, Cuba, Guatemala, Mexico, Panama, Puerto Rico, Uruguay, US, Uruguay, and Venezuela). Mortality data were also available for five Asian countries (i.e., Hong Kong, Japan, Republic of Korea, Singapore and Kuwait), Australia, and New Zealand. In a few countries, data were missing for one or more calendar years. No extrapolation was made for missing years, except for the calculation of the EU rates where, when data were not available for one or more years within a country, the nearest available data were used.
In the WHO database, during the calendar period considered (1980–2013), three different Revisions of the International Classification of Diseases (ICD) were used.8–10 Since coding differences between various revisions were generally minor, pancreatic cancer deaths were recoded for all countries according to the 10th Revision of the ICD (code=C25).8
Estimates of the resident population for the corresponding calendar periods, based on official censuses, were obtained from the same WHO database;7 when missing they were derived from EUROSTAT for some European countries11 and from the Pan American Health Organization (PAHO) database for some countries of the Americas.12, 13 Since the PAHO database provided sex- and 5-year age groups for selected years only, sex- and age-specific data for missing years were estimated by interpolation using the last available year in the WHO database.7
From the matrices of certified deaths and resident population, we computed age-specific rates for each 5-year age group and calendar year. Age-standardized mortality per 100,000 men and women were computed using the direct method on the basis of the world standard population first introduced by Segi in 196014 at all ages, truncated at age 35–64 years, and, for 16 selected larger countries providing adequate numbers, at age 25–49 years.
To identify significant changes in mortality trends over the period 1980–2013, for 31 selected countries worldwide and the EU as a whole, we used joinpoint regression models allowing for up to three jointpoints.15, 16 We also computed the estimated annual percent changes (APC) for each of the identified trends and the average annual percent change (AAPC) over the whole period.15, 17
Moreover, for eight selected larger countries worldwide and the EU as a whole, we provided estimates of pancreatic cancer deaths and rates for the year 2017. These were derived by fitting a joinpoint model to the number certified deaths in each 5-year age group, in order to identify the most recent trend slope, and by applying a linear regression on mortality data in each age group over the time period identified by the joinpoint model, in order to compute the predicted age-specific certified number of deaths, and the corresponding 95% prediction intervals (PI).3, 18 Predicted standardized death rates and the corresponding 95% PIs were computed using the predicted population data from the EUROSTAT,11 the US Census Bureau,19 and the Japanese National Institute of Population and Social Security Research (IPSS)20 databases.
RESULTS
Table 1 shows mortality data from pancreatic cancer in men and women from various countries worldwide and the EU as a whole around 2002 (2000–2004 quinquennium), 2007 (2005–2009 quinquennium), and 2012 (single year), along with the corresponding percent changes. In the EU, overall mortality for men rose from 7.6 to 7.9 per 100,000 (+3.1%) between 2002 and 2007 and were constant around 7.9 per 100,000 (+0.4%) between 2007 and 2012; corresponding changes were from 7.3 to 7.4 (+1.9%), and to 7.6 (+1.7%) per 100,000 in the US, and from 8.5 to 8.8 (+3.2%), and to 9.2 (+4.3%) per 100,000 in Japan. Increases in mortality from male pancreatic cancer were observed over the last ten years in various countries worldwide including Hungary, Portugal, Romania, the Russian Federation, Spain, the United Kingdom (UK), and Brazil. Some declines in rates were, however, observed over the last five years in other countries, including the Czech Republic, France, Germany, Italy, Poland, Argentina, Canada, Mexico, and Australia. In a few countries of Latin America with comparatively low rates, mortality declined between 2002 and 2007, but increased between 2007 and 2012. In EU women mortality rose from 5.0 to 5.2 per 100,000 (+5.4%) between 2002 and 2007, and to 5.4 per 100,000 (+2.6%) in 2012, in the US rates in women rose from 5.3 to 5.4 (+2.7%), and to 5.5 (+0.8%) per 100,000, and in Japanese women from 5.0 to 5.2 (+5.5%), to 5.8 (+10.3%) per 100,000. In France, Italy, Romania, the Russian Federation, Spain, Argentina, Brazil, and Australia female mortality trends were upwards over the last ten years, while they were more favorable - least over the last five years - in the Czech Republic, the Netherlands, Poland, Sweden, Cuba, Mexico, and New Zealand.
Table 1.
Overall age-standardized (world population) mortality rates from pancreatic cancer per 100,000 men and women in 59 countries worldwide and the European Union (EU) as a whole, around 2002 (2000–04), 2007 (2005–09), and 2012 (unless otherwise indicated), and corresponding percent changes in rates.
| Men | Women | |||||||||||
|---|---|---|---|---|---|---|---|---|---|---|---|---|
|
| ||||||||||||
| Rate 2002 |
Rate 2007 |
Rate 2012 |
N. deaths 2012 |
% change 2007/2002 |
% change 2012/2007 |
Rate 2002 |
Rate 2007 |
Rate 2012 |
N. deaths 2012 |
% change 2007/2002 |
% change 2012/2007 |
|
| EUROPE | ||||||||||||
| Austria | 8.76 | 8.88 | 8.55 | 722 | 1.43 | −3.78 | 6.32 | 6.15 | 6.70 | 836 | −2.62 | 8.86 |
| Belarus | 7.02 | 7.22 | 7.74 | 481 | 2.82 | 7.19 | 3.23 | 3.12 | 3.77 | 419 | −3.28 | 20.76 |
| Belgium | 6.74 | 7.02 | 7.04 | 788 | 4.23 | 0.16 | 4.66 | 4.94 | 5.07 | 799 | 5.88 | 2.61 |
| Bulgaria | 7.38 | 8.30 | 7.85 | 540 | 12.53 | −5.46 | 3.91 | 4.37 | 4.20 | 418 | 11.70 | −3.92 |
| Croatia | 8.52 | 8.88 | 10.01 | 399 | 4.22 | 12.70 | 4.71 | 5.39 | 5.43 | 347 | 14.34 | 0.66 |
| Czech Republic | 10.94 | 10.75 | 10.36 | 981 | −1.77 | −3.62 | 7.01 | 7.17 | 6.61 | 904 | 2.29 | −7.89 |
| Denmark | 7.86 | 8.19 | 9.04 | 514 | 4.13 | 10.40 | 6.54 | 6.73 | 6.53 | 467 | 2.89 | −2.89 |
| Estonia | 10.45 | 10.68 | 9.81 | 107 | 2.15 | −8.09 | 5.17 | 5.80 | 5.06 | 104 | 12.19 | −12.68 |
| Finland | 8.59 | 8.93 | 8.65 | 496 | 3.94 | −3.14 | 6.37 | 6.52 | 6.47 | 533 | 2.36 | −0.71 |
| France | 7.58 | 7.97 | 7.80 | 4752 | 5.13 | −2.17 | 4.43 | 4.80 | 4.87 | 4592 | 8.23 | 1.47 |
| Georgia | 2.74 | 2.09 | 2.93 | 94 | −23.70 | 40.26 | 1.68 | 1.05 | 1.76 | 73 | −37.57 | 68.07 |
| Germany | 8.20 | 8.36 | 8.34 | 7936 | 1.89 | −0.19 | 5.56 | 5.88 | 6.09 | 8184 | 5.84 | 3.45 |
| Greece | 6.54 | 6.88 | 7.36 | 904 | 5.28 | 7.01 | 3.86 | 4.21 | 4.37 | 727 | 9.11 | 3.89 |
| Hungary | 10.95 | 10.98 | 11.41 | 950 | 0.26 | 3.89 | 6.57 | 6.83 | 7.45 | 1053 | 3.90 | 9.05 |
| Iceland | 7.04 | 7.42 | 4.59 | 12 | 5.43 | −38.16 | 5.28 | 5.87 | 5.25 | 17 | 11.14 | −10.60 |
| Ireland | 7.09 | 7.37 | 7.42 | 243 | 4.03 | 0.63 | 5.30 | 5.50 | 5.61 | 234 | 3.88 | 1.97 |
| Israel | 8.76 | 8.33 | 9.28 | 471 | −4.88 | 11.35 | 5.68 | 5.87 | 5.65 | 401 | 3.27 | −3.81 |
| Italy | 7.40 | 7.61 | 7.50 | 5154 | 2.87 | −1.46 | 5.06 | 5.16 | 5.41 | 5568 | 1.91 | 4.99 |
| Kyrgyzstan | 3.72 | 3.57 | 5.11 | 83 | −4.05 | 43.43 | 2.60 | 2.57 | 2.83 | 67 | −1.20 | 9.82 |
| Latvia | 11.01 | 10.64 | 11.90 | 190 | −3.39 | 11.82 | 5.31 | 5.92 | 5.40 | 179 | 11.36 | −8.75 |
| Lithuania | 9.73 | 10.10 | 9.75 | 232 | 3.77 | −3.42 | 4.59 | 4.79 | 5.07 | 233 | 4.38 | 5.85 |
| Luxembourg | 8.39 | 7.50 | 8.13 | 36 | −10.65 | 8.44 | 5.48 | 4.73 | 4.56 | 32 | −13.82 | −3.53 |
| Macedonia | 6.22 | 7.26 | 8.26 | 118 | 16.71 | 13.86 | 3.25 | 4.25 | 3.92 | 71 | 30.88 | −7.67 |
| Malta | 8.43 | 8.47 | 9.46 | 37 | 0.48 | 11.67 | 6.33 | 5.35 | 7.13 | 36 | −15.44 | 33.21 |
| Netherlands | 7.06 | 7.62 | 7.84 | 1308 | 7.88 | 2.95 | 5.38 | 5.98 | 5.93 | 1260 | 11.30 | −0.94 |
| Norway | 7.22 | 7.28 | 7.52 | 365 | 0.82 | 3.27 | 5.70 | 5.81 | 6.12 | 359 | 1.87 | 5.42 |
| Poland | 8.02 | 8.16 | 7.92 | 2375 | 1.80 | −2.94 | 5.02 | 5.17 | 5.20 | 2397 | 3.03 | 0.61 |
| Portugal | 5.64 | 5.99 | 6.60 | 700 | 6.21 | 10.18 | 3.30 | 3.37 | 3.54 | 599 | 2.20 | 5.09 |
| Republic of Moldova | 7.55 | 8.48 | 10.09 | 215 | 12.35 | 18.93 | 3.61 | 4.59 | 4.00 | 123 | 27.24 | −12.90 |
| Romania | 8.17 | 8.81 | 9.23 | 1556 | 7.78 | 4.84 | 4.13 | 4.54 | 4.88 | 1244 | 9.86 | 7.48 |
| Russian Federation | 8.52 | 8.72 | 8.86 | 7925 | 2.33 | 1.68 | 4.28 | 4.57 | 4.64 | 7764 | 6.96 | 1.43 |
| Serbia | 7.02 | 7.97 | 8.02 | 573 | 13.58 | 0.56 | 4.37 | 5.03 | 5.48 | 526 | 15.21 | 8.85 |
| Slovakia | 9.75 | 10.03 | 10.62 | 396 | 2.92 | 5.85 | 5.01 | 6.18 | 5.99 | 340 | 23.24 | −3.06 |
| Slovenia | 8.17 | 8.83 | 9.19 | 165 | 8.16 | 3.99 | 5.14 | 6.09 | 6.57 | 198 | 18.47 | 7.95 |
| Spain | 6.44 | 6.60 | 7.04 | 3121 | 2.40 | 6.63 | 3.75 | 3.99 | 4.31 | 2855 | 6.45 | 8.09 |
| Sweden | 7.41 | 7.43 | 7.28 | 794 | 0.34 | −2.06 | 6.47 | 6.60 | 6.64 | 909 | 2.01 | 0.63 |
| Switzerland | 6.84 | 6.76 | 6.88 | 563 | −1.22 | 1.89 | 4.82 | 5.16 | 5.32 | 606 | 6.96 | 3.10 |
| UK | 6.37 | 6.48 | 6.71 | 4194 | 1.78 | 3.55 | 4.76 | 5.02 | 5.05 | 4138 | 5.53 | 0.70 |
| EU | 7.61 | 7.85 | 7.88 | 37990 | 3.12 | 0.35 | 4.97 | 5.24 | 5.38 | 37935 | 5.40 | 2.60 |
| AMERICA | ||||||||||||
| Argentina | 7.57 | 7.91 | 7.55 | 1829 | 4.39 | −4.53 | 5.40 | 5.65 | 5.78 | 2069 | 4.58 | 2.27 |
| Brazil | 3.58 | 3.95 | 4.28 | 4017 | 10.39 | 8.41 | 2.90 | 3.17 | 3.52 | 4206 | 9.45 | 10.85 |
| Canada | 6.77 | 6.70 | 6.59 | 2055 | −1.04 | −1.74 | 5.09 | 5.12 | 5.03 | 2027 | 0.48 | −1.62 |
| Chile | 4.95 | 4.86 | 4.92 | 526 | −1.75 | 1.28 | 4.50 | 4.60 | 4.81 | 674 | 2.04 | 4.63 |
| Colombia | 2.99 | 3.26 | 3.44 | 652 | 8.96 | 5.50 | 2.88 | 3.11 | 3.03 | 712 | 8.00 | −2.53 |
| Costa Rica | 4.55 | 3.93 | 4.90 | 118 | −13.53 | 24.71 | 4.08 | 3.42 | 3.88 | 104 | −16.28 | 13.59 |
| Cuba | 4.64 | 4.57 | 4.78 | 449 | −1.58 | 4.48 | 3.70 | 3.89 | 3.42 | 382 | 5.13 | −12.13 |
| Guatemala | 1.96 | 1.88 | 2.36 | 106 | −4.18 | 25.80 | 2.05 | 2.18 | 2.40 | 123 | 6.56 | 10.14 |
| Mexico | 3.95 | 3.90 | 3.74 | 1801 | −1.36 | −4.17 | 3.71 | 3.49 | 3.13 | 1959 | −6.10 | −10.15 |
| Panama | 2.97 | 3.07 | 3.34 | 64 | 3.17 | 8.81 | 2.86 | 2.73 | 2.48 | 54 | −4.86 | −9.13 |
| Puerto Rico | 3.83 | 3.97 | 4.61 | 127 | 3.62 | 16.17 | 2.48 | 2.86 | 3.26 | 129 | 15.43 | 14.02 |
| USA | 7.28 | 7.42 | 7.55 | 18703 | 1.93 | 1.72 | 5.27 | 5.41 | 5.45 | 18196 | 2.67 | 0.84 |
| Uruguay | 8.40 | 9.12 | 8.90 | 213 | 8.63 | −2.46 | 6.09 | 5.99 | 6.40 | 259 | −1.76 | 6.86 |
| Venezuela | 3.18 | 3.37 | 3.32 | 377 | 6.00 | −1.58 | 3.07 | 3.19 | 3.31 | 415 | 3.81 | 3.72 |
| OTHER AREAS OF THE WORLD | ||||||||||||
| Australia | 6.19 | 6.49 | 6.14 | 1218 | 4.79 | −5.39 | 4.50 | 4.54 | 4.71 | 1198 | 0.86 | 3.72 |
| Hong Kong | 3.92 | 4.07 | 4.41 | 287 | 3.59 | 8.45 | 2.76 | 2.78 | 3.15 | 251 | 0.58 | 13.34 |
| Japan | 8.51 | 8.78 | 9.16 | 15516 | 3.23 | 4.34 | 4.95 | 5.22 | 5.76 | 14399 | 5.45 | 10.26 |
| Kuwait | 3.06 | 3.10 | 2.66 | 21 | 1.20 | −14.09 | 2.79 | 2.84 | 4.45 | 24 | 1.79 | 56.76 |
| Mauritius | 3.35 | 4.05 | 4.02 | 27 | 20.98 | −0.78 | 2.15 | 2.46 | 2.49 | 21 | 14.13 | 1.25 |
| New Zealand | 5.60 | 5.69 | 5.97 | 219 | 1.59 | 4.98 | 4.06 | 4.63 | 4.66 | 210 | 13.99 | 0.63 |
| Republic of Korea | 7.55 | 7.37 | 7.57 | 2616 | −2.36 | 2.75 | 3.95 | 4.16 | 4.38 | 2162 | 5.32 | 5.10 |
Overall age-standardized mortality from pancreatic cancer in men and women from various countries worldwide and the EU as a whole in 2012 are provided in Table 1 and Figure 1. The highest rates in pancreatic cancer mortality for men were in Eastern European countries (>9 per 100,000) but also in Japan (9.2 per 100,000); and for women in Eastern and Northern European countries (>6 per 100,000) and in Japan (5.8 per 100,000), too. The lowest rates for men were in South American countries (<4 per 100,000); for women, the lowest were in Cuba, Venezuela, Puerto Rico, Hong Kong, Mexico, Colombia, and Guatemala rates (<3.5 per 100,000). Larger countries (including the EU, the US, Russia, and Japan) had rates around 6–9 per 100,000 men and 4–6 per 100,000 women.
Figure 1.

Age-standardized (world population) death certification rates from pancreatic cancer in men and women from 59 selected countries worldwide and the European Union (EU) as a whole, 2012.
In middle-age population (35–64 years), pancreatic cancer mortality trends were somewhat more favorable than in the overall population (Appendix Table 1). Some falls in rates were already observed (particularly in men) between 2002 and 2007 in various high-rate countries.
Age-standardized mortality data for pancreatic cancer in men and women from 16 larger countries worldwide at age 25–49 years are provided in Table 2. In the EU, rates in young men decreased both between 2002 and 2007 (−8.0%) and between 2007 and 2012 (−6.0%). Similarly, in the US and in Japan a decrease in rates was observed between 2002 and 2007 (−5.1% and −6.3%, respectively) and between 2007 and 2012 (−5.4% and −2.9%, respectively). The largest European countries such as France, Germany, Italy, and Russia, but also Argentina, Brazil, Mexico, and the Republic of Korea showed a decrease in male pancreatic cancer mortality, with particularly marked falls between 2007 and 2012 in German (−22.6%), Italian (−10.3%), and Mexican (−15.8%) men. Pancreatic cancer mortality slightly declined/leveled off in young men from Poland, the UK, and Canada between 2007 and 2012, to increase in the following quinquennium. In young EU women, rates were almost stable between 2002 and 2007 (−0.3%) and increased between 2007 and 2012 (2.6%); in US women they declined only between 2007 and 2012 (−7.1%), and in Japanese women only between 2002 and 2007 (−4.2%). Declines in mortality were observed in young women from most European countries considered, the reduction being, however, smaller in Poland and Spain, while mortality was still increasing between 2007 and 2012 in those from most other areas considered.
Table 2.
Age-standardized (world population) mortality rates from pancreatic cancer per 100,000 men and women at age 25–49 in 16 selected countries worldwide and the European Union (EU) as a whole, around 2002 (2000–04), 2007 (2005–09), and 2012 (unless otherwise indicated), and corresponding percent changes in rates.
| Men | Women | |||||||||||
|---|---|---|---|---|---|---|---|---|---|---|---|---|
|
| ||||||||||||
| Rate 2002 |
Rate 2007 |
Rate 2012 |
N. deaths 2012 |
% change 2007/2002 |
% change 2012/2007 |
Rate 2002 |
Rate 2007 |
Rate 2012 |
N. deaths 2012 |
% change 2007/2002 |
% change 2012/2007 |
|
| EUROPE | ||||||||||||
| France | 1.51 | 1.44 | 1.38 | 196 | −4.41 | −4.03 | 0.73 | 0.78 | 0.71 | 102 | 5.96 | −8.66 |
| Germany | 1.39 | 1.33 | 1.03 | 233 | −4.43 | −22.58 | 0.79 | 0.77 | 0.71 | 152 | −3.06 | −7.28 |
| Italy | 1.25 | 1.27 | 1.14 | 176 | 1.69 | −10.32 | 0.72 | 0.76 | 0.71 | 110 | 5.84 | −6.77 |
| Poland | 2.09 | 1.78 | 1.82 | 152 | −14.62 | 2.03 | 0.91 | 0.88 | 0.87 | 71 | −3.52 | −1.38 |
| Russian Federation | 2.68 | 2.58 | 2.49 | 797 | −3.69 | −3.71 | 0.94 | 1.00 | 0.92 | 319 | 7.01 | −8.21 |
| Spain | 1.46 | 1.36 | 1.36 | 171 | −6.61 | 0.01 | 0.69 | 0.81 | 0.81 | 99 | 16.67 | −0.25 |
| UK | 1.09 | 0.94 | 1.04 | 156 | −13.69 | 10.65 | 0.65 | 0.65 | 0.62 | 95 | 0.53 | −5.20 |
| EU | 1.54 | 1.42 | 1.33 | 1654 | −8.03 | −6.04 | 0.79 | 0.79 | 0.81 | 1001 | −0.28 | 2.59 |
| AMERICA | ||||||||||||
| Argentina | 1.40 | 1.31 | 1.31 | 104 | −6.37 | −0.32 | 0.94 | 0.85 | 0.92 | 76 | −9.68 | 8.57 |
| Brazil | 0.81 | 0.84 | 0.82 | 356 | 3.73 | −2.82 | 0.51 | 0.60 | 0.63 | 294 | 17.41 | 5.42 |
| Canada | 0.98 | 1.00 | 1.08 | 103 | 1.36 | 8.15 | 0.76 | 0.74 | 0.77 | 70 | −2.02 | 3.11 |
| Mexico | 0.87 | 0.85 | 0.72 | 160 | −1.19 | −15.75 | 0.71 | 0.65 | 0.57 | 148 | −8.51 | −12.48 |
| USA | 1.29 | 1.22 | 1.16 | 886 | −5.12 | −5.43 | 0.79 | 0.84 | 0.78 | 610 | 5.73 | −7.11 |
| OTHER AREAS WORLDWIDE | ||||||||||||
| Australia | 0.95 | 0.97 | 0.98 | 51 | 2.07 | 1.02 | 0.67 | 0.57 | 0.72 | 38 | −14.65 | 27.05 |
| Hong Kong | 0.82 | 0.77 | 1.71 | 30 | −6.00 | 120.85 | 0.42 | 0.47 | 0.57 | 13 | 11.23 | 20.59 |
| Japan | 1.41 | 1.32 | 1.28 | 367 | −6.26 | −2.93 | 0.72 | 0.69 | 0.73 | 202 | −3.42 | 5.47 |
| Republic of Korea | 1.41 | 1.09 | 1.05 | 150 | −22.76 | −3.38 | 0.62 | 0.62 | 0.54 | 75 | −0.54 | −12.13 |
Figure 2 and Appendix Table 2 provide the results of the joinpoint analysis for overall pancreatic cancer mortality in men and women from selected European countries in 1980–2013 (when available). In men, mortality slightly increased over the overall period in the EU as a whole (AAPC=+0.8%). In recent periods the rises in male rates were larger in countries of southern/eastern Europe, starting from relatively low rates, while they were stable in France, Germany, and Italy. In countries of northern Europe there was a significant decrease in men. However, some leveling off in rates was observed over more recent calendar years. In women from the EU, there was an increase in mortality between 1980 and 2013 (APC=+0.9%). Mortality slightly increased in women from some European countries including France, Germany, Italy, Poland, Russia, Spain; while trends were stable in the Netherlands, Sweden, Switzerland and the UK.
Figure 2.

Joinpoint analysis for pancreatic cancer mortality in 23 selected European countries and the European Union (EU) as a whole, 1980–2013.
■–■ men; ●—● women.
Among other countries worldwide (Figure 3 and Appendix Table 2), male mortality increased between 1980 and 2013 in Brazil, Japan, and the Republic of Korea, while mortality decreased in Canada, Mexico, and the US. Trends were similar, though slightly worse, in women.
Figure 3.
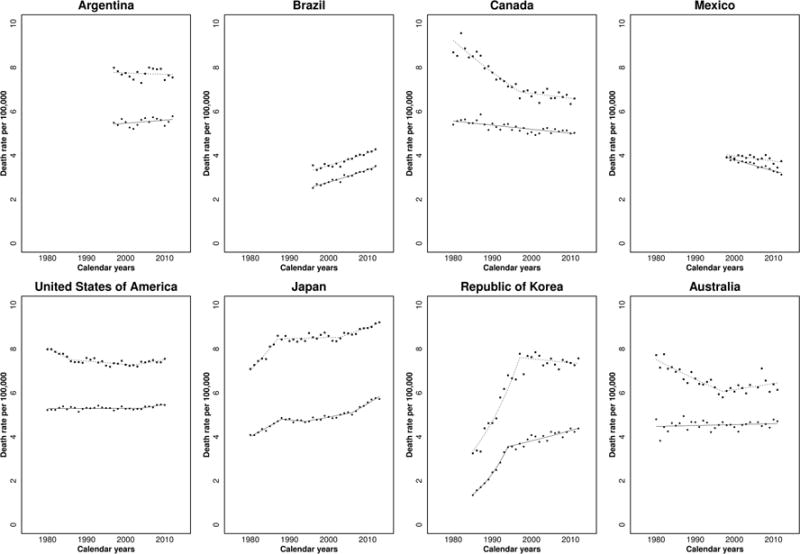
Joinpoint analysis for pancreatic cancer mortality in eight non-European countries worldwide, 1980–2013.
■–■ men; ●—● women.
The prediction models (Figure 4 and Appendix Table 3) estimated that overall mortality from pancreatic cancer in the next five years will level off or decline in men from the EU and US, as well as from France, Italy, Poland, the UK, although in men from Germany, Spain, and Japan some increase will still be observed. Female PC mortality will still increase in most countries worldwide, with the exclusion of the US, Italy, and Spain, where it will level off. The predicted rises in Japan are larger than in other countries.
Figure 4.

Age-standardized (world population) death rates from pancreatic cancer in eight countries worldwide and the European Union (EU) as a whole in 1980–2013, and predicted rates to 2017.
DISCUSSION
The present study provides an analysis of global trends in pancreatic cancer mortality. Overall pancreatic cancer mortality increased in several areas of the world over the last few years. In particular, mortality was still rising in men from a few countries of Eastern Europe and Japan (whose rates have become comparatively high) and in women from several areas worldwide. However, trends were more favorable in countries of northern Europe in both sexes and some improvements over the next five years were predicted in the EU, the US and other major European countries, particularly in men. Pancreatic cancer mortality in middle-aged and younger individuals appeared to be declining, supporting a reversal of previous increased mortality trends seen in prior decades. A decrease in pancreatic cancer mortality in young European men has been predicted previously.3 However, to our knowledge, this is the first report forecasting a decreased mortality in young men and women from many areas of the world.
Tobacco is the main recognized risk factor for pancreatic cancer, yet tobacco use accounts for less than a third of all pancreatic cancer cases in most areas of the world.21 The trends in pancreatic cancer mortality partly reflect patterns of tobacco consumption across generations, sexes, and throughout the world. Pancreatic cancer mortality began to drop in countries which first implemented strict tobacco control (including northern European countries, the US, Canada, and Australia), while they were still increasing in areas where reduction in use of tobacco products occurred later (e.g., Eastern Europe).22 The reductions were earlier in men, this explaining the different trends in men and women observed in some countries. Similarly, decreased pancreatic cancer mortality seen in young men (age 25–49) may reflect decreased tobacco use in those cohorts.23
Obesity24, 25 and diabetes,26 which are strongly associated,27 are other strong risk factors for pancreatic cancer24, 25, and may also have had an impact on more recent pancreatic cancer mortality trends. Obesity has been increasing for several decades in the US where now more than a third of individuals are obese,28 and similar increases in overweight/obesity have been observed in several European countries over the last decade.29 Such an increase in obesity may partly explain why pancreatic cancer mortality has not decreased to the extent of lung and other tobacco related cancers,30 although the risk from smoking is stronger for lung cancer than for pancreatic cancer.31, 32 Moreover, this may explain the leveling off in male trends over the most recent calendar years observed in the US, Canada, the UK, and Australia where declines were observed up to the early 2000s.
Other recognized risk factors for pancreatic cancer include heavy alcohol drinking,33, 34 chronic pancreatitis,35 and family history of the disease.36, 37 Those factors, however, contribute less to pancreatic cancer on a population level,38 and are unlikely to have major impact on worldwide mortality trends.
The prognosis of pancreatic cancer has remained largely unchanged, 5-year survival still being ≤ 7%.39, 40 Surgical resection of pancreatic cancer offers the only opportunity for cure, but less than 20% of patients are eligible for resection at the time of diagnosis;41 even following surgery and adjuvant chemotherapy, 5-year survival remains a dismal 20%.42 In the majority of patients who are not able to undergo surgery, palliative chemotherapy extends overall survival to a few months only.43 Thus, changes in therapeutic modalities are unlikely to have had a major impact on mortality trends from pancreatic cancer.
Improvements in diagnosis and certification of pancreatic cancer death may have had an impact on national pancreatic cancer mortality trends, and may partly explain the sharp changes observed in some countries, such as Korea and Japan. Pancreatic cancer represents a diagnostic challenge, and fewer than half of worldwide cases have histological confirmation.44 The accuracy and validity of pancreatic cancer diagnosis varies across countries and calendar years, and is likely poorer in middle-income regions as compared to high-income ones. Indeed, the largest changes in mortality trends were noted in smaller countries for which mortality data may not be well validated and would suffer more from random fluctuation. Some of the unfavorable trends in pancreatic cancer mortality may be due to improved diagnosis and certification of pancreatic cancer in certain areas of the world (e.g., parts of Eastern and Southern Europe, Central America), with increasing use of computerized tomography imaging and biopsy for histological confirmation. However, recent changes in pancreatic cancer mortality in larger, high-income countries from Western Europe, North America and Japan, where advanced technology was available earlier, are less likely to be a result of changes in technology availability.
In summary, overall pancreatic cancer mortality has not been declining at the rate of other tumors worldwide.3 Some unfavorable trends in pancreatic cancer mortality may be related to increasing prevalence of obesity and diabetes worldwide. However, a decrease in mortality, in particular among the young, was observed in various countries that have implemented tobacco control measures, especially in younger men and hence recent cohorts. This points to more favorable trends in pancreatic cancer in the near future,2 as also shown by our predictions to the next five years. Our results would therefore suggest a reversal of the upward trends observed in most countries during the last decades.
Acknowledgments
This work was conducted with the contribution of the Italian Association for Cancer Research (AIRC Grant N. 14360). Additional support was provided from COST Action (BM1204) EU-Pancreas. ALL was supported by the KL2 TR000069 from the National Center for Advancing Translational Sciences, National Institutes of Health, Bethesda, Maryland, US. MM was funded by MIUR (Ministero dell’Istruzione, dell’Università e della Ricerca), with a 2014 SIR (Scientific Independence of Young Researchers) grant (project RBSI1465UH).
Appendix Table 1.
Age-standardized (world population) mortality rates from pancreatic cancer per 100,000 men and women at age 35–64 in 59 countries worldwide and the European Union (EU) as a whole, around 2002 (2000–04), 2007 (2005–09), and 2012 (unless otherwise indicated), and corresponding percent changes in rates.
| Men | Women | |||||||||||
|---|---|---|---|---|---|---|---|---|---|---|---|---|
|
| ||||||||||||
| Rate 2002 | Rate 2007 | Rate 2012 | N. deaths 2012 | % change 2007/2002 | % change 2012/2007 | Rate 2002 | Rate 2007 | Rate 2012 | N. deaths 2012 | % change 2007/2002 | % change 2012/2007 | |
| EUROPE | ||||||||||||
| Austria | 11.10 | 11.66 | 10.09 | 188 | 5.10 | −13.50 | 7.13 | 7.05 | 7.30 | 142 | −1.09 | 3.55 |
| Belarus | 12.22 | 12.21 | 13.61 | 262 | −0.07 | 11.44 | 4.91 | 4.14 | 4.87 | 117 | −15.70 | 17.65 |
| Belgium | 8.84 | 8.63 | 7.99 | 199 | −2.34 | −7.38 | 5.10 | 5.67 | 5.99 | 150 | 11.09 | 5.67 |
| Bulgaria | 12.65 | 13.75 | 11.96 | 205 | 8.70 | −13.03 | 5.75 | 6.06 | 5.71 | 111 | 5.41 | −5.74 |
| Croatia | 12.51 | 11.94 | 14.24 | 144 | −4.51 | 19.25 | 5.03 | 6.77 | 6.12 | 68 | 34.60 | −9.58 |
| Czech Republic | 16.16 | 14.85 | 13.50 | 342 | −8.15 | −9.04 | 8.79 | 8.71 | 7.21 | 193 | −0.91 | −17.23 |
| Denmark | 10.40 | 10.74 | 11.07 | 141 | 3.18 | 3.07 | 8.39 | 7.68 | 6.95 | 90 | −8.45 | −9.44 |
| Estonia | 16.39 | 15.94 | 10.64 | 29 | −2.72 | −33.23 | 6.55 | 7.08 | 7.46 | 27 | 8.17 | 5.26 |
| Finland | 10.49 | 11.25 | 9.59 | 131 | 7.23 | −14.78 | 7.74 | 7.08 | 6.09 | 86 | −8.56 | −13.99 |
| France | 10.49 | 10.84 | 10.00 | 1407 | 3.38 | −7.75 | 5.09 | 5.62 | 5.53 | 824 | 10.47 | −1.58 |
| Georgia | 3.78 | 2.94 | 3.49 | 30 | −22.06 | 18.68 | 2.28 | 1.32 | 2.14 | 22 | −42.17 | 62.40 |
| Germany | 11.02 | 10.90 | 10.42 | 2057 | −1.12 | −4.36 | 6.37 | 6.67 | 6.55 | 1304 | 4.86 | −1.92 |
| Greece | 8.67 | 9.40 | 10.28 | 242 | 8.43 | 9.41 | 4.03 | 4.84 | 5.29 | 131 | 20.25 | 9.22 |
| Hungary | 17.27 | 17.49 | 16.66 | 378 | 1.26 | −4.77 | 8.67 | 9.13 | 8.99 | 233 | 5.38 | −1.55 |
| Iceland | 8.41 | 8.97 | 6.48 | 4 | 6.63 | −27.76 | 6.34 | 4.47 | 4.78 | 3 | −29.50 | 6.96 |
| Ireland | 7.93 | 8.95 | 7.51 | 64 | 12.86 | −16.11 | 5.29 | 5.92 | 4.55 | 38 | 12.02 | −23.10 |
| Israel | 10.22 | 9.79 | 12.21 | 157 | −4.25 | 24.69 | 6.26 | 6.55 | 5.35 | 73 | 4.56 | −18.23 |
| Italy | 9.81 | 9.85 | 9.07 | 1217 | 0.49 | −8.00 | 5.69 | 5.68 | 5.64 | 805 | −0.25 | −0.68 |
| Kyrgyzstan | 6.77 | 5.83 | 6.33 | 42 | −13.97 | 8.69 | 4.49 | 3.53 | 4.23 | 33 | −21.56 | 19.89 |
| Latvia | 17.53 | 16.16 | 20.94 | 88 | −7.83 | 29.63 | 6.74 | 8.02 | 6.70 | 36 | 19.01 | −16.44 |
| Lithuania | 15.64 | 15.89 | 13.43 | 81 | 1.58 | −15.45 | 5.53 | 6.17 | 5.72 | 42 | 11.50 | −7.25 |
| Luxembourg | 10.79 | 8.84 | 13.15 | 15 | −18.11 | 48.85 | 5.17 | 3.44 | 2.83 | 3 | −33.53 | −17.79 |
| Macedonia | 9.21 | 9.95 | 11.21 | 47 | 8.07 | 12.59 | 4.24 | 6.01 | 4.74 | 21 | 41.71 | −21.17 |
| Malta | 9.28 | 8.88 | 18.44 | 20 | −4.29 | 107.66 | 6.76 | 5.47 | 10.47 | 11 | −19.11 | 91.48 |
| Netherlands | 8.83 | 9.36 | 9.09 | 364 | 6.01 | −2.89 | 6.30 | 7.17 | 6.45 | 255 | 13.94 | −10.03 |
| Norway | 8.68 | 8.39 | 7.56 | 84 | −3.33 | −9.93 | 6.62 | 6.96 | 6.65 | 71 | 4.99 | −4.44 |
| Poland | 12.61 | 12.57 | 11.46 | 1017 | −0.37 | −8.81 | 6.60 | 6.66 | 6.78 | 671 | 1.05 | 1.75 |
| Portugal | 7.74 | 8.13 | 9.36 | 215 | 4.98 | 15.25 | 3.83 | 3.56 | 3.71 | 94 | −6.98 | 4.24 |
| Republic of Moldova | 13.31 | 14.93 | 18.34 | 126 | 12.21 | 22.83 | 5.52 | 7.29 | 5.27 | 46 | 32.07 | −27.69 |
| Romania | 13.54 | 14.07 | 14.63 | 664 | 3.89 | 3.96 | 5.64 | 5.98 | 5.94 | 300 | 5.85 | −0.53 |
| Russian Federation | 14.77 | 14.76 | 14.46 | 4213 | −0.06 | −2.04 | 6.08 | 6.33 | 6.10 | 2275 | 4.11 | −3.67 |
| Serbia | 11.13 | 12.12 | 11.69 | 215 | 8.85 | −3.52 | 6.18 | 6.69 | 6.72 | 139 | 8.24 | 0.43 |
| Slovakia | 14.02 | 15.00 | 14.26 | 169 | 6.97 | −4.96 | 6.40 | 7.36 | 7.08 | 88 | 15.09 | −3.88 |
| Slovenia | 10.76 | 12.52 | 11.67 | 58 | 16.34 | −6.78 | 5.94 | 7.26 | 6.93 | 32 | 22.09 | −4.47 |
| Spain | 9.42 | 9.50 | 9.83 | 967 | 0.85 | 3.52 | 4.46 | 4.80 | 5.07 | 512 | 7.73 | 5.71 |
| Sweden | 8.83 | 8.49 | 7.28 | 154 | −3.83 | −14.22 | 7.59 | 7.38 | 6.67 | 141 | −2.74 | −9.53 |
| Switzerland | 7.98 | 8.55 | 7.26 | 132 | 7.24 | −15.06 | 5.44 | 5.70 | 5.91 | 108 | 4.74 | 3.68 |
| UK | 8.07 | 7.94 | 8.26 | 1112 | −1.66 | 4.01 | 5.46 | 5.55 | 5.78 | 809 | 1.67 | 4.15 |
| EU | 10.62 | 10.70 | 10.46 | 11594 | 0.69 | −2.20 | 5.88 | 6.13 | 6.20 | 7204 | 4.29 | 1.09 |
| AMERICA | ||||||||||||
| Argentina | 9.87 | 10.46 | 9.98 | 626 | 5.92 | −4.58 | 6.37 | 6.78 | 7.16 | 493 | 6.44 | 5.54 |
| Brazil | 4.88 | 5.31 | 5.93 | 1702 | 8.98 | 11.65 | 3.39 | 3.83 | 4.34 | 1387 | 12.93 | 13.44 |
| Canada | 8.43 | 8.34 | 8.29 | 633 | −1.12 | −0.52 | 5.56 | 5.76 | 5.62 | 434 | 3.57 | −2.29 |
| Chile | 6.20 | 5.96 | 5.37 | 168 | −3.79 | −9.97 | 5.55 | 5.36 | 5.46 | 178 | −3.56 | 1.85 |
| Colombia | 3.60 | 3.82 | 3.73 | 237 | 6.25 | −2.48 | 3.36 | 3.27 | 3.28 | 224 | −2.81 | 0.39 |
| Costa Rica | 5.57 | 4.17 | 5.74 | 41 | −25.24 | 37.89 | 3.87 | 3.52 | 4.64 | 33 | −8.88 | 31.80 |
| Cuba | 6.38 | 6.00 | 6.01 | 151 | −5.92 | 0.14 | 4.26 | 4.70 | 3.65 | 95 | 10.40 | −22.40 |
| Guatemala | 2.76 | 2.62 | 3.05 | 37 | −5.03 | 16.18 | 3.01 | 2.95 | 3.24 | 45 | −1.98 | 9.68 |
| Mexico | 5.04 | 5.13 | 5.33 | 751 | 1.70 | 4.06 | 4.64 | 4.35 | 3.81 | 653 | −6.15 | −12.58 |
| Panama | 3.77 | 3.54 | 4.41 | 24 | −6.09 | 24.77 | 3.09 | 3.37 | 2.53 | 13 | 8.84 | −24.67 |
| Puerto Rico | 4.29 | 5.28 | 5.38 | 35 | 23.13 | 1.88 | 2.63 | 2.92 | 3.74 | 29 | 11.15 | 27.84 |
| USA | 9.63 | 9.81 | 9.96 | 6343 | 1.89 | 1.50 | 6.11 | 6.31 | 6.46 | 4381 | 3.28 | 2.41 |
| Uruguay | 10.86 | 12.70 | 12.98 | 74 | 16.92 | 2.17 | 7.97 | 7.45 | 6.99 | 45 | −6.52 | −6.17 |
| Venezuela | 4.04 | 4.45 | 4.75 | 180 | 10.12 | 6.71 | 3.47 | 3.84 | 3.69 | 141 | 10.69 | −4.11 |
| OTHER AREAS WORLDWIDE | ||||||||||||
| Australia | 7.58 | 7.85 | 7.52 | 357 | 3.58 | −4.31 | 4.82 | 4.76 | 4.64 | 222 | −1.42 | −2.49 |
| Hong Kong | 5.60 | 5.26 | 7.09 | 122 | −6.01 | 34.68 | 3.08 | 3.50 | 3.97 | 75 | 13.63 | 13.57 |
| Japan | 10.61 | 11.05 | 11.24 | 3585 | 4.19 | 1.70 | 5.42 | 5.76 | 6.29 | 2029 | 6.25 | 9.14 |
| Kuwait | 2.40 | 2.21 | 2.62 | 12 | −8.14 | 18.65 | 3.36 | 3.12 | 4.13 | 9 | −7.15 | 32.53 |
| Mauritius | 5.65 | 5.92 | 5.40 | 14 | 4.81 | −8.86 | 3.57 | 3.75 | 2.70 | 7 | 5.04 | −28.05 |
| New Zealand | 6.90 | 6.76 | 7.39 | 66 | −2.00 | 9.34 | 4.27 | 5.09 | 5.18 | 49 | 19.17 | 1.70 |
| Republic of Korea | 9.58 | 8.83 | 8.56 | 930 | −7.86 | −3.06 | 4.29 | 4.27 | 4.39 | 487 | −0.29 | 2.66 |
Appendix Table 2.
Joinpoint analysis for mortality from pancreatic cancer in men and women from 31 selected countries worldwide and the European Union (EU) as a whole, 1980–2013.
| Country | Men | Women | ||||||||||||||
|---|---|---|---|---|---|---|---|---|---|---|---|---|---|---|---|---|
|
| ||||||||||||||||
| Trend 1 | Trend 2 | Trend 3 | AAPC | Trend 1 | Trend 2 | Trend 3 | Trend 4 | AAPC | ||||||||
|
|
|
|||||||||||||||
| Years | APC | Years | APC | Years | APC | Years | APC | Years | APC | Years | APC | Years | APC | |||
| EUROPE | ||||||||||||||||
| Austria | 1980–2013 | −0.1 | −0.1 | 1980–2013 | 0.3a | 0.3a | ||||||||||
| Bulgaria | 1980–2011 | 1.5a | 1.5a | 1980–2011 | 1.5a | 1.5a | ||||||||||
| Czech Republic | 1986–2013 | −0.3a | −0.3a | 1986–2013 | 0.4a | 0.4a | ||||||||||
| Denmark | 1980–1996 | −1.5a | 1996–2012 | 0.7a | −0.4a | 1980–2012 | −0.2 | −0.2 | ||||||||
| Finland | 1980–2013 | −0.3a | −0.3a | 1980–2013 | 0.1 | 0.1 | ||||||||||
| France | 1980–2011 | 0.4a | 0.4a | 1980–2011 | 1.4a | 1.4a | ||||||||||
| Germany | 1980–1986 | 1a | 1986–2013 | 0.2a | 0.3a | 1980–2013 | 0.8a | 0.8a | ||||||||
| Greece | 1980–2012 | 0.9a | 0.9a | 1980–1987 | 3.1a | 1987–2012 | 1.2a | 1.6a | ||||||||
| Hungary | 1980–1990 | 2.1a | 1990–2013 | 0.1 | 0.7a | 1980–2013 | 0.7a | 0.7a | ||||||||
| Ireland | 1980–2005 | −1.3a | 2005–2010 | 2.9 | −0.6 | 1980–2010 | −0.2 | −0.2 | ||||||||
| Italy | 1980–1987 | 2.3a | 1987–2012 | 0.1a | 0.6a | 1980–1988 | 3.4a | 1988–2012 | 0.8a | 1.4a | ||||||
| Lithuania | 1993–2012 | −0.2 | −0.2 | 1993–2012 | 0.2 | 0.2 | ||||||||||
| Netherlands | 1980–1997 | −2.1a | 1997–2013 | 0.7a | −0.7a | 1980–2001 | −0.2 | 2001–2011 | 1.8a | 2011–2013 | −5.9 | 0 | ||||
| Norway | 1980–2013 | −0.4a | −0.4a | 1980–2013 | 0.3a | 0.3a | ||||||||||
| Poland | 1980–1982 | −3.7 | 1982–1986 | 5.7a | 1986–2013 | −0.2a | 0.3 | 1980–1987 | 2.7a | 1987–2013 | 0.2a | 0.7a | ||||
| Portugal | 1980–1987 | 3.1a | 1987–2004 | −0.1 | 2004–2013 | 2a | 1.2a | 1980–2013 | 0.7a | 0.7a | ||||||
| Romania | 1980–2005 | 2a | 2005–2012 | 0.8 | 1.8a | 1980–2012 | 1.8a | 1.8a | ||||||||
| Russian Federation | 1999–2001 | 5.9a | 2001–2011 | 0.4a | 1.3a | 1999–2001 | 6.4 | 2001–2011 | 1.1a | 2a | ||||||
| Slovenia | 1985–2010 | 0.9a | 0.9a | 1985–2010 | 1.4a | 1.4a | ||||||||||
| Spain | 1980–1989 | 3.1a | 1989–2013 | 0.9a | 1.5a | 1980–1986 | 4a | 1986–2013 | 1.4a | 1.9a | ||||||
| Sweden | 1980–1994 | −1.5a | 1994–2013 | −0.2 | −0.8a | 1980–2013 | −0.1 | −0.1 | ||||||||
| Switzerland | 1980–1993 | −0.3 | 1993–1996 | −5.3 | 1996–2012 | 0.3 | −0.2 | 1980–2012 | 0.2 | 0.2 | ||||||
| United Kingdom | 1980–1998 | −1.4a | 1998–2011 | 0.3 | −0.7a | 1980–1989 | 0.4 | 1989–1997 | −1.5a | 1997–2011 | 0.7a | 0.1 | ||||
| EU | 1980–1988 | 0.8a | 1988–2000 | 0 | 2000–2011 | 0.5a | 0.4a | 1980–1988 | 1.4a | 1988–1998 | 0.3a | 1998–2011 | 0.9a | 0.9a | ||
| AMERICA | ||||||||||||||||
| Argentina | 1997–2012 | −0.1 | −0.1 | 1997–2012 | 0.3 | 0.3 | ||||||||||
| Brazil | 1996–2012 | 1.5a | 1.5a | 1996–2012 | 1.9a | 1.9a | ||||||||||
| Canada | 1980–1997 | −1.7a | 1997–2011 | −0.3 | −1.1a | 1980–2011 | −0.4a | −0.4a | ||||||||
| Mexico | 1998–2012 | −0.6a | −0.6a | 1998–2012 | −1.4a | −1.4a | ||||||||||
| USA | 1980–1986 | −1.2a | 1986–2002 | −0.2a | 2002–2010 | 0.4a | −0.2a | 1980–2004 | 0 | 2004–2010 | 0.6a | 0.1a | ||||
| OTHER AREAS WORLDWIDE | ||||||||||||||||
| Australia | 1980–1997 | −1.3a | 1997–2011 | 0.4 | −0.5a | 1980–2011 | 0.1 | 0.1 | ||||||||
| Japan | 1980–1987 | 2.7a | 1987–2003 | 0.1 | 2003–2013 | 0.7a | 0.8a | 1980–1988 | 2.3a | 1988–1994 | −0.4 | 1994–2006 | 0.7a | 2006–2013 | 2a | 1.1a |
| Republic of Korea | 1985–1997 | 7.1a | 1997–2012 | −0.2 | 2.9a | 1985–1994 | 11.2a | 1994–2012 | 1.2a | 4.4a | ||||||
APC, estimated annual percent change; AAPC, estimated average annual percent change.
Significantly different from 0 (p<0.05).
Appendix Table 3.
Number of deaths and age-standardized mortality rates from pancreatic cancer in men and women from eight selected countries worldwide and the European Union (EU) as a whole in 2012 and corresponding predicted values for 2017.
| Country | Number deaths 2012 | Predicted deaths 2017 | 95% prediction interval | Death rates 2012 | Predicted death rates 2017 | 95% prediction interval | % change rates 2017/2012 |
|---|---|---|---|---|---|---|---|
| MEN | |||||||
| France | 4752 | 5500 | 5241–5696 | 7.80 | 7.83 | 7.47–8.19 | 0.38 |
| Germany | 8273 | 9000 | 8689–9318 | 8.77 | 8.84 | 8.51–9.18 | 0.80 |
| Italy | 5154 | 5700 | 5487–5862 | 7.50 | 7.49 | 7.21–7.77 | −0.13 |
| Poland | 2375 | 2400 | 2272–2589 | 7.73 | 7.36 | 6.86–7.86 | −4.79 |
| Spain | 3169 | 3400 | 3214–2589 | 6.83 | 7.06 | 6.72–7.41 | 3.37 |
| UK | 4232 | 4600 | 4419–4747 | 6.57 | 6.53 | 6.27–6.80 | −0.61 |
| EU | 39056 | 43400 | 42714–44067 | 7.93 | 7.87 | 7.74–8.00 | −0.76 |
| USA | 18703 | 21300 | 20895–21799 | 7.55 | 7.20 | 7.05–7.35 | −4.64 |
| Japan | 15872 | 17700 | 17270–18113 | 9.21 | 9.69 | 9.37–10.00 | 5.21 |
| WOMEN | |||||||
| France | 4592 | 5500 | 5280–5631 | 4.87 | 5.27 | 5.06–5.48 | 8.21 |
| Germany | 8328 | 9200 | 8797–9614 | 6.21 | 6.59 | 6.30–6.88 | 6.12 |
| Italy | 5568 | 5900 | 5712–6175 | 5.41 | 5.39 | 5.18–5.59 | −0.37 |
| Poland | 2355 | 2600 | 2451–2707 | 5.02 | 5.21 | 4.93–5.48 | 3.78 |
| Spain | 2870 | 3000 | 2889–3175 | 4.33 | 4.33 | 4.11–4.55 | 0.00 |
| UK | 4290 | 4500 | 4341–4677 | 5.07 | 5.10 | 4.89–5.31 | 0.59 |
| EU | 38693 | 43800 | 43170–44477 | 5.39 | 5.62 | 5.51–5.73 | 4.27 |
| USA | 18196 | 20900 | 20449–21309 | 5.45 | 5.38 | 5.26–5.50 | −1.28 |
| Japan | 14799 | 16700 | 16236–17091 | 5.72 | 6.15 | 5.91–6.39 | 7.52 |
Footnotes
Publisher's Disclaimer: This is a PDF file of an unedited manuscript that has been accepted for publication. As a service to our customers we are providing this early version of the manuscript. The manuscript will undergo copyediting, typesetting, and review of the resulting proof before it is published in its final citable form. Please note that during the production process errors may be discovered which could affect the content, and all legal disclaimers that apply to the journal pertain.
Author Contributions:
Study concept and design (ALL, CLV, PB, CB); analysis and interpretation of data (ALL, MM, GC, CLV, PB, CB); drafting of the manuscript (ALL, CB, CLV); critical revision of the manuscript for important intellectual content (ALL, MM, GC, EN, CLV, PB, CB); statistical analysis (MM, GC); obtained funding (EN, CLV).
Conflicts of Interest: The authors declare no conflicts of interest.
References
- 1.Ferlay J, Soerjomataram I, Dikshit R, et al. Cancer incidence and mortality worldwide: sources, methods and major patterns in GLOBOCAN 2012. Int J Cancer. 2015;136:E359–86. doi: 10.1002/ijc.29210. [DOI] [PubMed] [Google Scholar]
- 2.Malvezzi M, Bertuccio P, Levi F, et al. European cancer mortality predictions for the year 2014. Ann Oncol. 2014;25:1650–6. doi: 10.1093/annonc/mdu138. [DOI] [PubMed] [Google Scholar]
- 3.Malvezzi M, Bertuccio P, Rosso T, et al. European cancer mortality predictions for the year 2015: does lung cancer have the highest death rate in EU women? Ann Oncol. 2015;26:779–86. doi: 10.1093/annonc/mdv001. [DOI] [PubMed] [Google Scholar]
- 4.Bosetti C, Bertuccio P, Negri E, et al. Pancreatic cancer: overview of descriptive epidemiology. Mol Carcinog. 2012;51:3–13. doi: 10.1002/mc.20785. [DOI] [PubMed] [Google Scholar]
- 5.Rahib L, Smith BD, Aizenberg R, et al. Projecting cancer incidence and deaths to 2030: the unexpected burden of thyroid, liver, and pancreas cancers in the United States. Cancer Res. 2014;74:2913–21. doi: 10.1158/0008-5472.CAN-14-0155. [DOI] [PubMed] [Google Scholar]
- 6.Fernandez E, La Vecchia C, Porta M, et al. Trends in pancreatic cancer mortality in Europe, 1955–1989. Int J Cancer. 1994;57:786–92. doi: 10.1002/ijc.2910570605. [DOI] [PubMed] [Google Scholar]
- 7.World Health Organization Statistical Information System. WHO mortality database. Available at: http://www.who.int/healthinfo/statistics/mortality_rawdata/en/index.html (Last accessed May 2015)
- 8.World Health Organization. International Classification of Disease and related Health Problems: 10th revision. Geneva: World Health Organization; 1992. [Google Scholar]
- 9.World Health Organization. International Classification of Disease: 9th revision. Geneva: World Health Organization; 1977. [Google Scholar]
- 10.World Health Organization. International Classification of Disease: 8th revision. Geneva: World Health Organization; 1967. [Google Scholar]
- 11.European Commission. EUROSTAT population database. Available at: http://appsso.eurostat.ec.europa.eu/nui/show.do?dataset=demo_pjan&lang=en (Last accessed November 2014)
- 12.Pan American Health Organization (PAHO) Regional Core Health Data Initiative. Table Generator System. http://www.paho.org/English/SHA/coredata/tabulator/newTabulator.htm (Last accessed March 2014)
- 13.Pan American Health Organization (PAHO) Health Statistics from the Americas, 2006 Edition. :2–20. Chapter VI. http://www.paho.org/English/DD/AIS/HSA2006.htm (Last accessed March 2014)
- 14.Doll R, Smith PG, Waterhouse JAH, et al. Comparison between registries: age-standardized rates. IV. Cancer Incidence in Five Continents; 1982. pp. 671–675. (IARC Sci Publ No 42). [Google Scholar]
- 15.Kim HJ, Fay MP, Feuer EJ, et al. Permutation tests for joinpoint regression with applications to cancer rates. Stat Med. 2000;19:335–51. doi: 10.1002/(sici)1097-0258(20000215)19:3<335::aid-sim336>3.0.co;2-z. Erratum in: Stat Med 2001;20: 655. [DOI] [PubMed] [Google Scholar]
- 16.National Cancer Institute. Joinpoint Regression Program, version 4.1. 2014 Available at: http://srab.cancer.gov/joinpoint/
- 17.Clegg LX, Hankey BF, Tiwari R, et al. Estimating average annual per cent change in trend analysis. Stat Med. 2009;28:3670–82. doi: 10.1002/sim.3733. [DOI] [PMC free article] [PubMed] [Google Scholar]
- 18.Malvezzi M, Arfe A, Bertuccio P, et al. European cancer mortality predictions for the year 2011. Ann Oncol. 2011;22:947–56. doi: 10.1093/annonc/mdq774. [DOI] [PubMed] [Google Scholar]
- 19.Bureau UC. National Population Projections. Available at: http://www.census.goc/population/projections/data/national/2024.html (Last accessed January 2016)
- 20.Research NIoPaSS. Japanese National Institute of Population and Social Security Research. Available at: http://www.ipss.go.jp/index-e.asp (Last accessed May 2012)
- 21.Duell EJ. Epidemiology and potential mechanisms of tobacco smoking and heavy alcohol consumption in pancreatic cancer. Mol Carcinog. 2012;51:40–52. doi: 10.1002/mc.20786. [DOI] [PubMed] [Google Scholar]
- 22.Mackay JM, Bettcher DW, Minhas R, et al. Successes and new emerging challenges in tobacco control: addressing the vector. Tob Control. 2012;21:77–9. doi: 10.1136/tobaccocontrol-2012-050433. [DOI] [PubMed] [Google Scholar]
- 23.World Health Organization Statistical Information System. Global Adult Tobacco Survey. Available at: http://www.who.int/tobacco/surveillance/gats/en/index.html [Last accessed October 2015]
- 24.Arslan AA, Helzlsouer KJ, Kooperberg C, et al. Anthropometric measures, body mass index, and pancreatic cancer: a pooled analysis from the Pancreatic Cancer Cohort Consortium (PanScan) Arch Intern Med. 2010;170:791–802. doi: 10.1001/archinternmed.2010.63. [DOI] [PMC free article] [PubMed] [Google Scholar]
- 25.Genkinger JM, Spiegelman D, Anderson KE, et al. A pooled analysis of 14 cohort studies of anthropometric factors and pancreatic cancer risk. Int J Cancer. 2011;129:1708–1717. doi: 10.1002/ijc.25794. [DOI] [PMC free article] [PubMed] [Google Scholar]
- 26.Bosetti C, Rosato V, Li D, et al. Diabetes, antidiabetic medications, and pancreatic cancer risk: an analysis from the International Pancreatic Cancer Case-Control Consortium. Ann Oncol. 2014;25:2065–72. doi: 10.1093/annonc/mdu276. [DOI] [PMC free article] [PubMed] [Google Scholar]
- 27.Ben Q, Xu M, Ning X, et al. Diabetes mellitus and risk of pancreatic cancer: A meta-analysis of cohort studies. Eur J Cancer. 2011;47:1928–37. doi: 10.1016/j.ejca.2011.03.003. [DOI] [PubMed] [Google Scholar]
- 28.Ogden CL, Carroll MD, Kit BK, et al. Prevalence of childhood and adult obesity in the United States, 2011–2012. JAMA. 2014;311:806–14. doi: 10.1001/jama.2014.732. [DOI] [PMC free article] [PubMed] [Google Scholar]
- 29.Gallus S, Lugo A, Murisic B, et al. Overweight and obesity in 16 European countries. Eur J Nutr. 2015;54:679–89. doi: 10.1007/s00394-014-0746-4. [DOI] [PubMed] [Google Scholar]
- 30.Bosetti C, Bertuccio P, Malvezzi M, et al. Cancer mortality in Europe, 2005–2009, and an overview of trends since 1980. Ann Oncol. 2013;24:2657–2671. doi: 10.1093/annonc/mdt301. [DOI] [PubMed] [Google Scholar]
- 31.Bosetti C, Lucenteforte E, Silverman DT, et al. Cigarette smoking and pancreatic cancer: an analysis from the International Pancreatic Cancer Case-Control Consortium (Panc4) Ann Oncol. 2012;23:1880–8. doi: 10.1093/annonc/mdr541. [DOI] [PMC free article] [PubMed] [Google Scholar]
- 32.U.S. Department of Health and Human Services. The Health Consequences of Smoking: 50 Years of Progress. A Report of the Surgeon General. Atlanta GUSD. 2014 [Google Scholar]
- 33.Lucenteforte E, La Vecchia C, Silverman D, et al. Alcohol consumption and pancreatic cancer: a pooled analysis in the International Pancreatic Cancer Case-Control Consortium (PanC4) Ann Oncol. 2012;23:374–82. doi: 10.1093/annonc/mdr120. [DOI] [PMC free article] [PubMed] [Google Scholar]
- 34.Michaud DS, Vrieling A, Jiao L, et al. Alcohol intake and pancreatic cancer: a pooled analysis from the pancreatic cancer cohort consortium (PanScan) Cancer Causes Control. 2010;21:1213–25. doi: 10.1007/s10552-010-9548-z. [DOI] [PMC free article] [PubMed] [Google Scholar]
- 35.Duell EJ, Lucenteforte E, Olson SH, et al. Pancreatitis and pancreatic cancer risk: a pooled analysis in the International Pancreatic Cancer Case-Control Consortium (PanC4) Ann Oncol. 2012;23:2964–70. doi: 10.1093/annonc/mds140. [DOI] [PMC free article] [PubMed] [Google Scholar]
- 36.Becker AE, Hernandez YG, Frucht H, et al. Pancreatic ductal adenocarcinoma: risk factors, screening, and early detection. World J Gastroenterol. 2014;20:11182–98. doi: 10.3748/wjg.v20.i32.11182. [DOI] [PMC free article] [PubMed] [Google Scholar]
- 37.Lucas AL, Frado LE, Hwang C, et al. BRCA1 and BRCA2 germline mutations are frequently demonstrated in both high-risk pancreatic cancer screening and pancreatic cancer cohorts. Cancer. 2014;120:1960–7. doi: 10.1002/cncr.28662. [DOI] [PMC free article] [PubMed] [Google Scholar]
- 38.Maisonneuve P, Lowenfels AB. Risk factors for pancreatic cancer: a summary review of meta-analytical studies. Int J Epidemiol. 2015;44:186–98. doi: 10.1093/ije/dyu240. [DOI] [PubMed] [Google Scholar]
- 39.Simon D, Yen S, Cole P. Coffee drinking and cancer of the lower urinary tract. J Natl Cancer Inst. 1975;54:587–91. [PubMed] [Google Scholar]
- 40.Sant M, Allemani C, Santaquilani M, et al. EUROCARE-4. Survival of cancer patients diagnosed in 1995–1999. Results and commentary. Eur J Cancer. 2009;45:931–91. doi: 10.1016/j.ejca.2008.11.018. [DOI] [PubMed] [Google Scholar]
- 41.Spanknebel K, Conlon KC. Advances in the surgical management of pancreatic cancer. Cancer J. 2001;7:312–23. [PubMed] [Google Scholar]
- 42.Oettle H, Neuhaus P, Hochhaus A, et al. Adjuvant chemotherapy with gemcitabine and long-term outcomes among patients with resected pancreatic cancer: the CONKO-001 randomized trial. JAMA. 2013;310:1473–81. doi: 10.1001/jama.2013.279201. [DOI] [PubMed] [Google Scholar]
- 43.Conroy T, Desseigne F, Ychou M, et al. FOLFIRINOX versus gemcitabine for metastatic pancreatic cancer. N Engl J Med. 2011;364:1817–25. doi: 10.1056/NEJMoa1011923. [DOI] [PubMed] [Google Scholar]
- 44.Anderson KE, Mack TM, Silverman DT. Cancer of the Pancreas. In: Schottenfeld D, Fraumeni JF Jr, editors. Cancer Epidemiology and Prevention. 3rd. New York: Oxford University Press; 2006. pp. 721–762. [Google Scholar]