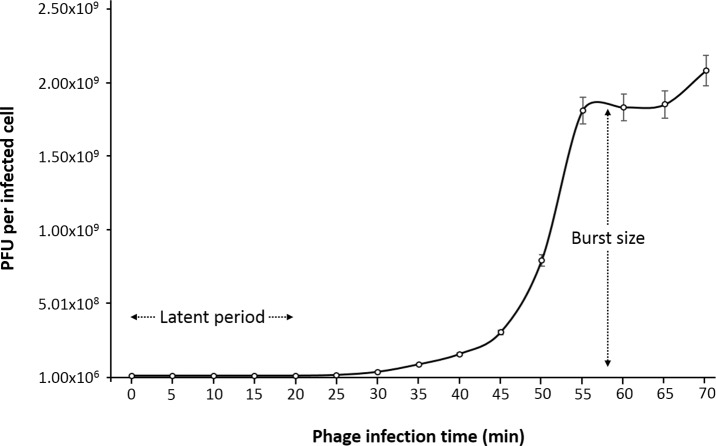
Figure 2. One-step growth curve of phage phiC119 on E. coli at 37 °C.
The parameters of phage growth are indicated in the figure, showing the latent period (20 min) and the average burst size (210 viral particles per host cell). Means ± standard error from three independent experiments are shown. Some of the error bars were too small to be visible.

