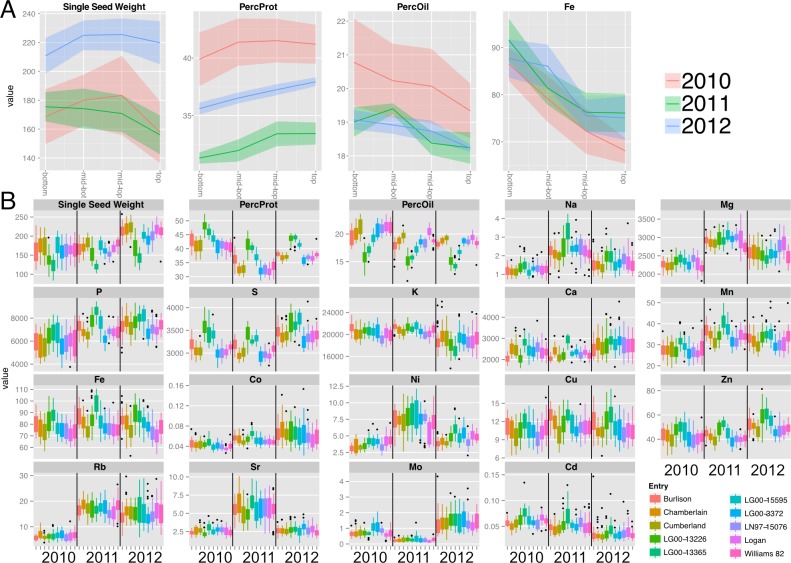
Figure 2. Canopy gradients of seed composition traits before normalization and line and year effects on total accumulation.
(A) Composition gradients from the bottom to the top of the canopy for cultivar ‘Chamberlain’. The plots display the quadrant average as a line with the 95% confidence interval calculated using standard error as the ribbon. Units are mg (Single seed weight), PPM (Fe) and percentage for Protein and Oil (B) Year and line effects for each compositional trait, represented as boxplots. Units are PPM.

