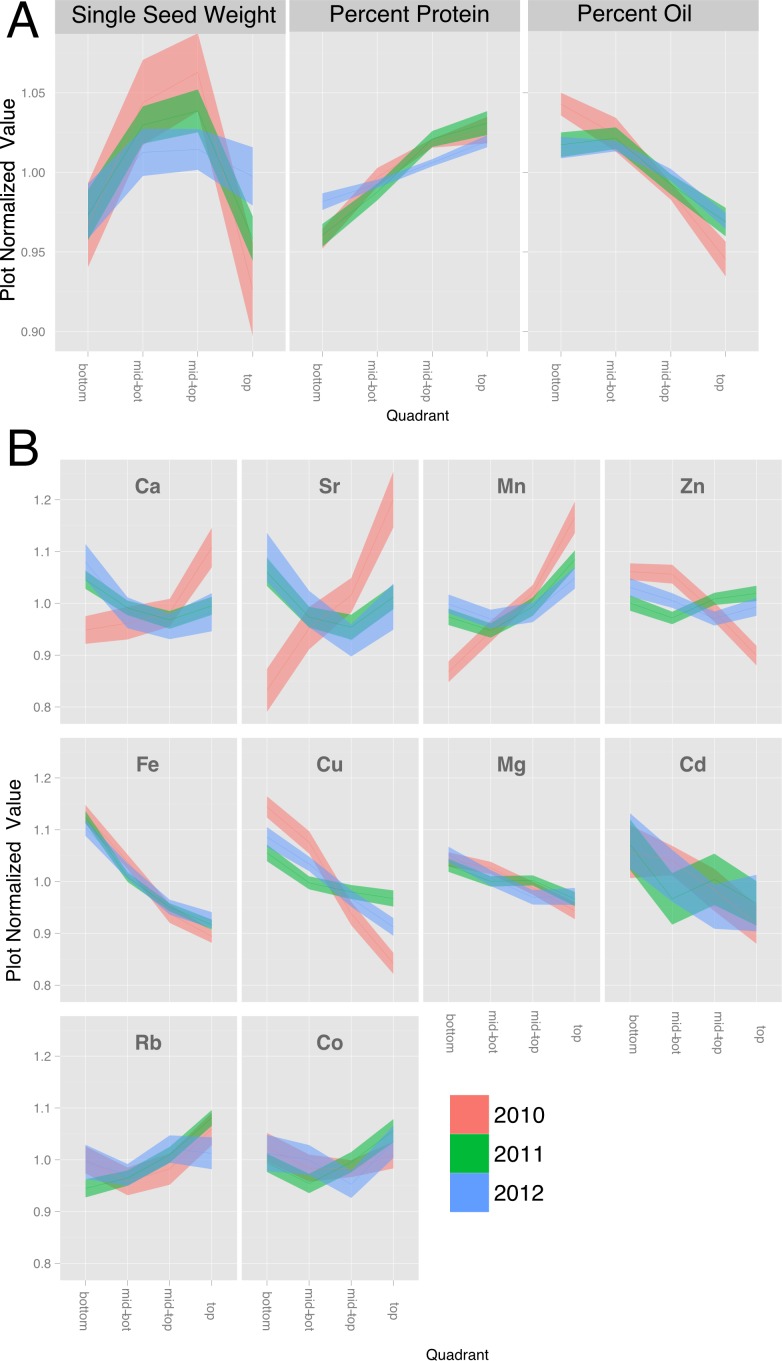
Figure 3. Canopy gradients of seed composition traits.
For each trait, the data was normalized to the plot average to remove the effect of environment and genotype. The plots display the quadrant average as a line with the 95% confidence interval calculated using standard error as the ribbon. (A) Percentage protein, percentage oil and single seed weight. (B) Elements with a significant (p < 1e − 10) effect of gradient in an ANOVA analysis that included Entry, Year and Position.

