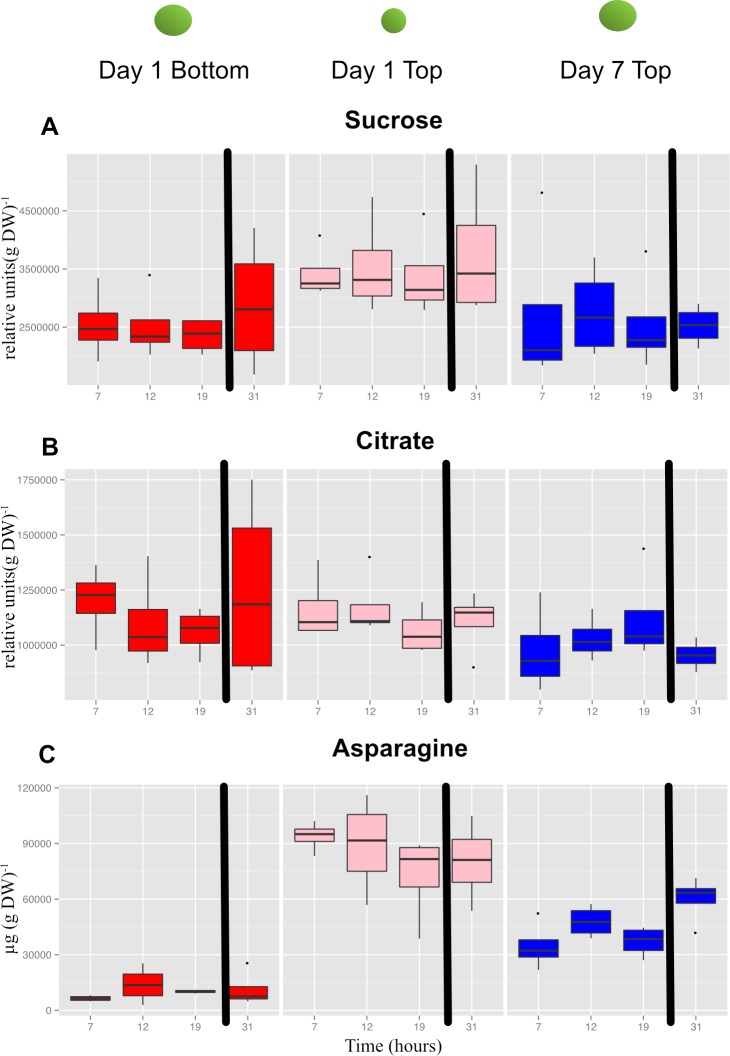
Figure 9. Concentrations of selected primary metabolites in developing seeds of cultivar ‘Williams 82’.
A, Suc; B, citrate; and C, Asn. Boxplots display the five number summary (median, 25, and 75% percentile define the box, with whiskers extending to 1.5 × interquartile range) for three replicates at each sampling time: 7 AM (7) , 12N (12) , 7 PM (19) and the following morning at 7 AM (31). The black vertical bars represent the intervening night period. Values are µg (g DW).

