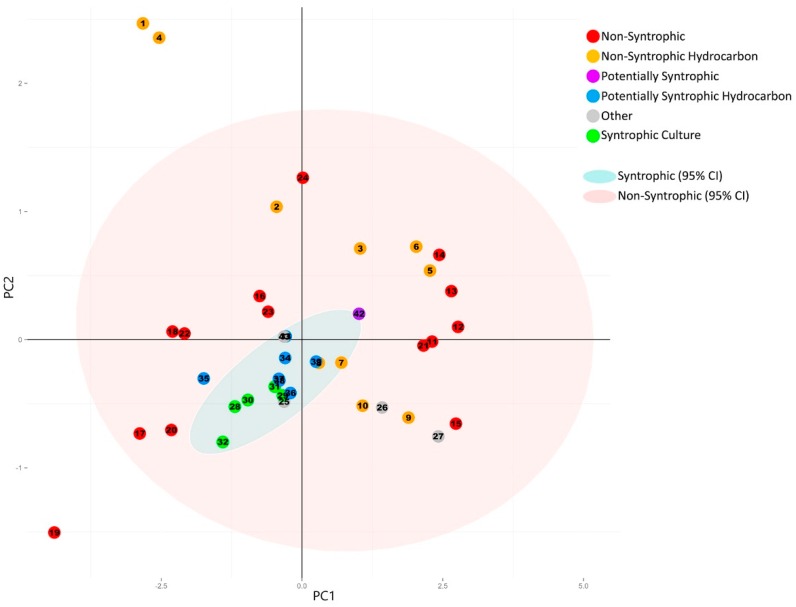
Figure 2.
Principal component analysis plot generated from the normalized number of universally present COGs detected in each metagenome. Categories for the universally present COGs are listed in Table 2, with the individual COGs for each category listed in Supplemental Table S1. Numbers of individual COGs found in each metagenome were summed for each COG category, divided by the total number of COGs for each respective category, and the sum was normalized against the total number of genes detected in each metagenome (Table 1 and Table 2). Principal component analysis was performed using R [18]. 95% Confidence ellipses were drawn for all metagenomes classified as syntrophic/potentially syntrophic, and for all metagenomes classified as non-syntrophic. The first two principal components are shown. The corresponding statistics and scree plot are shown in Supplemental Figure S1 and Table S3.

