Abstract
Plants absorb sunlight to power the photochemical reactions of photosynthesis, which can potentially damage the photosynthetic machinery. However, the mechanism that protects chloroplasts from the damage remains unclear. In this work, we demonstrated that rice (Oryza sativa L.) SLAC7 is a generally expressed membrane protein. Loss‐of‐function of SLAC7 caused continuous damage to the chloroplasts of mutant leaves under normal light conditions. Ion leakage indicators related to leaf damage such as H2O2 and abscisic acid levels were significantly higher in slac7‐1 than in the wild type. Consistently, the photosynthesis efficiency and Fv/Fm ratio of slac7‐1 were significantly decreased (similar to photoinhibition). In response to chloroplast damage, slac7‐1 altered its leaf morphology (curled or fused leaf) by the synergy between plant hormones and transcriptional factors to decrease the absorption of light, suggesting that a photoprotection mechanism for chloroplast damage was activated in slac7‐1. When grown in dark conditions, slac7‐1 displayed a normal phenotype. SLAC7 under the control of the AtSLAC1 promoter could partially complement the phenotypes of Arabidopsis slac1 mutants, indicating a partial conservation of SLAC protein functions. These results suggest that SLAC7 is essential for maintaining the chloroplast stability in rice.
Keywords: Anion transport, chloroplast, cytokinin, Oryza sativa L, photoinhibition, SLAC1
Edited by: Lixin Zhang, Institute of Botany, CAS, China
INTRODUCTION
In chloroplasts, photosynthetic pigment chlorophyll captures energy from sunlight, and then stores it in the energy storage molecules adenosine triphosphate (ATP) and nicotinamide adenine dinucleotide phosphate (NADPH) while freeing oxygen from H2O. Adenosine triphosphate and NADPH are then used to produce organic molecules from carbon dioxide (CO2) in the Calvin cycle (Bearden and Malkin 1975). However, the sunlight absorption can potentially damage the photosynthetic machinery, primarily photosystem II, thus causing photoinhibition (Takahashi and Badger 2011). To avoid net photoinhibition, plants have developed diverse photoprotection mechanisms such as light avoidance associated with the movement of leaves and chloroplasts, screening of photoradiation, reactive oxygen species scavenging systems, dissipation of absorbed light energy as thermal energy, cyclic electron flow around photosystem I, and photorespiratory pathway (Niyogi 1999). Chlorophyll molecules play a central role in the photosynthetic apparatus by capturing light and directing the energy towards the photosystem. By the first exposure of seedlings to light, chlorophyll production needs to be activated to the extreme and the molecules are immediately assembled into protein complexes which compose the photosynthetic apparatus (Krause and Weis 1991). When the reaction centers are damaged by excessive light, chlorophyll molecules need to be replaced (Takahashi and Badger 2011). Therefore, a stable supply of chlorophyll in the correct stoichiometry and with the apoproteins that bind the pigments is essential for the plant.
Arabidopsis SLAC (SLOW ANION CHANNEL‐ASSOCIATED) family comprises four structurally associated members with different tissue‐specific expression patterns, but all these members are localized in plasmalemma (Negi et al. 2008). SLAC proteins, which contain 10 predicted transmembrane helices, are distant homologs of the bacterial and fungal C4‐dicarboxylate transporters. SLAC1 was first identified and characterized in Arabidopsis by mutational screening for ozone and CO2 sensitivity. AtSLAC1 (At1g12480) is expressed preferentially in the plasmalemma of guard cells, which is essential for the stomatal closure in response to O3, CO2, NO, abscisic acid (ABA), H2O2 (hydrogen peroxide), light/dark alternation, and humidity variation (Vahisalu et al. 2008). Recent studies have shown that mutation in SLAC1 also causes slower stomatal opening induced by high humidity, low CO2 concentration, and light, which is under the compensatory feedback control in plants (Laanemets et al. 2013). AtSLAC1 also plays an important role in the function of slow anion channels, as loss of AtSLAC1 function can impair the slow anion channel currents activated by cytosolic ABA and Ca2+ (Vahisalu et al. 2008). In addition, loss of AtSLAC1 function causes overaccumulation of osmoregulatory anions (Cl−, malate2−) in the protoplasts of guard cells (Negi et al. 2008). However, two other Arabidopsis SLAC members, AtSLAH1 (At1g62280) and AtSLAH3 (At5g24030), are preferentially expressed in vascular cells. When the expression of the genes is driven by AtSLAC1 promoter, both can complement the phenotypes of atslac1 mutant (slac1‐2), indicating that AtSLAC1, AtSLAH1, and AtSLAH3 have conserved functions in Arabidopsis (Negi et al. 2008).
There are nine SLAC genes in rice. Recently, OsSLAC1 (LOC_Os04g48530.1), a close homolog of AtSLAC1, was isolated and characterized, revealing a potential relevance between stomatal conductance and photosynthesis rate as the mutant of OsSLAC1 showed significantly higher stomatal conductance (gs), photosynthesis rate (A) and ratio of internal CO2 to ambient CO2 (Ci/Ca) (Kusumi et al. 2012). This result demonstrates a functional conservation of this gene in rice with that in Arabidopsis. Nevertheless, the functions of other SLAC genes in rice are still unknown. In this work, we studied the expression and function of another rice SLAC gene named as SLAC7 (LOC_Os01g28840). We demonstrate that this gene is expressed in many tissues and functions in protecting chloroplasts from light‐triggered damage. Our data suggest that SLAC genes have diverse and important functions in plant growth.
RESULTS
Expression pattern and subcellular localization of SLAC7 in rice
The full length of SLAC7 genomic sequence is 2,519 bp, including three exons and two introns. Quantitative reverse transcription polymerase chain reaction (qRT‐PCR) analysis revealed that the gene was expressed in all examined organs/tissues, but with a relatively higher expression level in the root, sheath, leaf, anther, and pistil (Figure 1A). To further validate this expression pattern, the SLAC7 promoter was used to drive the expression of the β‐glucuronidase (GUS). β‐Glucuronidase staining analysis revealed that the SLAC7 promoter was active in all examined organs or tissues, confirming the results of qRT‐PCR (Figure 1B). These data indicate that SLAC7 is widely expressed in different tissues or organs in rice. SLAC7 protein was predicted to contain 10 transmembrane helices using the Center for Biological Sequence Analysis TMHMM server (Figure S1). The subcellular localization of SLAC7 was performed by the transient expression of a SLAC7:GFP fusion protein in onion epidermal cells. The results suggested that SLAC7 is not located in the cytoplasm and nucleus of the transformed onion epidermal cells. Subsequently, we performed the plasmolysis of the transformed onion cells, which further confirmed that SLAC7 is located at the plasma membrane (Figure 2).
Figure 1.
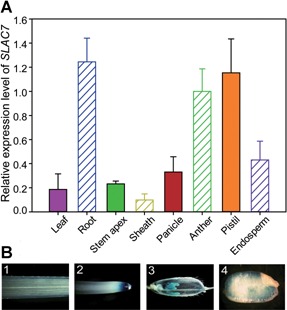
Expression pattern of SLAC7 (A) Relative expression levels of SLAC7 in different tissues (leaf, root, stem apex, sheath, panicle, anther, pistil, and endosperm). (B) β‐Glucuronidase staining analysis. 1–4 denote leaf, root, panicle, and endosperm, respectively.
Figure 2.
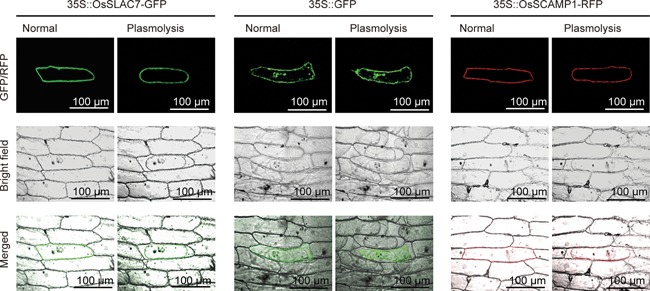
Subcellular localization of SLAC7 Subcellular localization of SLAC7‐GFP, GFP, and SCAMP1‐RFP in transformed onion epidermal cells. The plasmolysis of onion epidermal cells was induced by addition of 0.8 mol sucrose solution for 5 min.
Phenotype characterization of slac7‐1 mutant
A loss‐of‐function mutant of SLAC7 (herein referred to as slac7‐1) was obtained from our T‐DNA insertion mutant library, and the T‐DNA was inserted at 124 bp upstream of the ATG codon (Figure 3A). The segregation ratio in the T1 family of 20 plants (normal : abnormal = 14:6, χ 2 = 0.237 for 3:1) suggested that the phenotypes were caused by a recessive mutation of a single Mendelian locus (Figure 3B). Compared with the wild‐type plants, the homozygous mutants of the T1 generation showed defects in leaf development, including plant height, and leaf morphology (leaf curl or leaf fusion) (Figures 3C–F, S2). There were 4–8 curled leaves and 2–5 fused leaves in an individual slac7‐1 plant. Additionally, the heading stage of slac7‐1 (as determined by a 90% earing rate) was delayed by 7–9 d compared with the wild type (Figure 3G). The curled leaves and sheaths restrained the secondary branches from growing out (Figure 3H), but no significant difference in fertility was observed between slac7‐1 and the wild type (Figure S3).
Figure 3.
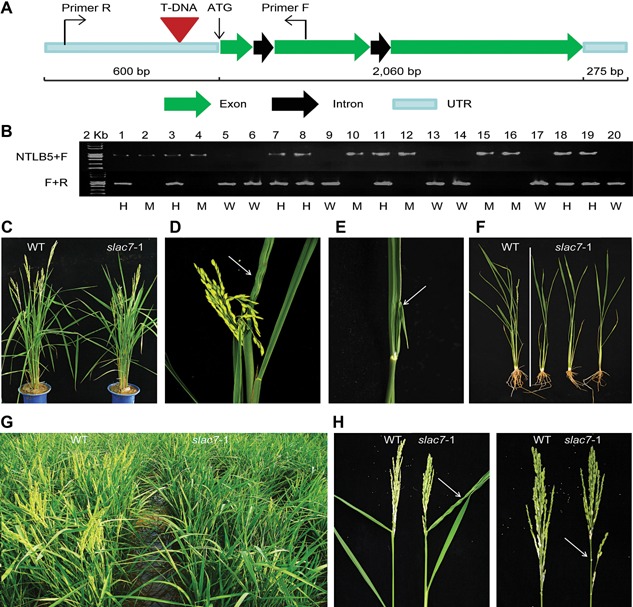
T‐DNA mutant screening (A) Location of T‐DNA insertion. (B) The polymerase chain reaction genotyping of slac7‐1 segregants in the T1 generation. All plants homozygous for T‐DNA insertion were positive for the band with NTLB5+F primers and negative with F+R primers, and had the developmental phenotypes of slac7‐1 (M). All wild‐type plants (W) for T‐DNA insertion were positive for the band with F+R primers and negative with NTLB5+F primers, and plants heterozygous for T‐DNA insertion were positive for both bands and had normal phenotypes. (C) slac7‐1 mutants were shorter than the wild type. (D) Crispation of leaves in slac7‐1 plants. (E) Leaf fusion in slac7‐1 plants. (F) Root length of slac7‐1 was shorter than that of wild‐type. (G) Heading stage of slac7‐1 was delayed by 7–9 d. (H) slac7‐1 panicle type.
To further investigate the leaf development of slac7‐1, paraffin sectioning was used to investigate the leaf anatomical structure throughout the leaf development process. Parenchyma cells were ruptured to form air cavities during the trefoil stage in slac7‐1 leaves, which occurred earlier than in the wild‐type leaves. In slac7‐1, larger leaf veins and curled leaves were most clearly observed at the seven leaf stage, and many more air cavities were formed in the leaves and sheaths of slac7‐1 (∼5–6) compared with in the wild type (2) (Figure 4A). The leaf fusion phenotype started to appear at the 12 leaf stage (Figure 4B).
Figure 4.
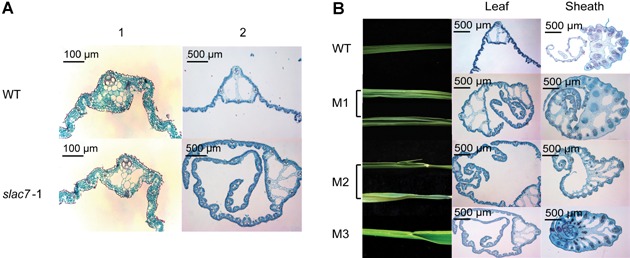
Leaf heteromorphosis of slac7‐1 (A) The development of air spaces in the slac7‐1 plants than in the wild‐type at different development stages. A1 and A2 indicate trefoil stage and seven leaf stage, respectively. (B) Observations of syncretic leaf by paraffin sections. M1, M2, and M3 show different degrees of fusion phenotype.
The chloroplast development in slac7‐1 leaves was monitored at different stages. As shown in Figure 5, from the trefoil stage to seven leaf stage, the number of starch grains accumulated in slac7‐1 chloroplasts continued to increase; and at the 12 leaf stage, many slac7‐1 chloroplasts were ruptured (Figures 5A, B, S4). Transcipts of many genes involved in chlorophyll metabolism (including degradation and synthesis) were upregulated in slac7‐1 leaves (Figure 5C). Consistently, the chlorophyll content of slac7‐1 leaves was significantly lower than that of wild type from the seven leaf stage (Figure 5D). The expression levels of two chlorophyll b reductase genes (NYC3 and NOL) were upregulated to eight fold. Importantly, the expression level of the gene related to chlorophyll and heme synthesis (HEMA1) was increased approximately to 2,000 fold, and the expression level of rbcs was increased to 22.6 fold. These results indicate that the degradation and synthesis of chlorophylls occurred concurrently in slac7‐1. As the state of chloroplast is closely related to photosynthetic features, we further determined the photosynthesis‐related indicators. It was found that the photosynthetic efficiency and Fv/Fm ratio of slac7‐1 leaves at the 12 leaf stage were decreased significantly (Figure 5E).
Figure 5.
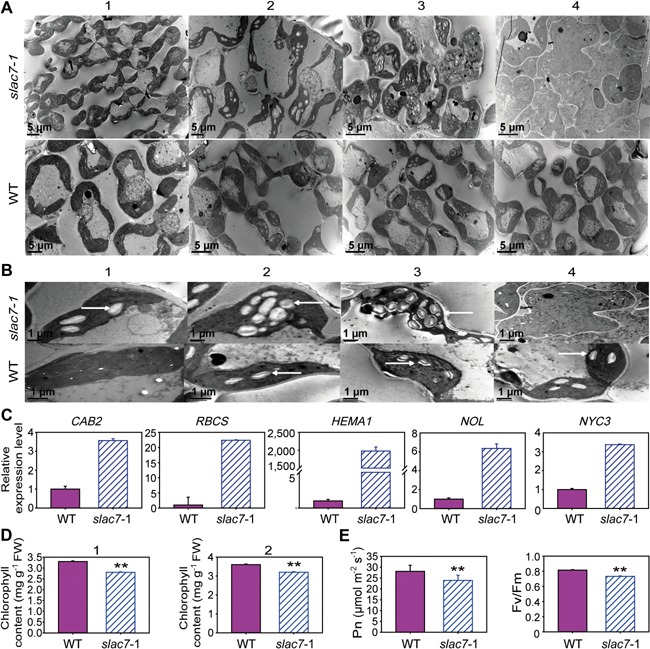
Abnormal chloroplast development in slac7‐1 (A) Chloroplast development in slac7‐1 and the wild type. 1–4 indicate four growth stages (trefoil stage, five leaf stage, seven leaf stage, and 12 leaf stage, respectively). (B) 1–4 indicate respective features of a1–a4. White arrows indicate starch grain. (C) Relative expression levels of genes involved in chlorophyll metabolism in slac7‐1 and the wild type. (D) The chlorophyll content of slac7‐1 and wild type. 1 and 2 indicate seven leaf stage and 12 leaf stage, respectively. (E) Photosynthetic features of slac7‐1 and wild type at 12 leaf stage. Data represent the mean values ± standard deviation of three independent experiments conducted with 30 different plants. Double asterisks denote a highly significant difference using Student's t‐test (P < 0.01)
In addition, at the 12 leaf stage, the leaf ion leakage in slac7‐1 mutant was more than two fold of that of the wild‐type leaves, indicating that slac7‐1 had less stable cell membranes (Figure S5A); the contents of leaf leakage indicators such as ABA and malondialdehyde (MDA) levels were increased significantly in slac7‐1 leaves as well (Figure S5B, C). In addition, the H2O2 content in slac7‐1 leaves was much higher than that in the wild‐type leaves (Figure S5D), which is in accordance with the results of the 3,3′‐diaminobenzidine‐tetrachloride (DAB) staining assays (Figure S6).
Phenotypes caused by knockdown of SLAC7
To further confirm the T‐DNA mutant phenotypes, artificial miRNA technology was used to suppress the expression of SLAC7 in ZH11. Positive transgenic plants were identified by PCR, and the expression levels of SLAC7 in these positive transgenic plants were tested by qRT‐PCR. The transgenic plants (amiR1 line) exhibited remarkably reduced expression levels of SLAC7 (Figure 6D). Suppression of SLAC7 expression caused similar phenotypes as slac7‐1 such as dwarf plants, curled leaves, and delayed heading stage (Figures 6A, B, S2). At the seven leaf stage, larger starch grains were accumulated in amiR1 chloroplasts and some chloroplasts were ruptured at the 12 leaf stage (Figures 6C, S7); the chlorophyll content, photosynthetic efficiency, and Fv/Fm ratio of SLAC7 amiRNA transgenic lines (amiR1, amiR3, and amiR6) were significantly lower than those of the wild type (Figure 6E–G). Besides, the ABA content and ion leakage rate of SLAC7 amiRNA transgenic lines were significantly higher than those of the wild type at the 12 leaf stage, but the increase occurred to a lesser extent than in slac7‐1 plants (Figure S8).
Figure 6.
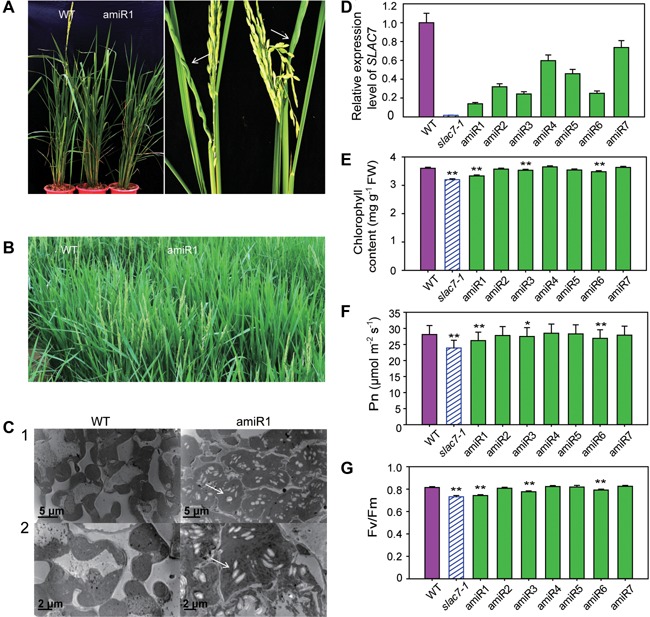
Suppression of SLAC7 expression causes similar phenotypes as slac7‐1 (A) Leaf form and plant height of the amiR1 line plants showed similar phenotypes as slac7‐1. (B) Heading stage of the amiR1 line was delayed approximately 8–12 d compared with the wild type. (C) The development of the chloroplasts in amiR1 plants. White arrows indicate starch grains. 1 and 2 indicate two growth stages (seven leaf stage and 12 leaf stage). (D) Relative expression levels of SLAC7 in amiRNA transgenic plants. (E) Chlorophyll content in SLAC7 amiRNA transgenic plants. (F) Photosynthetic efficency of SLAC7 amiRNA transgenic plants. (G) Fv/Fm ratio of SLAC7 amiRNA transgenic plants. Data represent the mean values ± standard deviation of three independent experiments conducted with different 8 week old plants. Double asterisks denote a highly significant difference using Student's t‐test (P < 0.01), single asterisk denotes a significant difference using Student's t‐test (0.01 < P < 0.05).
Complementation of slac7‐1
To determine the direct causal relationship between the slac7‐1 phenotypes and the knockout or knockdown of SLAC7, slac7‐1 plants were transformed with the entire open reading frame of SLAC7 driven by the SLAC7 promoter (1.5 kb of 5′‐untranslated region) by Agrobacterium tumefaciens‐mediated transformation (Lin and Zhang 2005). slac7‐1 plants transformed with empty pCAMBIA 2301 vector were used as controls. Northern blotting analysis was performed to determine the transcript level of SLAC7 in pC2301‐SLAC7‐positive transgenic plants (Figure 7C). The results showed that the expression of SLAC7 in slac7‐1 significantly rescued the defects in leaf development, plant height, chloroplast development, chlorophyll content, and photosynthesis features (Figures 7A, B, D, E, S2, S7). Moreover, the ABA contents and ion leakage of the leaves of pC2301‐SLAC7 transgenic plants were normal at the 12 leaf stage (Figure S9).
Figure 7.
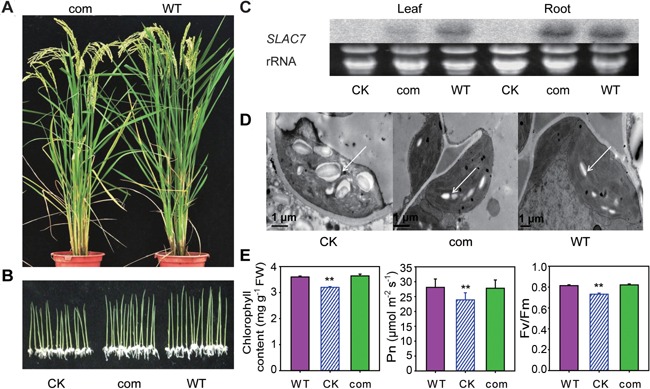
Complementation of slac7‐1 (A) pC2301+SLAC7 transgenic plants rescued the phenotype of slac7‐1. (B) pC2301+SLAC7 (com), control (CK), and wild type (WT) were germinated on Murashige–Skoog medium. (C) Expression levels of SLAC7 in leaf and root tested by northern blotting analysis. Total RNA was isolated from 30 d old plants. rRNA was used as a loading control. (D) Chloroplasts of pC2301+SLAC7 transgenic plants return to normal. White arrows indicate starch grain. (E) Chlorophyll content and photosynthetic features of pC2301+SLAC7 transgenic plants. Data represent the mean values ± standard deviation of three independent experiments conducted with different plants. Double asterisks denote a highly significant difference using Student's t‐test (P < 0.01).
Restoration of slac7‐1 phenotypes under dark conditions
When grown in the dark, the mutant plants showed almost normal phenotypes, suggesting that dark conditions can partially rescue the growth phenotypes such as that of plant height and root length (Figure 8A–C). In addition, the ABA content and leaf ion leakage in the mutants appeared to be normal (Figure 8D, E). After the wild‐type seedlings germinated under dark conditions were transferred to normal lighting conditions for 1 h, the relative expression level of SLAC7 was determined by qRT‐PCR. The results showed that in this process, the expression level of SLAC7 was increased to over two fold (Figure S10), suggesting that SLAC7 is a light‐responsive gene.
Figure 8.
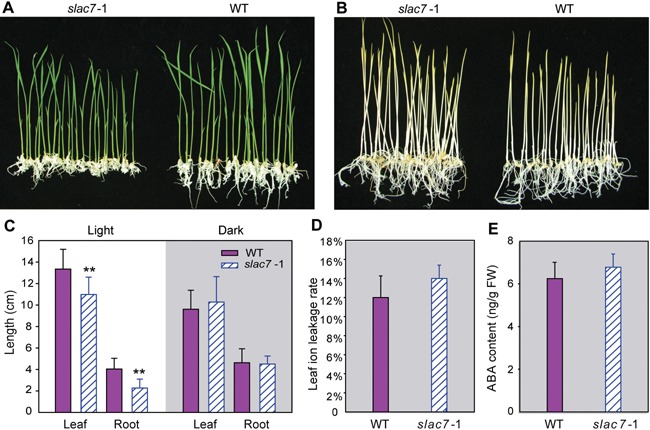
Damage to the chloroplasts of slac7‐1 can be eliminated under dark conditions (A) Mature seeds of slac7‐1 and wild type were germinated under light conditons. (B) Mature seeds of slac7‐1 and wild type were germinated under dark conditons. (C) Plant height and root length under light/dark conditions. (D) Leaf ion leakage rate of slac7‐1. (E) Abscisic acid content of slac7‐1 leaves under dark conditions. Data represent the mean values ± standard deviation of four independent experiments conducted with different plants. Double asterisks denote a significant difference using Student's t‐test (P < 0.01).
Microarray analysis of slac7‐1 leaves
Microarray analysis of slac7‐1 leaves was performed to determine genome‐wide gene expression changes in the mutant. In total, the expression of 1,178 genes was found to be changed more than three folds in the mutant compared with in the wild type, including 421 downregulated genes and 757 upregulated genes (Figures 9, S11; Tables S2, S3). Gene Ontology and MapMan software analysis showed that the knockout of SLAC7 mostly affected bioprocesses including stress response, regulation network (e.g. transcriptional factors, hormones), development, cell wall synthesis, and starch metabolism (Figures S11–17; Table S4). The expression changes were verified by qRT‐PCR for some genes, and the results are basically in agreement with the microarray data (Table S5).
Figure 9.
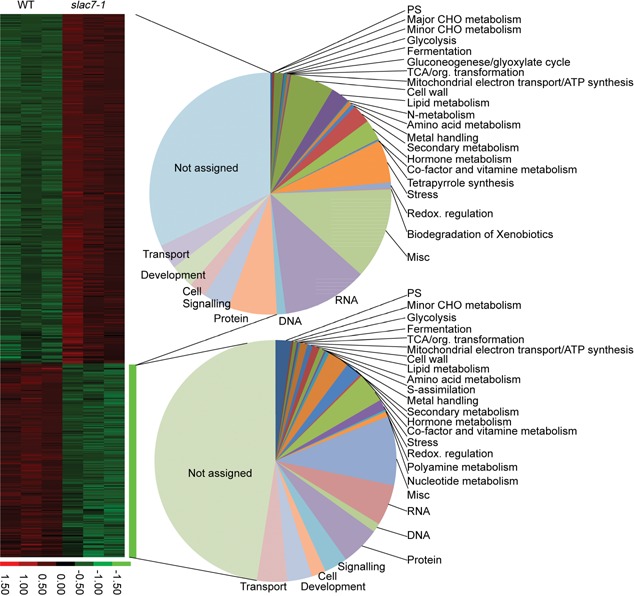
Clustering of the upregualted and downregulated genes Pie chart represents the Gene Ontology‐based functional categorization of differential expression genes.
Effects of SLAC7 overexpression on rice growth
In order to study the effects of SLAC7 overexpression, transgenic materials which harbored the full‐length SLAC7 cDNA driven by ubiquitin promoter of maize in Zhonghua11 (ZH11) were generated. The relative expression levels of SLAC7 in the leaves of the T0 generation transgenic plants were determined by qRT‐PCR. The results showed that the transcripts of SLAC7 in the positive transgenic plants were significantly increased (Figure 10A), but no significant difference was observed in chlorophyll content, photosynthetic efficiency, or Fv/Fm ratio (Figure 10B–D). In addition, leaf damage indicators (leaf ion leakage and ABA level) were not significantly different between positive and negative transgenic plants (Figure S18). These results indicated that overexpression of SLAC7 in rice does not significantly affect rice growth under normal growth conditions.
Figure 10.
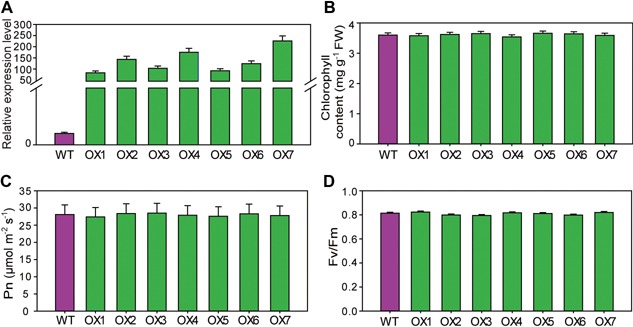
Overexpression of SLAC7 in rice (A) Relative expression levels of SLAC7 in the SLAC7‐overexpressing transgenic T0 plants. (B) Chlorophyll content of wild‐type and SLAC7‐overexpressing transgenic plants. (C) Photosynthetic efficency of wild‐type and SLAC7‐overexpressing transgenic plants. (D) Fv/Fm ratio of wild‐type and SLAC7‐overexpressing transgenic plants.
Functional complementation of slac1 mutants
To further investigate the function of SLAC7 protein, full‐length SLAC7 cDNA driven by the AtSLAC1 promoter was transformed into AtSLAC1 homozygous mutants (slac1‐1, slac1‐3). The result showed that SLAC7 could partially complement the phenotypes of slac1 mutants. The time of bolting occurrence of slac1 mutants was later than that of the wild type (Figure 11A), and SLAC7 could restore this phenotype to that of the wild type (Figure 11B). Stomatal conductance of slac1 mutants was significantly higher than that of the wild type, and slac1 mutants showed a lower response to the changes of CO2 concentration. Transformation of SLAC7 could reduce stomatal conductance to some extent but could not completely restore stomatal conductance to the level of the wild type. Besides, transformation of SLAC7 restored the response of stomata to the changes of CO2 concentration (400 to 800 p.p.m.), which could be confirmed by the significant decrease in stomatal conductance at 800 p.p.m. CO2 (Figure 11C).
Figure 11.
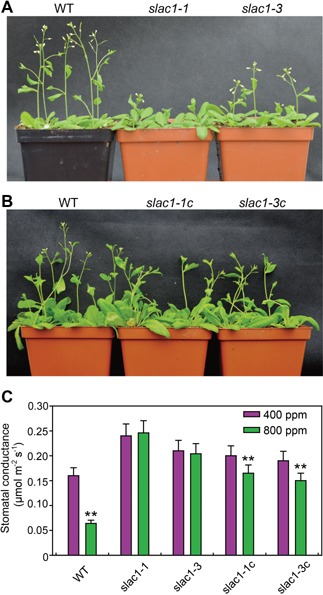
Functional complementation of slac1 mutants (A) The bolting speed of slac1 mutants is lower than that of the wild type. (B) SLAC7 restores the bolting speed of slac1 mutants to wild‐type levels. (C) Measurements of stomatal conductance under 400 p.p.m. and 800 p.p.m. CO2 concentration. slac1‐1c and slac1‐3c represent the complementation materials of slac1 mutants. Data represent the mean values ± standard deviation of six independent experiments conducted with different plants. Double asterisks denote a highly significant difference using Student's t‐test (P < 0.01).
DISCUSSION
Light is the main driving power of photosynthesis, but highly intense light is potentially dangerous and can damage photosynthetic components (Powles 1984). Protecting photosynthetic components from the damage caused by highly intense light is of primary importance in plants. In this study, we showed that SLAC7 is a membrane protein (Figure 2), and its expression is induced under light conditions (Figure S10). Loss of function of SLAC7 caused continuous chloroplast damage under normal light conditions, which induced a photoprotection mechanism in slac7‐1 plants.
Evolutionarily, SLAC‐like proteins can be classified into three subgroups, including the SLAC1 group, SLAH2/3 group and SLAH1/4 group (Dreyer et al. 2012), and SLAC7 belongs to the SLAH2/3 group. We have been trying to clarify the anion channel characteristics of SLAC7 protein using the two electrode voltage clamp technology in Xenopus oocytes. It was found that, similar to the Arabidopsis SLAC1, independent SLAC7 does not show anion channel characteristics. Because there are no research pioneers and available published works in rice, we chose the kinases (e.g. OST1) reported in Arabidopsis to activate SLAC7, but unfortunately we did not obtain expected repeatable results. Considering the differences between dicot plants and monocot plants, we speculated that using rice endogenous kinases to activate SLAC7 in rice may be more effective than using Arabidopsis kinases and the activation mechanism of rice SLAC7 may be different from that of Arabidopsis SLAC1. Although we have made much effort, we have not found the endogenous kinase which is the most suitable for activating SLAC7 in rice yet. However, SLAC7 can partially complement the phenotypes of slac1 mutants in Arabidopsis (Figure 11), suggesting that SLAC7 has similar anion transport functions as AtSLAC1. Therefore, SLAC7 is probably responsible for the transport of various anions in rice, and loss of SLAC7 function may change the membrane polarity or anion homeostasis in plant cells. It inevitably leads to the corresponding osmotic problems, which resulted in the chloroplast rupture in slac7‐1.
Importantly, we showed that the mutation of the gene causes continuous chloroplast injury under normal light conditions, while it has no effect in darkness (Figures 5, 8). Harmful substances (such as active oxygen) to chloroplasts are produced in the process of photosynthesis and a higher intensity of photosynthesis usually produces more active oxygen (Asada 1987). In this study, we found that H2O2 was accumulated in the chloroplasts of slac7‐1 under normal light conditions (Figures S5D, S6). Excess H2O2 further caused continuous damage to slac7‐1 chloroplasts. At the 12 leaf stage, many slac7‐1 chloroplasts were ruptured (Figure 5A, B). While under dark conditions, less harmful substances (such as active oxygen) were produced by photosynthesis, thus no indication of damage was detected in slac7‐1 under dark conditions and the plant height/root length of slac7‐1 was restored to the wild‐type level (Figure 8). Hence, we infer that photosynthesis caused the continuous damage in slac7‐1. Chloroplast rupture, decrease of photosynthetic efficiency, and Fv/Fm ratio are usually the signs of photoinhibition of photosynthesis in plants. However, the primary cause of chloroplast damage in slac7‐1 was not light stress. By analyzing the microarray data of slac7‐1, we found that many differentially expressed genes were involved in almost all the abiotic stress response pathways (heat, cold, drought, salt, wounding) except the light stress pathway (Figure S13), which further confirms that the primary cause of chloroplast damage in slac7‐1 is the aberrant internal environment of the cell. Therefore, our results suggest that SLAC7 protein function of anion transport is essential for maintaining the stability of chloroplasts.
Many biotic and abiotic stresses (such as heat, cold, drought, salt, and wounding) can cause chloroplast damage in plants (Price et al. 1989; Chang et al. 2004; Gao et al. 2007; Wang et al. 2010; Zhao et al. 2010; Gong et al. 2014). Therefore, damage in chloroplasts can also cause similar responses to biotic and abiotic stresses. According to the microarray data of slac7‐1, a mass of differentially expressed genes participate in the pathways of responses to biotic and abiotic stresses (Figures S13, S14). The synthesis of starch is closely related to the stress responses in plants (Rhodes 1987). In the ethylene‐triggered flooding‐response mechanism, a large reserve of starch ensures sufficient ATP for a longer period of growth (Bailey‐Serres and Voesenek 2010). In this study, accumulation of large starch grains in chloroplasts is an obvious phenotype of slac7‐1 (Figures 5, S4). Microarray data analysis showed that adjustments existed in the metabolism of sucrose and starch. Expression levels of sucrose synthase (LOC_Os03g28330) and alpha‐amylase precursor (LOC_Os08g36910) were significantly increased in slac7‐1 leaves (Supplemental Table S5). Sucrose synthase (SUS) is an enzyme in cytoplasm which can reversibly catalyze the conversion of sucrose and a nucleoside diphosphate into the corresponding nucleoside diphosphate‐glucose and fructose (Li et al. 2013). SUS determines the directions of sucrose metabolism. It has been proved that there is a close connection between starch biosynthesis and SUS in cellulose (Baroja‐Fernández et al. 2012). Alpha‐amylase is an important member in starch degradation which can convert starch into glucose for ATP production. The growth of slac7‐1 was a process of response to chloroplast damage, which consumed a large amount of energy. Hence, accumulation of starch grains is most likely due to the energy demand for acclimatizing to chloroplast damage in slac7‐1.
Plants can respond to photoinhibition by modulating leaf form or leaf trichome growth, which can decrease the absorption of light (Ludlow and Björkman 1984; Powles 1984; Ehleringer 1988). Leaf curling/fusing or more leaf trichomes can effectively decrease the light absorption. Interestingly, leaf curling and fusing are important phenotypes of slac7‐1 (Figure 3D, E), and the leaf trichome numbers of slac7‐1 leaves were significantly more than that of the wild‐type leaves (Figure S19). Thus, it can be seen that chloroplast damage induced similar responses to photoinhibition in slac7‐1 plants. The microarray data of slac7‐1 showed that a mass of differentially expressed genes were involved in cell wall synthesis and development (Figures S12–S15). Besides, significant adjustments were made in the regulation of gene expression and hormone metabolism in slac7‐1. The expression levels of many transcriptional factors (e.g. bHLH, MYB, NAC, WRKY, KNOX) and genes related to hormone metabolism (IAA, ABA, BA, ethylene, cytokinin, SA, GA) were significantly altered in slac7‐1 (Figures S15, S16). Thus, it can be inferred that many transcriptional factors and hormones participate in the process of modulating leaf form and leaf trichome growth.
It has been proved that cytokinins are involved in cell division, light‐regulated chloroplast differentiation (Mok and Mok 1994, 2001), and also in nutrient starvation and recovery response (Sakakibara et al. 1998; Martín et al. 2000). Cytokinins participate in the regulation of many important aspects of plant development in aerial and subterranean organs (Werner and Schmülling 2009). Synergy between cytokinins and transcriptional factor (KNOX) can control the differentiation of meristematic tissues and the morphogenesis of apparatuses. A previous research has shown that the expression levels of KNOX genes can be regulated positively by cytokinins (Tsuda et al. 2011). In this study, it was found that the genes involved in cytokinin metabolism and signaling, including adenosine phosphate‐isopentenyltransferase (IP240, IP570, IP840), A‐type response regulator (AR440), and cytokinin oxidase (CK040, CK110, CK230, CK860), were also upregulated, and the content of the active cytokinin isopentenyladenosine (IPA) was increased in slac7‐1 leaves accordingly (Figures S20, S21). The extremely abnormal leaf development (leaf fusion) detected in slac7‐1 is similar to that of the rice with ectopic overexpression of KNOX genes (Sentoku et al. 2000; Nagasaki et al. 2001). In the present study, several KNOX genes (LOC_Os03g10210, LOC_Os02g43330, and LOC_Os03g51690) were upregulated in slac7‐1 leaves (Table S5). Therefore, it can be speculated that the abnormal leaf development is an important part of the photoprotection mechanism in slac7‐1 which involves phytohormones and gene activation, while delayed heading stage (Figure 3G) is a side‐effect of the abnormal hormones levels.
In brief, loss of SLAC7 function changes the internal environment of plant cells and reduces the stability of chloroplasts, which causes light‐triggered damage to chloroplasts. The synergy between plant hormones (e.g. cytokinins) and transcriptional factors can promote a photoprotection mechanism to reduce the absorption of light by modulating leaf form or leaf trichome growth, which reduces the degree of chloroplast damage in slac7‐1.
MATERIALS AND METHODS
Plant materials, growth conditions, and genotyping of slac7‐1 mutant plants
The japonica rice cultivar ZH11 was used as the transformation recipient in this study. Seeds of mutant slac7‐1 (ZH11 background, 04Z11HU78) were acquired from the T‐DNA insertion mutant library (RMD, http://rmd.ncpgr.cn/) of our laboratory (Wu et al. 2003; Zhang et al. 2006). A pair of genome‐specific primers flanking the T‐DNA insertion site and a primer on the T‐DNA left border were used to identify the genotype of the slac7‐1 mutants by PCR. Both the mutant and transgenic plants were planted in the greenhouse (14 h light/10 h dark) before being transferred to the field (Wuhan). Arabidopsis slac1 mutants (slac1‐1, slac1‐3) were cultivated at 21 °C in a growth chamber with a 16 h light/8 h dark cycle.
Plasmid construction and rice transformation
The SLAC7 artificial miRNAs (amiR‐SLAC7) were generated to repress SLAC7 in rice following the strategy described previously (Warthmann et al. 2008). The Web MicroRNA Designer platform (WMD) was used to design the 21 mer sequence targeting to the ORF of SLAC7 which was used to replace the miRNA and miRNA* in the osa‐MIR528 skeleton (Ossowski et al. 2008). The resulting artificial miRNAs were then inserted into overexpression vector pU1301.
A 4.1 kb genomic DNA fragment containing the complete SLAC7 coding region and the 2 kb upstream putative promoter was isolated and subcloned into the vector pCAMBIA2301 to perform the complementation test. The generated construct (pC2301‐SLAC7) was introduced into the homozygous slac7‐1 mutant plants, and an empty pCAMBIA2301 vector was also transformed as a control.
To create the overexpression construct of SLAC7, the full‐length cDNA of SLAC7 was obtained from the Knowledge‐based Oryza Molecular Biological Encyclopedia Database (KOME, http://cdna01.dna.affrc.go.jp/cDNA/), and was used as PCR template. The SLAC7 coding region was amplified with KpnI‐BamHI (indicated by underlined letters) primers. The sequence‐confirmed SLAC7 fragment was cloned into pU1301 and then transformed into ZH11.
To examine the expression pattern of SLAC7, the 1,939 bp genomic DNA sequence corresponding to the predicted SLAC7 promoter was amplified and cloned into the destination vector PHX135 (SLAC7P‐PHX135).
To investigate the functional complementation of Arabidopsis slac1 mutants, a fusion fragment including the 1.54 kb putative AtSLAC1 promoter and SLAC7 open reading frame (ORF) was inserted into pCAMBIA2301. The generated transformation plasmid was transformed into slac1 mutants.
The constructs were transformed into rice and Arabidopsis by a Agrobacterium‐mediated genetic transformation procedure using the EHA105 strain (Lin and Zhang 2005; Zhang et al. 2006b).
Quantification of gene expression
Rice leaves were ground in liquid nitrogen, and the total RNAs were isolated using the TRIzol reagent (Invitrogen, Carlsbad, CA, USA). The DNase I‐treated RNA was reverse transcribed using Superscript III reverse transcriptase (Invitrogen) to produce cDNA templates according to the manufacturer's instructions. Quantitative RT–PCR was performed with an ABI PRISM 7500 real‐time PCR system (Applied Biosystems) on the optical 96‐well plates using SYBR Premix Ex Taq (Takara). The rice Ubiquitin gene (LOC_Os03g13170) was used as an endogenous control, and the relative expression levels were determined according to the previous description (Livak and Schmittgen 2001). Northern blotting analysis was performed as described previously (Lu et al. 2003).
The sequences of the primers used in this study are listed in Table S5.
Subcellular localization of SLAC7 protein
To investigate the subcellular localization of SLAC7, the coding region of SLAC7 was amplified and inserted into a pM999‐35S‐EGFP vector to generate a SLAC7:GFP fusion construct. The 35S::SLAC7:GFP, 35S::GFP (negative control) or 35S::SCAMP1:RFP (positive control) (Lam et al. 2007) were separately bombarded into onion epidermal cells using the PDS‐1000/He Biolistic Particle Delivery system (Bio‐Rad, Richmond, CA, USA). The fluorescence signals were observed and captured with confocal laser‐scanning microscopy (TCS SP2; Leica Microsystems, Wetzlar, Germany) after the transformed onion epidermises were cultured for 24 h in the dark at 28 °C. The plasmolysis of onion epidermal cells was induced by the addition of 0.8 mol sucrose solution for 5 min.
Histocytological analysis
Tissues/organs from the SLAC7P‐PHX135 transgenic plants at different developmental stages throughout the whole life‐cycle were used for GUS staining analysis. Tissues were cut into pieces of approximately 1 cm, and then soaked in staining solution (50 mmol/L sodium phosphate at pH 7.0, 10 mmol/L ethylenediaminetetraacetic acid, 0.1% Triton X‐100, 1 mg/mL of X‐Gluc, 100 μg/mL of chloramphenicol, 1 mmol/L potassium ferricyanide, and 20% methanol) for 24 h at 37 °C. Ethanol (70%) was used to discolor the chlorophyll in the tissues. β‐Glucuronidase images were then taken using a fluorescence stereomicroscope (MZ FLIII; Leica).
To observe the development of chloroplasts of rice plants, leaves at different growth stages (trefoil stage, five leaf stage, nine leaf stage and 12 leaf stage) from slac7‐1 mutant and ZH11 were cut into pieces (1 mm × 1 mm) and fixed in the mixture of 4% paraformaldehyde and 0.5% glutaraldehyde for a week at 4 °C. The fixed samples were embedded and ultramicro‐cut, and the sections were observed and photographed by a transmission electron microscope (H‐7650; Hitachi, Tokyo, Japan) and the detailed procedure was described previously (Zhang et al. 2015).
To examine the leaf structure of rice plants, leaves at different development stages (trefoil stage, early tillering stage, and late tillering stage) from slac7‐1 mutant and ZH11 were cut into pieces and fixed with 70% FAA fixation fluid (absolute ethyl alcohol : formaldehyde : glacial acetic acid : water = 14:2:1:3, v/v/v/v). The samples were embedded by paraffin, and the microtome sections were stained with 1% sarranine (2–3 min) and 1% fast green (1–3 min). A microscope (MZ FLIII; Leica) was used to observe and image the leaf structure after the sections were mounted on glass slides. The detailed procedure was described previously (Chen et al. 2014).
Physiological measurements
For chlorophyll content determination, approximately 100 mg of leaves were cut into pieces and immersed in extract solution (45% ethanol, 45% acetone, 10% H2O) at room temperature. After the leaves were bleached, the absorbance of the extracts was examined at 647 nm and 665 nm. Total chlorophyll content was calculated as previously described (Inskeep and Bloom 1985). Measurement of ion leakage rate was performed following the procedure described previously (Cao et al. 2007). Quantitative measurements of MDA and H2O2 (hydrogen peroxide) production were carried out using kits supplied by Nanjing Jiancheng Bioengineering Institute. The extraction and determination procedures were performed following the manufacturer's instructions (www.njjcbio.com). The total contents of H2O2 and MDA were calculated and indicated as nmol g−1 fresh weight (FW) and nmol g−1 FW, respectively. Hydrogen peroxide content was also visually detected by a DAB staining method as described previously (Ouyang et al. 2010). Photosynthetic efficiency was measured in the greenhouse using the Ciras‐II Portable Photosynthesis System (CIRAS‐II; PP Systems, Hitchin, UK). The photosynthetic chamber provided a leaf area of 2.5 cm2, a leaf temperature of 25°C, a relative humidity of 90%, a leaf‐to‐air vapor pressure of 200 mbar, and a CO2 concentration of 380 µmol/mol. Other detailed procedures were described previously (Yang et al. 2010). The leaf conductance (gs) was also monitored by the CIRAS‐II system. The photosynthetic chamber provided a leaf area of 2.5 cm2, a photosynthetically active radiation (PAR) of 150 µmol m−2 s−1, a leaf temperature of 21 °C, a relative humidity of 60%, a leaf‐to‐air vapor pressure of 200 mbar, and the measurements were performed at CO2 levels of 400 and 800 µmol/mol. Other detailed procedures were described previously (Wang et al. 2011). Arabidopsis plants were cultured in a room where the environmental conditions were finely controlled. Chlorophyll fluorescence parameter (Fv/Fm ratio) was measured by a portable chlorophyll fluorometer (PAM‐2500; Heinz Walz, Effeltrich, Germany) and the determination method was described previously (Giorio 2011).
Microarray analysis
Three independent homozygous slac7‐1 mutant lines and three independent wild types (WT) segregated from the heterozygous mutants were selected for microarray analysis. RNA samples from the flag leaves of slac7‐1 mutant and WT were extracted using TRIzol reagent (Invitrogen). Expression measurement for each probe set was performed by employing the robust multi‐array average (RMA) method in R environment (http://www.R‐project.org) with Bioconductor Affy package (Bolstad et al. 2003; Irizarry et al. 2003; Gautier et al. 2004; Gentleman et al. 2004).
The data were filtered to remove those probe sets without expression in any sample using the MAS5 algorithm. Only those probe sets that were called “present” in at least two of three replicates for at least one sample were included for further analysis. Ambiguous probe sets and bacterial controls were also removed. There were 23,569 “present” probe sets in the mutant and 21,689 “present” probe sets in WT plants, and 21,006 “present” probe sets were shared by the mutant and the WT plants.
Statistically significant differential gene expression was determined using two different bioconductor packages, Limma (Smyth 2005) and RankProd (Hong et al. 2006), which addressed this issue from different angles. To identify the statistically significant differentially expressed genes, a combined criterion of two fold or more change and q value of 0.05 or less was adopted, and the results from the two methods were merged together.
For annotating the identified differentially expressed genes, the information provided by the Affymetrix NetAffx website (http://www.affymetrix.com/analysis/index.affx), the HarvEST program (http://www.harvest-web.org), and NSF rice oligonucleotide array project (http://www.ricearray.org/) was used for transcript assignments. Gene Ontology annotations for differentially regulated transcripts were retrieved from Affymetrix NetAffx website (http://www.affymetrix.com/analysis/index.affx), or using the HarvEST program (http://www.harvest-web.org). Further annotations of the differentially regulated genes were derived from TIGR Rice Genome Annotation (http://rice.plantbiology.msu.edu) and Gramene (www.gramene.org). Gene Ontology (GO) enrichment analysis for each time point was performed using the GOEAST program (Zheng and Wang 2008), which applies a hypergeometric test and adjusts the raw P‐values to FDR using the Benjamini–Yekutieli method (Benjamini and Yekutieli 2001).
The microarray data produced from this study are deposited in the National Center for Biotechnology Information GEO database under the accession number GSE53858. Cluster statistics of the 1,178 up‐ and downregulated genes were supplied by CapitalBil Corporation (Beijing, China). Mapman software was used to visualize the changes of these differentially expressed genes in metabolic pathways.
Quantification of plant hormones
The leaves and root tips of ZH11 and the homozygous mutants were sampled 4 weeks after sowing for hormone content measurements. The samples were ground in liquid nitrogen and extracted by cold extraction buffer at –20 °C overnight. The samples were then analyzed in three technical repeats, each using 1 g (FW) of sample and 10 ng of each internal standard. The extraction buffer contained methanol, water, and formic acid (15:4:1, v/v/v), and the extraction was performed on the basis of the method described previously (Dobrev and Kaminek 2002).
Supporting information
Additional supporting information may be found in the online version of this article at the publisher's web‐site.
Figure S1. Ten predicted transmembrane regions of SLAC7 protein
Figure S2. Plant height of different transgenic plants (slac7‐1, amiR1, com).
Figure S3. Pollen starch staining shows normal slac7‐1 fertility
Figure S4. Starch grain number of each chloroplast of slac7‐1 and wild‐type leaves at different development stages.
Figure S5. slac7‐1 leaves were severely damaged
Figure S6. 3,3′‐Diaminobenzidine‐tetrachloride (DAB) staining of slac7‐1 and wild‐type leaves
Figure S7. Starch grain number of each chloroplast of different transgenic plants (aimR1, com) at seven leaf stage.
Figure S8. Leaves of SLAC7 amiRNA transgenic plants were severely damaged
Figure S9. Complementation of slac7‐1
Figure S10. Expression level of SLAC7 tested by northern blot and quantitative reverse transcription polymerase chain reaction (qRT‐PCR)
Figure S11. Log‐Log scatter plot of significant differentially expressed genes in slac7‐1 plants
Figure S12. Microarray analysis of the differential expression genes in whole metabolism using MapMan softwoare (version 3.6.0RC1)
Figure S13. Microarray analysis of the differential expression genes in cellular response using MapMan softwoare (version 3.6.0RC1)
Figure S14. Microarray analysis of the differential expression genes in stress response using MapMan softwoare (version 3.6.0RC1)
Figure S15. Microarray analysis of the differential expression genes in regulation network using MapMan softwoare (version 3.6.0RC1)
Figure S16. Microarray analysis of the differential expression genes in transcription network using MapMan softwoare (version 3.6.0RC1)
Figure S17. Microarray analysis of the differential expression genes in sucrose and starch using MapMan softwoare (version 3.6.0RC1)
Figure S18. Abscisic acid (ABA) level and leaf ion leakage rate of SLAC7 overexpression transgenic plants
Figure S19. The leaf trichome numbers of different transgenic plants
Figure S20. Relative expression level of cytokinin metabolism related genes in slac7‐1 leaves
Figure S21. Relavtive content of isopentennyladenine in slac7‐1 and wild‐type leaves
Table S1. Primer sequences
Table S2. Upregulated genes in slac7‐1 leaves
Table S3. Downregulated genes in slac7‐1 leaves
Table S4. Gene Ontology analysis of differentially expressed genes
Table S5. Quantitative reverse transcription polymerase chain reaction (qRT‐PCR) verification of the differentially expressed genes initially identified by microarray analysis
Table S6. Primers used in the quantitative reverse transcription polymerase chain reaction (qRT‐PCR) experiments
ACKNOWLEDGEMENTS
We would like to thank Dr Julian I. Schroeder (UCSD Novartis Torrey Mesa Institute in Plant Science) for supplying Arabidopsis slac1 mutants. We are grateful to Jian Xu, Yinglong Cao, and Lei Wang (Huazhong Agricultural University) for providing plasmids pM999‐35, pU1301. We thank Dr Daoxiu Zhou for providing helpful suggestions for the manuscript; Xianghua Li for technical assistance; Huazhi Song for kind assistance with the confocal scanning laser microscopy; Dongqin Li for kindly helping in the gas chromatography–mass spectrometry expreiments; and Jianbo Cao for kindly helping in the observation of chloroplast development by scanning transmission electron microscope. This research was funded by the National High Technology Research and Development Program of China (863 Program), the National Program of Transgenic Variety Development of China, and the National Natural Science Foundation of China.
Fan X, Wu J, Chen T, Tie W, Chen H, Zhou F, Lin Y ( 2015) Loss‐of‐function mutation of rice SLAC7 decreases chloroplast stability and induces a photoprotection mechanism in rice. J Integr Plant Biol 57: 1063–1077
Available online on Mar. 4, 2015 at www.wileyonlinelibrary.com/journal/jipb
REFERENCES
- Asada K, Takahashi M ( 1987) Production and Scavenging of Active Oxygen in Photosynthesis. Photoinhibition. Elsevier, Amsterdam: [Google Scholar]
- Bailey‐Serres J, Voesenek LA ( 2010) Life in the balance: A signaling network controlling survival of flooding. Curr Opin Plant Biol 13: 489–494 [DOI] [PubMed] [Google Scholar]
- Bearden AJ, Malkin R ( 1975) Primary photochemical reactions in chloroplast photosynthesis. Q Rev Biophys 7: 131–177 [DOI] [PubMed] [Google Scholar]
- Benjamini Y, Yekutieli D ( 2001) The control of the false discovery rate in multiple testing under dependency. Ann Stat 29: 1165–1188 [Google Scholar]
- Cao WH, Liu J, He XJ, Mu RL, Zhou HL, Chen SY, Zhang JS ( 2007) Modulation of ethylene responses affects plant salt‐stress responses. Plant Physiol 143: 707–719 [DOI] [PMC free article] [PubMed] [Google Scholar]
- Chang CCC, Ball L, Fryer MJ, Baker NR, Karpinski S, Mullineaux PM ( 2004) Induction of ASCORBATE PEROXIDASE 2 expression in wounded Arabidopsis leaves does not involve known wound‐signalling pathways but is associated with changes in photosynthesis. Plant J 38: 499–511 [DOI] [PubMed] [Google Scholar]
- Chen T, Zhu X‐G, Lin Y ( 2014) Major alterations in transcript profiles between C3‐C4 and C4 photosynthesis of an amphibious species Eleocharis baldwinii. Plant Mol Biol 86: 93–110 [DOI] [PubMed] [Google Scholar]
- Dobrev PI, Kaminek M ( 2002) Fast and efficient separation of cytokinins from auxin and abscisic acid and their purification using mixed‐mode solid‐phase extraction. J Chromatogr A 950: 21–29 [DOI] [PubMed] [Google Scholar]
- Dreyer I, Gomez‐Porras JL, Riaño‐Pachón DM, Hedrich R, Geiger D ( 2012) Molecular evolution of slow and quick anion channels (SLACs and QUACs/ALMTs). Front Plant Sci 3: 263 [DOI] [PMC free article] [PubMed] [Google Scholar]
- Ehleringer JR ( 1988) Changes in leaf characteristics of species along elevational gradients in the Wasatch Front, Utah. Am J Bot 75: 680–689 [DOI] [PubMed] [Google Scholar]
- Gao JP, Chao DY, Lin HX ( 2007) Understanding abiotic stress tolerance mechanisms: Recent studies on stress response in rice. J Integr Plant Biol 49: 742–750 [Google Scholar]
- Giorio P ( 2011) Black leaf‐clips increased minimum fluorescence emission in clipped leaves exposed to high solar radiation during dark adaptation. Photosynthetica 49: 371–379 [Google Scholar]
- Gong X, Su Q, Lin D, Jiang Q, Xu J, Zhang J, Teng S, Dong Y ( 2014) The rice OsV4 encoding a novel pentatricopeptide repeat protein is required for chloroplast development during the early leaf stage under cold stress. J Integr Plant Biol 56: 400–410 [DOI] [PubMed] [Google Scholar]
- Hong F, Breitling R, McEntee CW, Wittner BS, Nemhauser JL, Chory J ( 2006) RankProd: A bioconductor package for detecting differentially expressed genes in meta‐analysis. Bioinformatics 22: 2825–2827 [DOI] [PubMed] [Google Scholar]
- Inskeep WP, Bloom PR ( 1985) Extinction coefficients of chlorophyll a and b in N, N‐dimethylformamide and 80% acetone. Plant Physiol 77: 483–485 [DOI] [PMC free article] [PubMed] [Google Scholar]
- Krause G, Weis E ( 1991) Chlorophyll fluorescence and photosynthesis: The basics. Annu Rev Plant Biol 42: 313–349 [Google Scholar]
- Kusumi K, Hirotsuka S, Kumamaru T, Iba K ( 2012) Increased leaf photosynthesis caused by elevated stomatal conductance in a rice mutant deficient in SLAC1, a guard cell anion channel protein. J Exp Bot 10: 1093 [DOI] [PMC free article] [PubMed] [Google Scholar]
- Laanemets K, Wang YF, Lindgren O, Wu J, Nishimura N, Lee S, Caddell D, Merilo E, Brosche M, Kilk K ( 2013) Mutations in the SLAC1 anion channel slow stomatal opening and severely reduce K+ uptake channel activity via enhanced cytosolic [Ca2+] and increased Ca2+ sensitivity of K+ uptake channels. New Phytol 197: 88–98 [DOI] [PMC free article] [PubMed] [Google Scholar]
- Lam SK, Siu CL, Hillmer S, Jang S, An G, Robinson DG, Jiang L ( 2007) Rice SCAMP1 defines clathrin‐coated, trans‐Golgi‐located tubular‐vesicular structures as an early endosome in tobacco BY‐2 cells. Plant Cell 19: 296–319 [DOI] [PMC free article] [PubMed] [Google Scholar]
- Lin Y, Zhang Q ( 2005) Optimising the tissue culture conditions for high efficiency transformation of indica rice. Plant Cell Rep 23: 540–547 [DOI] [PubMed] [Google Scholar]
- Livak KJ, Schmittgen TD ( 2001) Analysis of relative gene expression data using real‐time quantitative PCR and the 2−ΔΔCT method. Methods 25: 402–408 [DOI] [PubMed] [Google Scholar]
- Lu H, Rate DN, Song JT, Greenberg JT ( 2003) ACD6, a novel ankyrin protein, is a regulator and an effector of salicylic acid signaling in the Arabidopsis defense response. Plant Cell 15: 2408–2420 [DOI] [PMC free article] [PubMed] [Google Scholar]
- Ludlow MM, Björkman O ( 1984) Paraheliotropic leaf movement in Siratro as a protective mechanism against drought‐induced damage to primary photosynthetic reactions: Damage by excessive light and heat. Planta 161: 505–518 [DOI] [PubMed] [Google Scholar]
- Martín AC, Del Pozo JC, Iglesias J, Rubio V, Solano R, De La Peña A, Leyva A, Paz‐Ares J ( 2000) Influence of cytokinins on the expression of phosphate starvation responsive genes in Arabidopsis . Plant J 24: 559–567 [DOI] [PubMed] [Google Scholar]
- Mok DW, Mok MC ( 1994) Cytokinins: Chemistry, Activity, and Function. CRC Press, Boca Raton: pp. 1–15 [Google Scholar]
- Mok DW, Mok MC ( 2001) Cytokinin metabolism and action. Annu Rev Plant Biol 52: 89–118 [DOI] [PubMed] [Google Scholar]
- Negi J, Matsuda O, Nagasawa T, Oba Y, Takahashi H, Kawai‐Yamada M, Uchimiya H, Hashimoto M, Iba K ( 2008) CO2 regulator SLAC1 and its homologues are essential for anion homeostasis in plant cells. Nature 452: 483–486 [DOI] [PubMed] [Google Scholar]
- Niyogi KK ( 1999) Photoprotection revisited: Genetic and molecular approaches. Annu Rev Plant Biol 50: 333–359 [DOI] [PubMed] [Google Scholar]
- Ossowski S, Schwab R, Weigel D ( 2008) Gene silencing in plants using artificial microRNAs and other small RNAs. Plant J 53: 674–690 [DOI] [PubMed] [Google Scholar]
- Ouyang SQ, Liu YF, Liu P, Lei G, He SJ, Ma B, Zhang WK, Zhang JS, Chen SY ( 2010) Receptor‐like kinase OsSIK1 improves drought and salt stress tolerance in rice (Oryza sativa) plants. Plant J 62: 316–329 [DOI] [PubMed] [Google Scholar]
- Powles SB ( 1984) Photoinhibition of photosynthesis induced by visible light. Annu Rev Plant Physiol 35: 15–44 [Google Scholar]
- Price AH, Atherton NM, Hendry GA ( 1989) Plants under drought‐stress generate activated oxygen. Free Radical Res 8: 61–66 [DOI] [PubMed] [Google Scholar]
- Rhodes D ( 1987) Metabolic responses to stress. Biochem Plant 12: 201–241 [Google Scholar]
- Sakakibara H, Suzuki M, Takei K, Deji A, Taniguchi M, Sugiyama T ( 1998) A response‐regulator homologue possibly involved in nitrogen signal transduction mediated by cytokinin in maize. Plant J 14: 337–344 [DOI] [PubMed] [Google Scholar]
- Smyth GK ( 2005) Limma: Linear models for microarray data In: Gentleman R, Carey VJ, Huber W, Irizarry RA, Dudoit S, eds. Bioinformatics and computational biology solutions using R and Bioconductor. Springer, pp. 397–420 [Google Scholar]
- Takahashi S, Badger MR ( 2011) Photoprotection in plants: A new light on photosystem II damage. Trends Plant Sci 16: 53–60 [DOI] [PubMed] [Google Scholar]
- Tsuda K, Ito Y, Sato Y, Kurata N ( 2011) Positive autoregulation of a KNOX gene is essential for shoot apical meristem maintenance in rice. Plant Cell 23: 4368–4381 [DOI] [PMC free article] [PubMed] [Google Scholar]
- Vahisalu T, Kollist H, Wang YF, Nishimura N, Chan WY, Valerio G, Lamminmäki A, Brosché M, Moldau H, Desikan R ( 2008) SLAC1 is required for plant guard cell S‐type anion channel function in stomatal signalling. Nature 452: 487–491 [DOI] [PMC free article] [PubMed] [Google Scholar]
- Wang HS, Yu C, Tang XF, Wang LY, Dong XC, Meng QW ( 2010) Antisense‐mediated depletion of tomato endoplasmic reticulum omega‐3 fatty acid desaturase enhances thermal tolerance. J Integr Plant Biol 52: 568–577 [DOI] [PubMed] [Google Scholar]
- Wang Z, Kang S, Jensen CR, Liu F ( 2011) Alternate partial root‐zone irrigation reduces bundle‐sheath cell leakage to CO2 and enhances photosynthetic capacity in maize leaves. J Exp Bot 10: e1093 [DOI] [PMC free article] [PubMed] [Google Scholar]
- Warthmann N, Chen H, Ossowski S, Weigel D, Herve P ( 2008) Highly specific gene silencing by artificial miRNAs in rice. PLoS ONE 3: e1829 [DOI] [PMC free article] [PubMed] [Google Scholar]
- Wu C, Li X, Yuan W, Chen G, Kilian A, Li J, Xu C, Zhou DX, Wang S, Zhang Q ( 2003) Development of enhancer trap lines for functional analysis of the rice genome. Plant J 35: 418–427 [DOI] [PubMed] [Google Scholar]
- Yang X, Wang X, Wei M ( 2010) Response of photosynthesis in the leaves of cucumber seedlings to light intensity and CO2 concentration under nitrate stress. Turk J Bot 34: 303–310 [Google Scholar]
- Zhang J, Li C, Wu C, Xiong L, Chen G, Zhang Q, Wang S ( 2006) RMD: A rice mutant database for functional analysis of the rice genome. Nucleic Acids Res 34: D745–D748 [DOI] [PMC free article] [PubMed] [Google Scholar]
- Zhang L, Guo Q, Chang Q, Zhu Z, Liu L, Chen Y ( 2015) Chloroplast ultrastructure, photosynthesis and accumulation of secondary metabolites in Glechoma longituba in response to irradiance. Photosynthetica 53: 144–153 [Google Scholar]
- Zhao KF, Song J, Fan H, Zhou S, Zhao M ( 2010) Growth response to ionic and osmotic stress of NaCl in salt‐tolerant and salt‐sensitive maize. J Integr Plant Biol 52: 468–475 [DOI] [PubMed] [Google Scholar]
- Zheng Q, Wang XJ ( 2008) GOEAST: A web‐based software toolkit for Gene Ontology enrichment analysis. Nucleic Acids Res 36: W358–W363 [DOI] [PMC free article] [PubMed] [Google Scholar]
Associated Data
This section collects any data citations, data availability statements, or supplementary materials included in this article.
Supplementary Materials
Additional supporting information may be found in the online version of this article at the publisher's web‐site.
Figure S1. Ten predicted transmembrane regions of SLAC7 protein
Figure S2. Plant height of different transgenic plants (slac7‐1, amiR1, com).
Figure S3. Pollen starch staining shows normal slac7‐1 fertility
Figure S4. Starch grain number of each chloroplast of slac7‐1 and wild‐type leaves at different development stages.
Figure S5. slac7‐1 leaves were severely damaged
Figure S6. 3,3′‐Diaminobenzidine‐tetrachloride (DAB) staining of slac7‐1 and wild‐type leaves
Figure S7. Starch grain number of each chloroplast of different transgenic plants (aimR1, com) at seven leaf stage.
Figure S8. Leaves of SLAC7 amiRNA transgenic plants were severely damaged
Figure S9. Complementation of slac7‐1
Figure S10. Expression level of SLAC7 tested by northern blot and quantitative reverse transcription polymerase chain reaction (qRT‐PCR)
Figure S11. Log‐Log scatter plot of significant differentially expressed genes in slac7‐1 plants
Figure S12. Microarray analysis of the differential expression genes in whole metabolism using MapMan softwoare (version 3.6.0RC1)
Figure S13. Microarray analysis of the differential expression genes in cellular response using MapMan softwoare (version 3.6.0RC1)
Figure S14. Microarray analysis of the differential expression genes in stress response using MapMan softwoare (version 3.6.0RC1)
Figure S15. Microarray analysis of the differential expression genes in regulation network using MapMan softwoare (version 3.6.0RC1)
Figure S16. Microarray analysis of the differential expression genes in transcription network using MapMan softwoare (version 3.6.0RC1)
Figure S17. Microarray analysis of the differential expression genes in sucrose and starch using MapMan softwoare (version 3.6.0RC1)
Figure S18. Abscisic acid (ABA) level and leaf ion leakage rate of SLAC7 overexpression transgenic plants
Figure S19. The leaf trichome numbers of different transgenic plants
Figure S20. Relative expression level of cytokinin metabolism related genes in slac7‐1 leaves
Figure S21. Relavtive content of isopentennyladenine in slac7‐1 and wild‐type leaves
Table S1. Primer sequences
Table S2. Upregulated genes in slac7‐1 leaves
Table S3. Downregulated genes in slac7‐1 leaves
Table S4. Gene Ontology analysis of differentially expressed genes
Table S5. Quantitative reverse transcription polymerase chain reaction (qRT‐PCR) verification of the differentially expressed genes initially identified by microarray analysis
Table S6. Primers used in the quantitative reverse transcription polymerase chain reaction (qRT‐PCR) experiments


