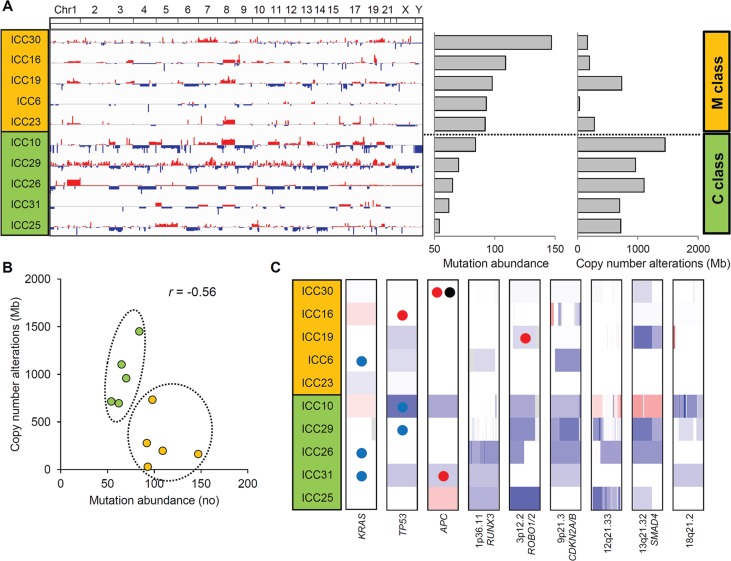
Figure 3. Two ICC classes defined by the abundance of somatic mutations and CNAs.
(A) Ten ICC cases are sorted in order of mutational abundance. The half of the ICC cases with more number of somatic mutations (above) show a relative deficit of CNAs compared to the half with less number of mutations (below). These two ICC classes are annotated as M and C class (orange and green), respectively. (B) A scatter plot shows that ICC cases can be distinguished into two classes with a negative correlation (r = −0.56) between the abundance of mutations and CNAs. (C) Along with three loci with recurrent somatic mutations (KRAS, TP53 and APC), six focal and recurrent deletions identified by GISTIC are shown. One-Mb regions encompassing KRAS, TP53 and APC along with focal deletions as defined by GISTIC are arbitrarily shown in the same-sized windows with red and blue representing chromosomal gains and losses, respectively. Colored circles represent the concurrent somatic mutations with blue, red and black representing missense, nonsense mutations and frameshift indels, respectively.

