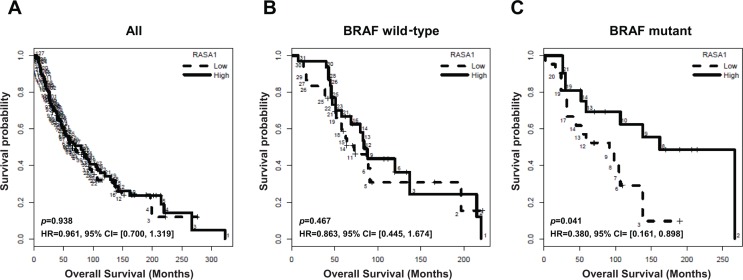
Figure 3. Association of RASA1 mRNA level with overall survival of melanoma patients.
Kaplan-Meier overall survival curves of melanoma patients in this cohort for all samples (A) (n = 253), BRAF wild type (B) (n = 61), and BRAF mutant samples (C) (n = 42) are shown. Samples are divided into high (above median) and low (below median) RASA1 expression groups, based on the average intensity of the two RASA1 probe sets.

