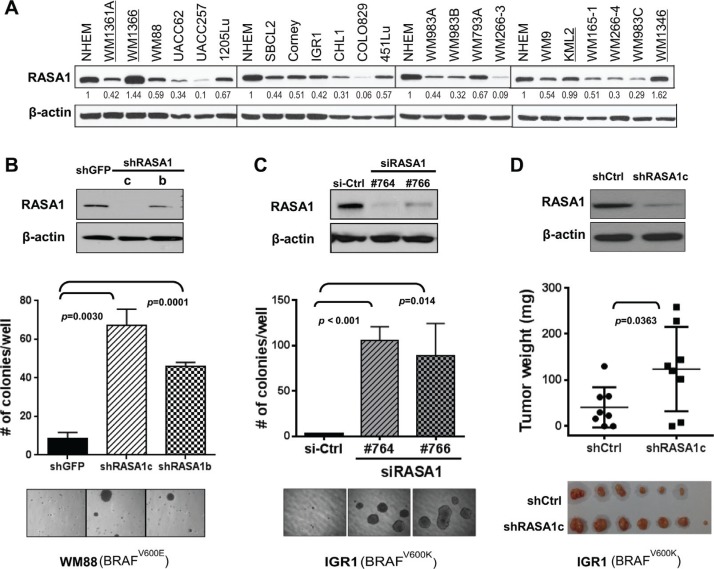
Figure 4. Loss of RASA1 promotes anchorage-independent colony formation.
(A) RASA1 expression in human melanoma cell lines in comparison to normal human epithelial melanocytes (NHEM). Protein level was quantitated using image J software and relative RASA1 to β-actin ratio was normalized against that of NHEM. Cell lines with NRAS mutation are underlined. (B and C) (Top) Immunoblotting of RASA1 protein levels in WM88 transduced with shRNA targeting RASA1 (shRASA1c and b) or shGFP (B) and in IGR1 cells transfected with siRNA targeting RASA1 (si#764and #766) or siCtrl (non-targeting siRNA) on day 4 post transfection (C). (Bottom) Number of colonies grown on soft agar on day 21 (B) or on day 15 (C) counted per well. Graph shows data as mean +/− SD. Representative microscopic images are shown. (D) Subcutaneous tumors generated with IGR1 cells with pLKO.1 vector control (shCtrl) or with shRASA1c (bottom) and tumor weights (middle) on day 48 for each group. Data expressed as mean +/− SD.

