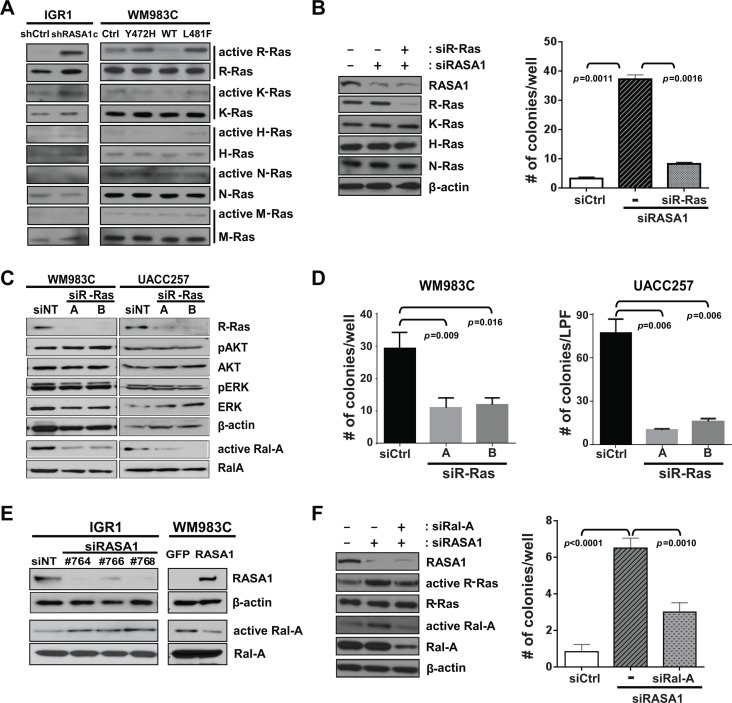
Figure 7. RASA1 suppresses activation of R-Ras and Ral-A.
(A) GTP-bound active-Ras in IGR1 and in WM983C is probed with isoform-specific antibodies against H-, K-, N-, M-, and R-Ras. (B) R-Ras expression is knocked-down with RRAS siRNA in IGR1 cells with RASA1 knock-down (#764 siRNA) (left: western blot). Number of soft-agar colonies per well expressed as mean +/− SD (right panel) on day 17 counted under the microscope are shown. (C) Level of R-Ras, pAKT, AKT, pERK, ERK, Ral-A and β-actin was determined by western blot analysis in WM983C and UACC257 cells with (A or B) or without (siNT) siRNA-mediated R-Ras knock-down. Ral-A activity was measured by pulling down GTP bound active Ral proteins with RalBP1-RBD agarose followed by immunoblotting with α-Ral-A antibody. (D) Number of soft-agar colonies per well for WM983C and per low power field (LPF) for UACC257 on day 21 per well (mean +/− SD). (E) Level of RASA1, β-actin, and Ral-A and active GTP-bound Ral-A was determined by western blot analysis in IGR1 with (#764, 766, or 768) or without (siNT) siRNA-mediated RASA1 knock-down and in WM983C cells transduced with adenovirus encoding RASA1 or GFP. (F) Number of soft-agar colonies visible to the naked eye were counted on day 12 per well (right) shown as mean +/− SD.

