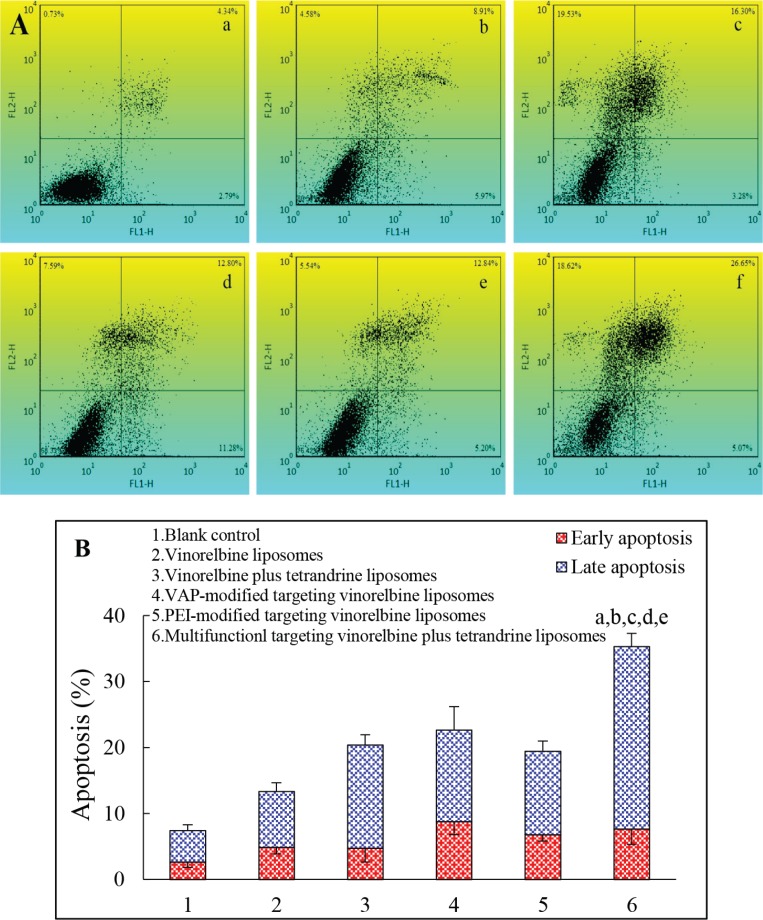
Figure 5. Induced apoptosis in GSCs after treatments with varying formulations.
Notes: (A) Plots by flow cytometry of apoptosis-inducing effects in GSCs; (B) Apoptosis in GSCs after treatments with varying formulations. Data are presented as the mean ± SD (n = 3). a. Blank control; b. Vinorelbine liposomes; c. Vinorelbine plus tetrandrine liposomes; d. VAP-modified targeting vinorelbine liposomes; e. PEI-modified targeting vinorelbine liposomes; f. Multifunctional targeting vinorelbine plus tetrandrine liposomes. p < 0.05; a, vs. blank control; b, vs. vinorelbine liposomes; c, vs. vinorelbine plus tetrandrine liposomes; d, vs. VAP-modified targeting vinorelbine liposome; e, vs. PEI-modified targeting vinorelbine liposomes.

