Abstract
We introduce a more flexible optogenetics-based mapping system attached on a stereo microscope, which offers automatic light stimulation to individual regions of interest in the cortex that expresses light-activated channelrhodopsin-2 in vivo. Combining simultaneous recording of electromyography from specific forelimb muscles, we demonstrate that this system offers much better efficiency and precision in mapping distinct domains for controlling limb muscles in the mouse motor cortex. Furthermore, the compact and modular design of the system also yields a simple and flexible implementation to different commercial stereo microscopes, and thus could be widely used among laboratories.
OCIS codes: (220.0220) Optical design and fabrication, (230.4685) Optical microelectromechanical devices, (250.3140) Integrated optoelectronic circuits
1. Introduction
Functional mapping is an essential method for interrogating architecture, function or the causal relation between behavior and neural circuitry. For example, stimulation of the motor cortex, which was the first region of the brain to be mapped [1], produced predominantly ipsilateral movements in facial muscles and contralateral responses in fore- and hindlimb muscles [1]. Traditional techniques for motor mapping, including intracortical microstimulation (ICMS) [2], epidural microstimulation [3] and transcranial magnetic stimulation [4], provided new perspectives for understanding the structure and function of the cortex; however, these techniques also suffered from limitations, such as their labor-intensive nature, potential damage to the cortex, indiscriminate activation of axons, and inability to selectively target neuronal subtypes [5, 6].
Recently, optogenetics technology has provided efficient control of neuronal activity through the expression of light-sensitive channels in a specific neuronal population and light illumination [7–9]. In addition, the current excellent mouse lines provide the perfect animal model for reproducible cortical activation at arbitrary points over wide spatial scales [10, 11]. Optogenetics will selectively regulate the activity of specific cells by controlling the beam moving, instead of implanting electrode onto or into the cortex during the microstimulation. So less time would be spent on motor mapping and less damage would be made to animals. Our recent work also proved that the optogenetic technique could be used to regulate and control neuronal activity in animal systems of various sizes, from fruit flies to mice [12, 13]. Functional mapping in specific areas has been performed in vivo using this technique through optogenetic stimulation in an open skull [14–18] or transcranial optogenetic stimulation [19] in transgenic mice. These approaches were shown to generate highly reproducible automated maps of the mouse forelimb and hindlimb motor cortex, providing a tool with improved speed and precision that can interrogate the causal relation between motor cortex activation and actions. However, the stimulation systems in these studies were constructed on an upright microscope [14] or macroscope [19], whose fixed light spot and short working distance could limit their applications. Here, we developed an ultra-flexible method and setup for fast motor cortex mapping in which a laser beam was introduced to a commercial stereo microscope to obtain a continuously adjustable laser spot, and a high-speed XY stage was used to load a mouse to scan multiple positions. We present the details of the hardware and software used for the flexible optogenetics-based method and setup. This optogenetic method enabled both fast precise motor cortex mapping and the recording of muscle evoked potentials (MEPs) in specific ipsilateral and contralateral forelimb muscles, thus providing a more precise map of the motor cortex representation of a specific limb muscle.
2. Materials and methods
2.1. Animal preparation
The care and use of the experimental animals followed the animal use guidelines of Fudan University (Shanghai, China). All efforts were made to minimize the suffering and number of animals used in the study. Channelrhodopsin-2 (ChR2) transgenic mice were gifts from Guoping Feng (Thy1-ChR2-YFP, line 12). The experimental protocol was similar to a previous study [14]. Adult mice aged 8-12 weeks and weighing 20-30 g were used for all experiments. The animals were anesthetized using an intraperitoneal injection of a ketamine (200 mg kg−1) and xylazine (10 mg kg-1) mixture (Shanghai Reagent Factory, Shanghai, China), and an incision was then made in the skin covering the motor cortex. After the exposed skull was cleaned, a craniectomy was performed over the right or left hemisphere. The exposed brain was covered with artificial cerebral spinal fluid (aCSF). One-fourth of the initial dose of anesthesia was intramuscularly delivered whenever spontaneous limb movement occurred during the experiment. After the study, the mice were dephlogisticated and placed in a clean room for the subsequent experiments.
2.2. XY stage design and motor control
To obtain larger activation regions, a two-dimensional motorized stage was developed on which a mouse head was fixed and could be moved along the X or Y axes. Because aluminum has many advantages over stainless steel, for example, the density of the aluminum is only one third of the stainless steel. So aluminum was selected to be made into the base plate of our system. It makes the system much lighter and maintains higher stiffness. Ball bearing slides were used to reduce friction by replacing sliding motion with rolling motion, thus making the stage more suitable for a higher load capacity and higher stiffness and guaranteeing more precise motion control. A very fine recirculating ball screw with an encoder for a feedback mechanism was used to translate axial motion into linear motion. This system has the advantage of higher transmission efficiency and higher motion accuracy because the transmission efficiency of ball screw can reach above 90%, which is usually 2-4 times of the traditional lead screw.
The ball screws were separately driven by two servo motors (MSMD012P1U, Panasonic, Japan), which characteristically produce higher translation speeds than those of a direct current stepper. The ability to precisely control the position of the stage and its repeatability depends on the encoder feedback system, which also dictates the resolution of the stage motion. Accordingly, high positioning precision and high motor speed could be obtained. Electromagnetic shielding is necessary on the other side because the servo motor operates in a location with a pulsed magnetic field. For motor mapping, a sequence array including 14 × 10 pixels (spacing, 300 µm) was constructed to cover a 12 mm2 area of the motor cortex.
This arrangement of moving the animal relative to the laser beam allows repetitive optical stimulation at longer intervals, over larger two-dimensional distances with more accurate positioning. The other notable advantage of stage scanning is that the position of the light spot is fixed, avoiding the optical aberration from the objective lens. Although it would be possible to perform rapid multiple-point movements (less than 1 ms) using other systems, such as galvanometer-driven scanning mirrors [19, 20], digital micromirror devices (DMDs) [21], spatial light modulator (SLMs) [22] or acousto-optic deflectors (AODs) [12, 13], a shorter interval between photostimulations would cause crosstalk between the EMG signals induced at adjacent positions because of the long recovery lifetime of ChR2 [23].
2.3. Optical setup and laser stimulation
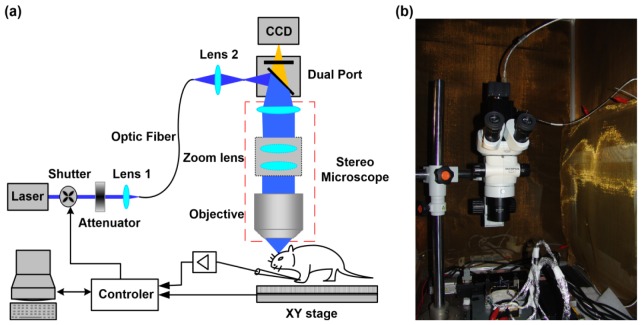
The automated cortex mapping system is illustrated in Fig. 1(a). The light source is a diode-pumped solid-state blue laser (MLL-III-473, λ = 473 nm, Changchun New Industries Optoelectronics Tech, China) and is followed by a neutral attenuator (GCO-0702M, Daheng New Epoch Technology Inc., China) which was fixed between the laser shutter (SR475, Stanford Research System, Inc., USA) and the optical fiber to adjust the laser power. The attenuated laser was then coupled into a single mode optical fiber (3.5/125(Fiber core/Cladding in micron), NA = 0.11, OZ, Canada) by an aspheric lens (focal length, 4.5 mm, OZ, Canada) to enhance the coupling efficiency (coupling efficiency > 50%). An aspheric imaging lens (focal length, 2 mm, OZ, Canada) was located behind the other end of the optical fiber to obtain a 50 micrometer diameter laser spot, which was the image of the laser spot from the output of the optical fiber.
Fig. 1.
Photostimulator-based stage scanning system. (a) Optical schematic diagram. The rectangles with dashed lines indicate the body of the stereo microscope. (b) Photo of the photostimulator constructed on a commercial SZX7 microscope.
Then, the laser beam was directed into the commercial stereo microscope (SZX7, Olympus, Japan) through a home-built port, which consisted of one dichroic mirror (DM505, Nikon, Japan) and one emission filter. The dichroic mirror was utilized to reflect the 473 nm laser to the main body of the microscope, and along with a band-pass filter, the mirror was also used to transmit fluorescence to the camera (MV-VS142FM, Microvision, China) for imaging. The position of the 50 micrometer spot and the focal plane of the camera were all conjugate with the focal plane of the objective. After it entered the main body of the microscope, the laser spot was reversely magnified and easily adjusted by hand, and the spot size was controlled by the zoom parameter of the stereo microscope. The relation is shown below as Eq. (1).
| (1) |
Here, the parameter ZoomRatio refers to the zoom ratio of the stereo microscope, and ObjMag refers to the magnification of the objective in the stereo microscope. A camera was fixed to the dual port to accurately orient the original photostimulation point and range.
2.4. Optogenetic cortical mapping and muscle evoked potential (MEP) recording protocol
After successful and stable anesthetization, the mouse head was fixed to the scanning stage, the in vivo photostimulation-based stage scanning setup was constructed, and optogenetic mapping was performed. The right motor cortex was divided into 14 × 10 arrays of pixels (0.3 mm spacing), with a total coverage of up to 13 mm2. The laser beam was introduced to the stereo microscope through a dual-port optical fiber and focused through the microscope objective onto the specimen, which was fixed on a two-dimensional motorized stage. The diameter of the laser spot in the focal plane was easily adjusted using the microscope zoom knob for flexible control of the photostimulation parameters, such as the size of the laser spot on the focal plane, the power, and the duration of illumination. During stimulation, the laser beam illuminated one position of the motor cortex and was then moved to another location at 1 second intervals. The general conditions of the animals and movements of different parts of the body were monitored; motor mapping was performed to represent these movements. A high speed camera (MV-EM040C/M, Microvision, China) was used to monitor the limb movements during the experiments, with a recording accuracy of 120 frame/second, 640*480 pixels, and 3.75 μm/pixel. Then we would replay these videos and analyze specific movements.
Two groups of needles were inserted into the triceps or forearm extensors on both sides of the forelimbs to record the MEP signals upon photostimulation of the right motor cortex (Fig. 4(A) and Fig. 4(B)); each group of needles had three electrodes: recording, reference, and ground electrodes. The recording electrode and the reference electrode were connected to two input terminals of a differential amplifier (CyberAMP 380, Axon Instruments, USA) and amplified. Then these signals were input to a high-reserlation data acquision system (Digidata 1440A, Axon Instruments, USA) and sampled as the EMG amplitude, that is, MEP signal. The difference between the peak and valley of the MEP signal was used to quantify the amplitude of the MEP signal. The amplitude of the MEP signal in one experiment was normalized, and five measurements were averaged to obtain the motor maps representing the forelimb muscles, which were pseudo-color coded for display. We found that the five average processing of experiment data could meet our requirements. If the signal to noise (SNR) is not good enough, we would increase the averaging times, more than five.
2.5. Software
A laser shutter with a maximum working frequency of 100 Hz was installed behind the laser source to control the on-off switch of the laser beam. For remote control of the shutter, a multifunction DAQ card (PCI-6221, NI, USA) was used to supply the TTL level, which was the external trigger signal to the shutter.
One application routine termed the “stage scanning system” was developed in LabVIEW (National Instruments, USA) to control the scanning process. The stage scanning system includes a graphical user interface that allows the experimenter to modify each parameter of interest (e.g., working mode, stimulus region, step interval, stimulus time, and stimulus interval). For example, in the automated mode, the main function of the control camera is to snap an image of the sample; then, the user selects the photostimulation origin and region, the stimulation time and the step distance. Then, the program begins scanning the stage and performing the photostimulation in a particular position. In manual mode, the user can manually control the motor and photostimulation as intended in a step-by-step manner.
3. Results
3.1. General performance test
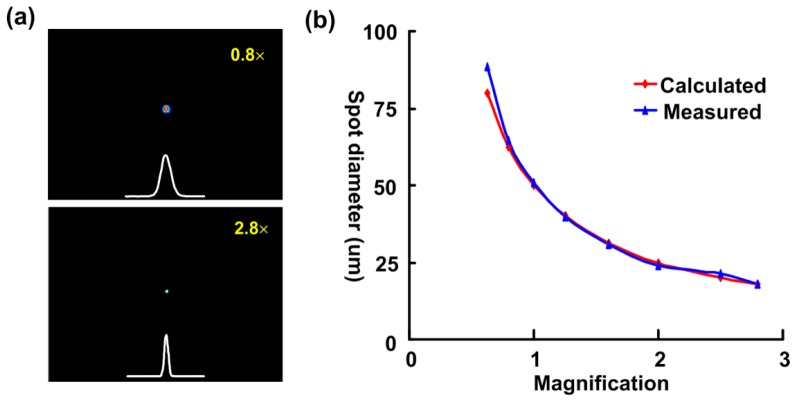
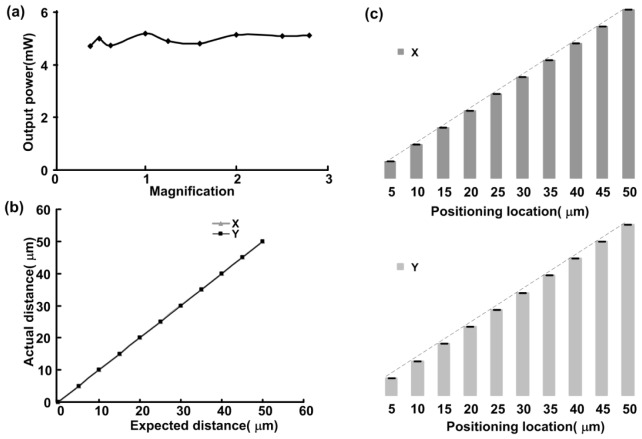
After the design and debugging were complete, the functions of the automated cortex mapping system were carefully tested. A beam profiler (BC106-VIS, Thorlabs, USA) was fixed on the two-dimensional stage to measure the laser intensity profile and the variety of spot sizes in the sample plane that could be obtained by adjusting the zoom ratio (Fig. 2). The greater the magnification was, the smaller the spot size (Fig. 2(a)). The magnification and spot size were inversely proportional (Fig. 2(b)), and the measured results were in good agreement with the theoretical results (calculated using formula 1-1). Thus, different resolutions of neuronal activation could be easily achieved. The laser power at the sample locations at different magnifications was fairly consistent (Fig. 3(a)), which shows that the laser spot size could be changed as the zoom ratio was adjusted without changes in the laser intensity. This consistency makes it easy to compare cortex maps at different resolutions. Next, the laser power at the sample location was measured by continuously adjusting the neutral attenuator. The laser power ranged from 0 mW to 5.2 mW; the latter power corresponds to a light luminance of 16.6 W/mm2, which could be used to activate various types of cells [24]. Continuously adjustable power was indispensable for the activation of different samples, which was easily achieved using our system.
Fig. 2.
The optical resolution below the objective. (a) The intensity profile is shown in the X/Y axis at two magnifications (upper, 0.8 × ; lower, 2.8 × ). (b) Relation between optical resolution and stereo microscope magnification.
Fig. 3.
System performance test. (a) Relation between laser power and the magnification of the stereo microscope. (b) Relation between the actual location and the expected location. (c) Repeated positioning accuracy in the X/Y direction (the error bars indicate the accuracy at different distances).
Then, the targeting accuracy of the two-dimensional stage was measured. The relation between the actual location and intended location was plotted in Fig. 3(b) and showed high linearity, which was essential for functional mapping. The repeatability and accuracy of the positioning will determine whether the laser spot reaches the same position when the same location in the cortex is mapped multiple times. The experimental data showed that the repeated positioning accuracy at different positions in the X or Y direction is not worse than 1 micrometer (error bar in Fig. 3(c)), which suggests that the two-dimensional motion system is reliable and highly accurate.
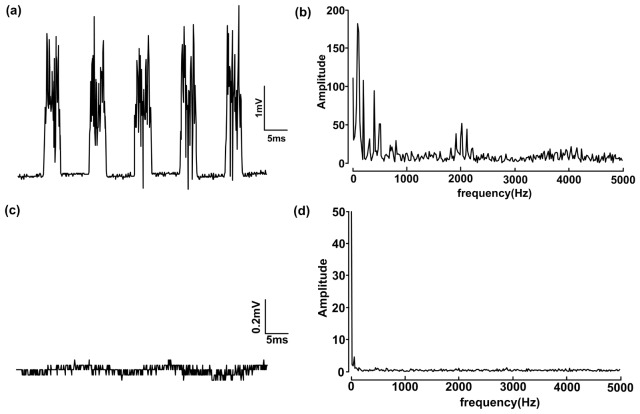
Because of the magnetic field and pulsed electrical field that are engaged when the servo motor begins to work, electromagnetic interference should be considered when an animal is fixed on a two-dimensional stage and its electromyogram (EMG) signal is measured. To test the interference, a transgenic mouse expressing ChR2 was fixed in two dimensions, and two connected electrodes were inserted into the contralateral forelimb. The output of the electrodes was connected to an amplifier, and the EMG signals were sampled at 10 kHz. The maximum recorded EMG amplitude reached 3.85 mV, which was more than the normal EMG amplitude of approximately 1 mV, as shown in Fig. 4(a). We analyzed the EMG power spectrum and found that the noise was mainly concentrated from 100 Hz to 2,000 Hz. Our system was equipped with a shielded copper case to suppress the electromagnetic noise. In addition, a good common ground connection was indispensable. After these measurements were collected, the noise dropped to no more than 0.1 mV (Fig. 4(c)), and the high-frequency components were filtered out (Fig. 4(d)).
Fig. 4.
Measuring the noise of the EMG signals. (a) Noise signal with periodic electromagnetic interference. (b) Frequency analysis before shielding. (c) Frequency analysis after electrical shielding and grounding. (d) Frequency analysis after shielding.
3.2. Photostimulation parameters used for muscle excitation and electromyography
After these verifications that the system was accurate for positioning and that the excitation source exhibited appropriate laser intensity and optical resolution, the ability to induce muscle excitation and electromyography was tested. Photostimulation was performed with the animals in a lightly anesthetized state. The limb movements were monitored, and the corresponding EMG signal were also recorded when a brief pulse of laser light was directed at specific sites on the motor cortex. The results showed that there was no muscle excitation in some areas or large muscle movement in certain regions upon photostimulation with a brief laser pulse, which indicates that specific regions in the motor cortex are responsible for the corresponding limb movements.
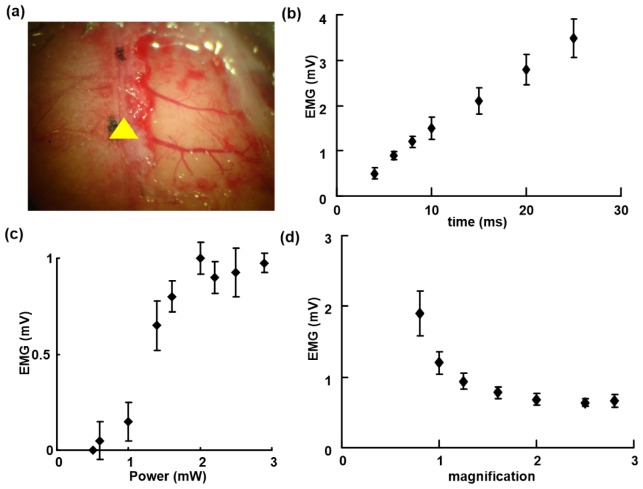
Then, we focused on the dependence of muscle excitation on the stimulation duration. We found that only a few milliseconds of illumination at a specific site could induce muscle excitation. Longer durations of illumination would produce increases in the amplitudes of the EMG signals (Fig. 5(b)). The amplitude of the EMG signal was linearly correlated with the duration of the laser pulse, but the laser pulse could induce generalized tonic jitters in the mouse when the irradiation time was more than 15 milliseconds. Photostimulation with a duration of 4-10 milliseconds could induce a stable EMG signal and was used in the subsequent experiments (unless otherwise stated); this stimulation could induce stable and visible responses in each test. The laser power during an irradiation of six milliseconds strictly determined the amplitude of the EMG signals in a non-linear manner (Fig. 5(c)). The signals were eventually saturated when the laser power exceeded 3 mW. Thus, there were no further increases in muscle excitation when the laser power was further increased. Under the same conditions, no MEP was recorded in the cortex of wild-type mice following a brief illumination with a blue laser.
Fig. 5.
Light-induced EMG. (a) Image of the vasculature in the right hemisphere of the cortex (the yellow triangle marks the bregma). (b) Relation between the EMG amplitude and stimulation time. (c) Relation between the EMG amplitude and laser power. (d) Relation between the EMG amplitude and laser spot magnification.
The outstanding advantage of this method is the ability to adjust the spot size in the specimen plane. The amplitude of the recorded EMG signal decreased in an exponential manner as the magnification of the stereo microscope increased (Fig. 5(d)). When the magnification was increased, the spot size of the laser beam was reduced, and vice versa. At the same laser intensity, a larger spot will activate more neurons in the cortex and thus induce much larger EMG amplitudes.
3.3. Optogenetic mapping of the motor cortex
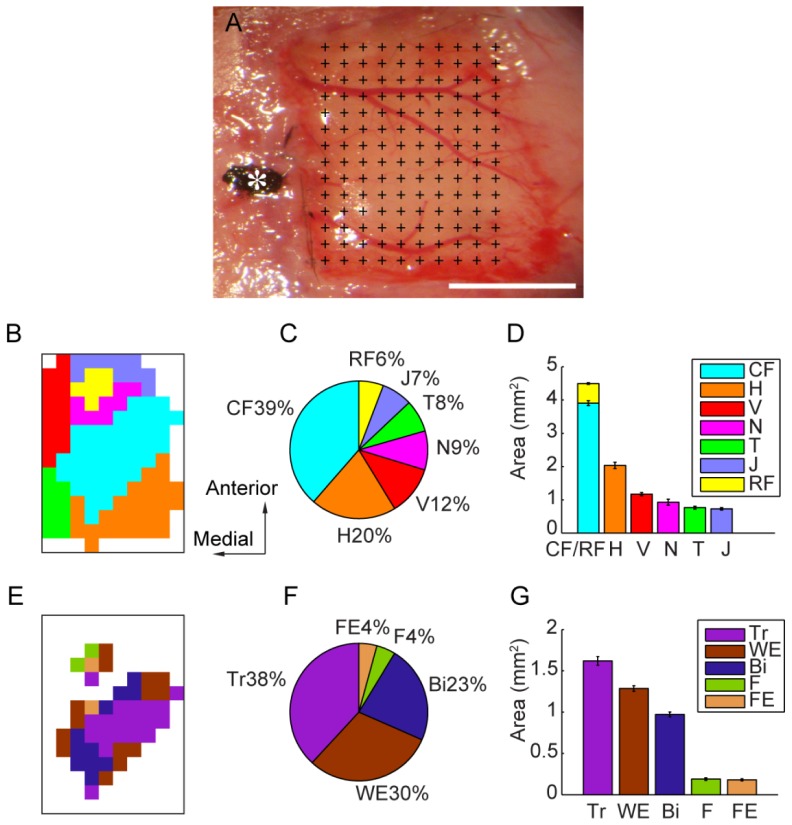
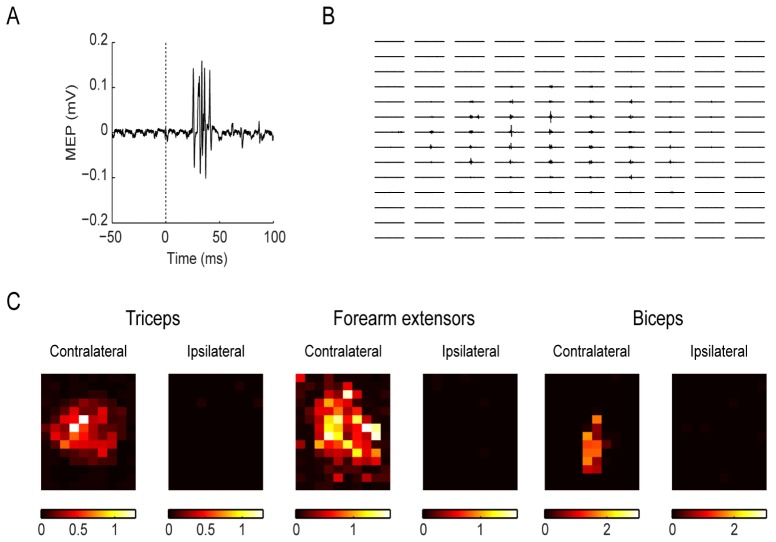
Altogether there was a total number of 13 Channelrhodopsin-2 transgenic mice enrolled in the experiments, they were gifts from Guo-Ping Feng’s laboratory: line 18, stock 007612, strain B6.Cg-Tg (Thy1-COP4/EYFP) 18Gfng/J. The above results showed that a pulse flash with a laser power of 1-3 mW, a magnification of 0.8-1.6 and a duration of 4-10 ms could induce stable and repeated limb movement. Approximately 100 seconds are required to complete a cortical map (Fig. 6(A)). The results revealed that of the 14 × 10 arrays of pixels, 20 ± 2 pixels evoked elbow extension movements, 12 ± 1 pixels evoked elbow flexion movements, and 16 ± 2 pixels evoked forearm extension movements (Fig. 6(B)-6(G)). Photostimulation of one hemisphere of the motor cortex induced movement and EMG signals only in the contralateral limb (Fig. 7(C)); this finding was consistent with previous studies [14, 17–19].
Fig. 6.
In vivo optogenetic mapping of the primary motor cortex and precise cortical representations of different forelimb muscles. (A): A picture showing the exposed motor cortex from 2.5 mm ahead of the bregma to 1.4 mm behind the bregma and from 0.5 mm to 3.5 mm lateral to the midline. The motor cortex undergoing photostimulation was divided into 14 × 10 arrays of pixels (0.3 mm spacing), covering a total of 13 mm2. The cross indicates each position of laser photostimulation, and the star indicates the bregma. Scale bar: 2 mm. (B): Primary motor cortex map constructed using optogenetic methods, with different colors indicating different parts. (C): Percentage of different types of body movements represented in the primary motor cortex. The caudal forelimb (CF) is shown in blue, the rostral forelimb (RF) is shown in yellow, the jaw (J) is shown in dark blue, the trunk (T) in shown in green, the neck (N) is shown in purple, the vibrissa (V) are shown in red, and the hindlimb (H) is shown in orange. (D): Accumulated areas representing different types of body movements with standard errors. (E): Primary motor cortex map constructed using optogenetic methods, with different colors indicating the different forelimb muscles. (F): Percentage of different types of forelimb movements represented in the primary motor cortex. The triceps muscle (Tr) is shown in purple, the wrist extension muscle (WE) in shown in gray, the biceps muscle (Bi) is shown in dark blue, the forearm flexor muscles (F) are shown in green, and the finger extension muscles (FE) are shown in orange. (G): Accumulated areas representing the different types of forelimb muscles with standard error.
Fig. 7.
Generation of the MEP map and optogenetic-electromyography mapping of the forelimb muscles in representative normal mice. (A): An example MEP trace evoked by the laser. The dotted line indicates the firing of the laser. (B): The MEP traces evoked by the laser were projected at all positions of M1. The recording electrode and the reference electrode Strong muscle activities could be recorded especially in the center of the cortex, with the muscle evoked potential as large as 1 mV, while in some other areas at the corners, no muscle evoked potentials could be recorded. (C): From left to right: Pictures showing the motor cortical representations of the triceps, forearm extensors and biceps on both sides of a normal transgenic mouse. The brightness encodes the MEP signal amplitude. The brighter the color, the larger the MEP amplitude.
The correlation between the time of the optical stimulation and the induced EMG signal was then investigated using these conditions. The mean latency, defined as the time from the beginning of photostimulation to the emergence of EMG signals, was 26.0 ± 5.2 ms, which was consistent with previous results [14, 15]. As expected, the optically evoked EMG responses exhibited latencies comparable to those of the EMG responses produced by direct electrode stimulation of the motor cortex in mice and other animals. At different frequencies (no more than 30 Hz), each brief flash would induce the corresponding EMG signals and limb movements (data not shown), which proved that the muscle excitation was strictly time correlated to the light stimulus. After one hundred or two hundred milliseconds, the EMG signal returned to baseline. Therefore, the recovery period for the EMGs should be considered during cortex mapping, and laser scanning that is too fast may not be suitable for light-based cortical mapping. The motor cortical representations of the triceps, forearm extensors and biceps on both sides of a normal transgenic mouse were then shown according to their MEP responses.
4. Discussion
The functional connectivity map should be determined to elucidate the connectivity between an intact cerebral cortex and the output behavior. One advantage of the optogenetic technique is the selective activation of neural circuits expressing a specific light-sensitive protein in certain clusters of neurons or nuclei [25, 26]. Accordingly, several motor cortex maps have been reported using light-based-mapping (LBM) techniques [16, 21]. Here, in our modified ultra-flexible optogenetic setup, various combinations of laser spot sizes on the focal plane, laser power, and duration of illumination were readily achieved, allowing us to achieve more precise and reproducible automated maps of the forelimb motor cortex. Precise motor representations of different forelimb muscles were successfully determined for the first time using our modified setup.
In 2009, Ayling and Hira reported motor cortex maps in Thy1-ChR2-YFP transgenic mice using the LBM technique [16, 21]. Recently, a few other minimally invasive techniques have been developed to map the motor cortex [14, 16, 17, 19]; however, many issues, such as distinguishing between different types of limb movement or other body movements, are still not clear, the setup is somewhat bulky, and most of the laser parameters are not mentioned or fixed. Here, in our experiment, a laser beam was introduced into a commercial stereo microscope to obtain a continuously adjustable laser spot, and a high-speed XY stage was used to load mice and scan multiple positions for rapid motor cortex mapping. Thus, cortical mapping could be achieved easily and efficiently; in addition, our setup precludes the disadvantages of conventional ICMS methods, such as labor intensiveness, potential damage to the cortex and off-target effects. Furthermore, in our modified ultra-flexible optogenetic setup, the laser beam was introduced into stereo microscope through a dual port and optical fiber and focused through a microscope objective onto the specimen, which was fixed on a two-dimensional motorized stage. The diameter of the laser spot on the focal plane could easily be adjusted using the microscope zoom knob to obtain various combinations of the laser spot diameter on the focal plane, the laser power, and the duration of illumination, allowing us to investigate the causal relation between motor cortex activation and limb movement in a much finer mode.
Our modified setup revealed that a small anterior region controls the movements of the wrist and fingers, whereas a large posterior area controls the movements of the shoulder, elbow and partial wrist in the normal Thy1-ChR2 transgenic mice; this finding is similar that of previous studies by Nudo using ICMS [26]. In general, electrode-based techniques, such as intracortical microstimulation, would require hundreds of seconds at one point; however, stimulation using our method requires only one or two seconds. Our method is two orders of magnitude faster than electrode-based techniques. Furthermore, our flexible light-based method with a stereo microscope was developed to induce reliable and repeatable limb movements and limb EMG signals, allowing automatic mapping of the areas of the motor cortex involved in limb movement. Servo motor-driven two-dimensional stages enable the animals to be moved at a maximum speed of 25 millimeters per second, with a resolution of no more than one micrometer within a large field (up to a few hundred square millimeters), which completely depends on the lead screw displacement of the stages. Therefore, the method could be used to map the motor cortex of larger animals, such as primates, and for more precise mapping. Furthermore, the motor map representing the distribution of neurons associated with limb movement was obtained by correlating the location of photostimulation with the magnitude of limb movements, and our modified photostimulation setup could produce flexible combinations of photostimulation parameters, such as the diameters of the laser spot on the focal plane, laser power, and the duration of illumination. Thus, more precise motor representations of different forelimb muscles in transgenic mice were successfully obtained for the ChR2-expressing transgenic mouse brain. Moreover, these findings might fill the gap where the optogenetic technique failed to provide precise representation patterns of the entire forelimb muscles, thus laying the foundation for subsequent evaluations of the dynamic changes in the intact motor cortex in future studies.
Because the high resolution, noninvasive stimulation of broad cortical areas used in our system is now available, it is now possible to perform long-term assessments of the reorganization of the motor cortex after brain injury, such as trauma and stroke. More parameters can be recorded and used to analyze neural circuit information if the method is integrated into other novel devices, such as magnetoresistive sensors [19], laser motion sensors [14], accelerometers [17], and high speed cameras, to monitor limb movement. In addition, our device is easily integrated with different types of commercial microscopes produced by diverse microscope producers, such as Nikon Corp., Olympus Corp., and other manufacturers. These characteristics and advantages are very remarkable and highly beneficial for popularization of this system in many laboratories.
Funding
This work was supported by the National Natural Science Foundation of China (81327802, to Shaoqun Zeng), the National High Technology Research and Development Program 863 Project (2015AA020501, to Wendong Xu), the National Funds for Distinguished Young Scientists (81525009, to Wendong Xu), the National Natural Science Foundation of China (81171151, to Wendong Xu), the Shanghai Municipal Science and Technology Commission of Outstanding Academic Leaders Project (12XD1401400, to Wendong Xu), the Training Project of Excellent Talents in Shanghai Municipal Health System (WSJ2012-20, to Wendong Xu), the Shanghai Science and Technology Committee Sailing Program (14YF1400800, to Su Jiang), the Shanghai Municipal Health Bureau Youth Fund (2012WSJ188, to Su Jiang) and the National Natural Science Foundation of China (81501945, to Su Jiang).
References and links
- 1.Pronichev I. V., Lenkov D. N., “Functional mapping of the motor cortex of the white mouse by a microstimulation method,” Neurosci. Behav. Physiol. 28(1), 80–85 (1998). 10.1007/BF02461916 [DOI] [PubMed] [Google Scholar]
- 2.Donoghue J. P., Sanes J. N., “Peripheral nerve injury in developing rats reorganizes representation pattern in motor cortex,” Proc. Natl. Acad. Sci. U.S.A. 84(4), 1123–1126 (1987). 10.1073/pnas.84.4.1123 [DOI] [PMC free article] [PubMed] [Google Scholar]
- 3.Molina-Luna K., Buitrago M. M., Hertler B., Schubring M., Haiss F., Nisch W., Schulz J. B., Luft A. R., “Cortical stimulation mapping using epidurally implanted thin-film microelectrode arrays,” J. Neurosci. Methods 161(1), 118–125 (2007). 10.1016/j.jneumeth.2006.10.025 [DOI] [PubMed] [Google Scholar]
- 4.Hallett M., “Transcranial magnetic stimulation and the human brain,” Nature 406(6792), 147–150 (2000). 10.1038/35018000 [DOI] [PubMed] [Google Scholar]
- 5.Schubert D., Kötter R., Staiger J. F., “Mapping functional connectivity in barrel-related columns reveals layer- and cell type-specific microcircuits,” Brain Struct. Funct. 212(2), 107–119 (2007). 10.1007/s00429-007-0147-z [DOI] [PubMed] [Google Scholar]
- 6.Carter M. E., de Lecea L., “Optogenetic investigation of neural circuits in vivo,” Trends Mol. Med. 17(4), 197–206 (2011). 10.1016/j.molmed.2010.12.005 [DOI] [PMC free article] [PubMed] [Google Scholar]
- 7.Häusser M., Smith S. L., “Neuroscience: controlling neural circuits with light,” Nature 446(7136), 617–619 (2007). 10.1038/446617a [DOI] [PubMed] [Google Scholar]
- 8.Zhang F., Aravanis A. M., Adamantidis A., de Lecea L., Deisseroth K., “Circuit-breakers: optical technologies for probing neural signals and systems,” Nat. Rev. Neurosci. 8(8), 577–581 (2007). 10.1038/nrn2192 [DOI] [PubMed] [Google Scholar]
- 9.Yizhar O., Fenno L. E., Davidson T. J., Mogri M., Deisseroth K., “Optogenetics in neural systems,” Neuron 71(1), 9–34 (2011). 10.1016/j.neuron.2011.06.004 [DOI] [PubMed] [Google Scholar]
- 10.Arenkiel B. R., Peca J., Davison I. G., Feliciano C., Deisseroth K., Augustine G. J., Ehlers M. D., Feng G., “In vivo light-induced activation of neural circuitry in transgenic mice expressing channelrhodopsin-2,” Neuron 54(2), 205–218 (2007). 10.1016/j.neuron.2007.03.005 [DOI] [PMC free article] [PubMed] [Google Scholar]
- 11.Wang H., Peca J., Matsuzaki M., Matsuzaki K., Noguchi J., Qiu L., Wang D., Zhang F., Boyden E., Deisseroth K., Kasai H., Hall W. C., Feng G., Augustine G. J., “High-speed mapping of synaptic connectivity using photostimulation in Channelrhodopsin-2 transgenic mice,” Proc. Natl. Acad. Sci. U.S.A. 104(19), 8143–8148 (2007). 10.1073/pnas.0700384104 [DOI] [PMC free article] [PubMed] [Google Scholar]
- 12.Yao Y., Li X., Zhang B., Yin C., Liu Y., Chen W., Zeng S., Du J., “Visual cue-discriminative dopaminergic control of visuomotor transformation and behavior selection,” Neuron 89(3), 598–612 (2016). 10.1016/j.neuron.2015.12.036 [DOI] [PubMed] [Google Scholar]
- 13.Wang K., Gong J., Wang Q., Li H., Cheng Q., Liu Y., Zeng S., Wang Z., “Parallel pathways convey olfactory information with opposite polarities in Drosophila,” Proc. Natl. Acad. Sci. U.S.A. 111(8), 3164–3169 (2014). 10.1073/pnas.1317911111 [DOI] [PMC free article] [PubMed] [Google Scholar]
- 14.Ayling O. G., Harrison T. C., Boyd J. D., Goroshkov A., Murphy T. H., “Automated light-based mapping of motor cortex by photoactivation of channelrhodopsin-2 transgenic mice,” Nat. Methods 6(3), 219–224 (2009). 10.1038/nmeth.1303 [DOI] [PubMed] [Google Scholar]
- 15.Harrison T. C., Ayling O. G., Murphy T. H., “Distinct cortical circuit mechanisms for complex forelimb movement and motor map topography,” Neuron 74(2), 397–409 (2012). 10.1016/j.neuron.2012.02.028 [DOI] [PubMed] [Google Scholar]
- 16.Lim D. H., Mohajerani M. H., Ledue J., Boyd J., Chen S., Murphy T. H., “In vivo large-scale cortical mapping using channelrhodopsin-2 stimulation in transgenic mice reveals asymmetric and reciprocal relationships between cortical areas,” Front. Neural Circuits 6(11), 11 (2012). [DOI] [PMC free article] [PubMed] [Google Scholar]
- 17.Silasi G., Boyd J. D., Ledue J., Murphy T. H., “Improved methods for chronic light-based motor mapping in mice: automated movement tracking with accelerometers, and chronic EEG recording in a bilateral thin-skull preparation,” Front. Neural Circuits 7, 123 (2013). 10.3389/fncir.2013.00123 [DOI] [PMC free article] [PubMed] [Google Scholar]
- 18.Hira R., Ohkubo F., Tanaka Y. R., Masamizu Y., Augustine G. J., Kasai H., Matsuzaki M., “In vivo optogenetic tracing of functional corticocortical connections between motor forelimb areas,” Front. Neural Circuits 7, 55 (2013). 10.3389/fncir.2013.00055 [DOI] [PMC free article] [PubMed] [Google Scholar]
- 19.Hira R., Honkura N., Noguchi J., Maruyama Y., Augustine G. J., Kasai H., Matsuzaki M., “Transcranial optogenetic stimulation for functional mapping of the motor cortex,” J. Neurosci. Methods 179(2), 258–263 (2009). 10.1016/j.jneumeth.2009.02.001 [DOI] [PubMed] [Google Scholar]
- 20.Rickgauer J. P., Tank D. W., “Two-photon excitation of channelrhodopsin-2 at saturation,” Proc. Natl. Acad. Sci. U.S.A. 106(35), 15025–15030 (2009). 10.1073/pnas.0907084106 [DOI] [PMC free article] [PubMed] [Google Scholar]
- 21.Leifer A. M., Fang-Yen C., Gershow M., Alkema M. J., Samuel A. D. T., “Optogenetic manipulation of neural activity in freely moving Caenorhabditis elegans,” Nat. Methods 8(2), 147–152 (2011). 10.1038/nmeth.1554 [DOI] [PMC free article] [PubMed] [Google Scholar]
- 22.Papagiakoumou E., Anselmi F., Bègue A., de Sars V., Glückstad J., Isacoff E. Y., Emiliani V., “Scanless two-photon excitation of channelrhodopsin-2,” Nat. Methods 7(10), 848–854 (2010). 10.1038/nmeth.1505 [DOI] [PMC free article] [PubMed] [Google Scholar]
- 23.Kleim J. A., Barbay S., Nudo R. J., “Functional reorganization of the rat motor cortex following motor skill learning,” J. Neurophysiol. 80(6), 3321–3325 (1998). [DOI] [PubMed] [Google Scholar]
- 24.Aravanis A. M., Wang L. P., Zhang F., Meltzer L. A., Mogri M. Z., Schneider M. B., Deisseroth K., “An optical neural interface: in vivo control of rodent motor cortex with integrated fiberoptic and optogenetic technology,” J. Neural Eng. 4(3), S143–S156 (2007). 10.1088/1741-2560/4/3/S02 [DOI] [PubMed] [Google Scholar]
- 25.Boyden E. S., Zhang F., Bamberg E., Nagel G., Deisseroth K., “Millisecond-timescale, genetically targeted optical control of neural activity,” Nat. Neurosci. 8(9), 1263–1268 (2005). 10.1038/nn1525 [DOI] [PubMed] [Google Scholar]
- 26.Li X., Gutierrez D. V., Hanson M. G., Han J., Mark M. D., Chiel H., Hegemann P., Landmesser L. T., Herlitze S., “Fast noninvasive activation and inhibition of neural and network activity by vertebrate rhodopsin and green algae channelrhodopsin,” Proc. Natl. Acad. Sci. U.S.A. 102(49), 17816–17821 (2005). 10.1073/pnas.0509030102 [DOI] [PMC free article] [PubMed] [Google Scholar]


