Abstract
We report on localized and simultaneous measurement of biofilm growth and local hydrodynamics in a microfluidic channel using optical coherence tomography. We measure independently with high spatio-temporal resolution the longitudinal flow velocity component parallel to the imaging beam and the transverse flow velocity component perpendicular to the imaging beam. Based on the measured velocities we calculate the shear-rates in the flow channel. We show the relation between the measured biofilm structure and flow velocities as biofilm growth progresses over the course of 48 hours.
OCIS codes: (170.3880) Medical and biological imaging, (170.4500) Optical coherence tomography, (280.7250) Velocimetry
1. Introduction
Bacteria have the ability to attach to a large variety of surfaces. Under favorable conditions individual bacteria cells can group to form large colonies called biofilms. Biofilms are characterized by the production of an extracellular matrix as well as a modified cellular growth rate when compared to planktonic organisms [1]. These altered structural and physiological states make biofilms more resistant to antibiotics, disinfectants, and germicides [1]. The formation of biofilms is characterized by a three-step process: attachment, maturation, and dispersal. During the attachment phase, individual planktonic cells attach to an inert surface to from a microcolony. With the right environmental cues the biofilm matures via cellular proliferation and the production of an extracellular polymeric matrix [2]. During dispersal, planktonic cells leave the original biofilm and can re-attach downstream at a new location and initiate another biofilm lifecycle. In biomedical applications, and particularly in the use of medical devices, this process causes spreading of infections if the host organism fails to eradicate the mobile planktonic cells [3]. In industrial applications, such as e.g., the production of drinking water, it has been shown that biofilm detachment is responsible for increased concentrations of planktonic cells and is therefore a source of persistent contamination [4]. Biofilm dispersal originates mainly from two driving mechanisms, the first is based on internal biofilm processes, such as enzymatic degradation, and the second is based on perturbations of the hydrodynamic environment, such as an increase in shear forces [5]. It has been shown that the local hydrodynamics also modifies the structure of biofilms, e.g., by creating biofilm streamers that cause exponentially fast clogging of industrial and medical flow systems [6]. Hence, simultaneous measurement of both biofilm structure and local hydrodynamic parameters is paramount for the understanding of transient biofilm dynamics such as biofilm detachment and dispersal.
Biofilm morphology and local flow have been measured by combining confocal laser scanning microscopy with particle image velocimetry [7] and by nuclear magnetic resonance [8]. More recently, the potential of optical coherence tomography (OCT) to measure biofilm structure non-invasively and label-free has been demonstrated [9]. Moreover, OCT is very well apt to measure local flow as Doppler-OCT has been applied to measure shear-rate distributions in asymmetric flow channels [10]. For biofilms, OCT imaging has been applied to study membrane biofouling [11–13], to study biofouling mitigation using two phase flow cleaning [14], to characterize biofilm structure in lab scale reactors [15], to study dynamic deformations and to estimate biofilm mechanical properties [16], to visualize biofilm formation in-vivo [17, 18], to study structural transient effects [19, 20], and to visualize biofilm growth under laminar and turbulent flow conditions [21].
In this paper, we use optical coherence tomography (OCT) to simultaneously quantify biofilm structure and the related flow velocities and shear-rates in a microfluidic channel. We measure independently with high spatio-temporal resolution the longitudinal flow velocity component parallel to the imaging beam and the transverse flow velocity component perpendicular to the imaging beam based on the OCT autocorrelation function. Based on the velocity measurements, we calculate the shear-rates inside the microfludic channel. We show the relation between the local biofilm structure and the local flow velocity as biofilm growth progresses over the course of two days.
2. Materials and methods
2.1. Optical coherence tomography system
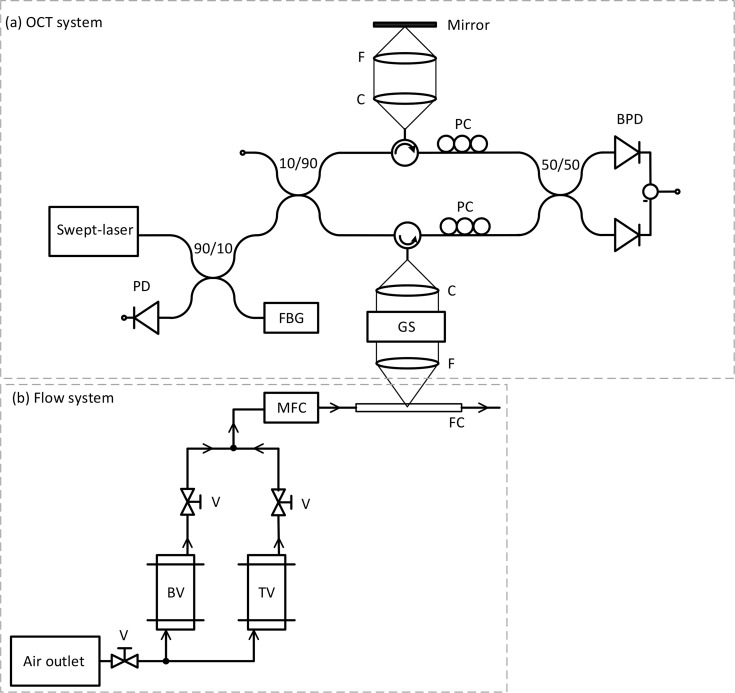
The experiments are performed with a home built fiber-based swept-source OCT system. A schematic of the experimental set-up is shown in Fig. 1(a). The description of the system has been reported elsewhere [22] but is repeated here for convenience. The system operates at a center wavelength of 1312 nm with a bandwidth of 92 nm and a sweep frequency fs = 50 kHz (Axsun Technologies). The average output power is 20.9 mW and the duty cycle is 59.4%. Data is sampled (ATS9350, AlazarTech) with an interferometrically derived external clock signal at equidistant wavenumber intervals. To ensure phase stability each sweep is triggered by the signal of a fiber Bragg grating centered at 1266 nm (OE Land) [23]. The interferometric signal is detected with a 150 MHz balanced photodetector (PDB450C, Thorlabs) and a 80 MHz low-pass filter (VLF-80+, Mini-Circuits). The trigger signal is detected with a 125 MHz photodetector (1811, New Focus). The sample and reference arms’ optics are composed of a collimating lens (PAF-X-18-C, Thorlabs) and an achromatic doublet focusing lens (AC254-040-C, Thorlabs). The power splitting ratio of the sample and reference arms is 90/10. The longitudinal resolution is wz = 8.1 ± 0.3 μm in air measured with a mirror reflector and the transverse resolution is wt = 10.8 ± 0.2 μm measured with a knife edge. The imaging beam is scanned laterally using a galvanometric mirror (GVSM002, Thorlabs).
Fig. 1.
Schematic of the experimental swept-source OCT set-up (a) and flow system (b). PD: photodetector, FBG: fiber Bragg grating, PC: polarization controllers, C: collimating lens, F: focusing lens, GS: galvanometric scanner, FC: flow channel, TV: tracer vessel, BV: bacteria vessel, V: valve, and MFC: mass flow controller. Adapted from Ref. [22].
2.2. Flow system
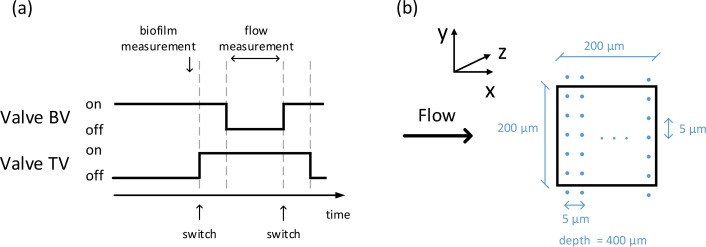
Flow is generated by two pressure vessels (Schott) and directed through a flow system consisting of tubing, valves, a mass-flow controller, and a flow channel. A schematic of the flow set-up is shown in Fig. 1(b). The flow channel was fabricated by casting Polydimethylsiloxane (PDMS) (Sylgard 184, Dow Corning) over a SU-8 master mold with the channel structure. The cured PDMS is sealed from the top with a glass plate (150 μm thickness). The flow channel has a length of 1.1 cm and a rectangular cross-section of 200 μm by 400 μm. The first pressure vessel contains a suspension of 0.5 vol.% 200 nm polystyrene spheres (PPs-0.2-S-PEG30000, Kisker). These particles act as tracers that provide backscattering from the fluid in order to measure the flow velocity with the OCT system. The second pressure vessel contains the solution with the bacteria. For growing the biofilms, the methods used in membrane filtration experiments were followed. In these experiments mixed bacterial communities are used instead of monocultures. D-glucose, sodium nitrate, and anhydrous sodium phosphate were used as nutrients and were added to tap water in a mass ratio carbon:nitrogen:phosphorous of 100:20:10 [11,24]. The initial carbon concentration was 1 mg/L. All the chemicals were purchased from Sigma-Aldrich. Both pressure vessels are driven at 1 bar and are connected to a mass flow controller (mini CORI-FLOW M12V14I, Bronkhorst) via two independent valves. During OCT flow measurements, the tracer vessel valve is open and the bacteria vessel valve is closed. During a vessel switch event both valves remain open for a period of two minutes to ensure pressure stabilization in the flow lines. For the rest of the experiment, the tracer vessel valve remains closed and the bacteria vessel valve remains open. During the entire experiment the flow rate is set to 2.5 g/h. The Reynolds number in the reference flow measurements is Re = 3. One cycle of the valve operation scheme is shown in Fig. 2(a). To reduce the effect of increased gas solubility inside the pressure vessels, the liquid phase was isolated from the gas phase with a plastic flexible container. The experiment is run for a total of 48 hours with OCT measurements taken every 24 hours.
Fig. 2.
(a) One cycle of the valve operation scheme. At a vessel switch event both valves remain open for a period of two minutes. Flow measurements are performed only when the tracer vessel valve is open. Biofilm morphology measurement is performed before opening the tracer vessel valve. (b) Top view of the flow channel showing the scanning geometry of the imaging beam. Each dot represents the position of the imaging beam in the (x, y)-plane during the scan. The step resolution in the x- and y-direction is 5 m. The main flow direction is in the positive x-direction.
2.3. Data acquisition
Biofilm morphology and flow velocities are measured over a 200 μm by 200 μm area of the flow channel over the course of two days. A schematic of the scan geometry is shown in Fig. 2(b). The beam is scanned in discrete steps of 5 μm in the x- and y-direction. At every point the imaging beam is held stationary for 600 ms to acquire the interferometric signal. Due to the lack of contrast between the biofilm and the tracer particles, the morphology of the biofilm is measured in the absence of tracers (cf. Fig. 2(a)). The flow channel is aligned such that (x, y)-plane is parallel to the focal plane of the OCT system and gravity is in the positive z-direction.
2.4. Data analysis
The depth resolved flow velocity is measured at every position (x, y) by fitting a model of the normalized autocorrelation function of the OCT magnitude for every depth independently using the model derived in Refs. [22,25,26]:
| (1) |
where the first exponential term describes the longitudinal diffusive dynamics, the two Gaussian terms respectively describe the transverse and longitudinal flow dynamics, with z representing depth and |τ| the time lag of the autocorrelation function. The additional factor of 2 in the exponents accounts for the use of the magnitude of the OCT signal in the analysis [27]. The variable D(z) is the depth resolved diffusion coefficient. The measured diffusion coefficient of the tracer particles under no-flow conditions is D(z) = 2.3 ± 0.2 μm2/s. The absolute value of the scattering vector is q = 4πn sin (α/2)/λ, with n the refractive index of the medium, λ the wavelength in vacuum, and α the scattering angle. The measured refractive index of the medium at 1312 nm is n = 1.33. Further, in the first Gaussian term, vt (z) = (vx (z)2 + vy (z)2)1/2 is the depth resolved transverse flow velocity and wt is the beam waist ((1/e) radius of the field). In the second Gaussian term, vz (z) is the depth resolved longitudinal flow velocity and wz is the waist ((1/e) radius) of the coherent detection gate. The normalization was taken with respect to g(z, 0). For our OCT set-up, the spread of q over the bandwidth is small, therefore we set q = qc at the center wavelength and α = 180°. Furthermore, under the experimental conditions described here, we assume in Eq. 1 that the spread of Doppler frequencies over the coherent detection gate can be neglected [22].
2.5. Data processing
Processing of the data is performed as follows: raw interferometric data consisting of 1088 data points is Fourier transformed to calculate the complex-valued OCT signal aOCT (z, t), where t represents time. In order to conserve the sign of the longitudinal flow velocity, the calculation of the flow velocities is performed in a two-step process. First, the longitudinal flow velocity vz (z) is measured by calculating the phase difference Δφ(z) of aOCT (z, t) of time-adjacent acquisitions as vz (z) = Δφ(z)λfs/4πn, with , where * denotes complex conjugation and [28]. Second, to measure the transverse flow velocity vt (z), we calculate the autocovariance of the magnitude of the OCT signal over 1000 time-adjacent acquisitions for every depth inside the flow channel. This process is repeated 10 times and averaged. The transverse velocity is determined in the time domain by fitting Eq. (1) to the normalized autocovariance of the data. In this fit, vt is the only fit parameter. vz and D enter the fit as constant parameters. The diffusion coefficient D is set equal to the measured no-flow value [29]. In all plots throughout the manuscript, all values of vt and vz are mean values over 3 measurements and the error bars are the corresponding standard deviations. The averaging over 3 measurements is performed by splitting the 600 ms acquisition time in three groups of 200 ms. Figure 3 shows a schematic of the fitting procedure. The shear-rate is calculated from the spatial dependence of the flow by using a fourth order central difference formula in MATLAB to approximate the derivative of the flow velocity. To calculate the cross-sectional flow rate, the velocity values are integrated using trapezoidal numerical integration.
Fig. 3.
Schematic of the processing steps to fit the transverse flow velocity: (a) Normalized magnitude of the OCT signal; the amplitude variations over time for a particular depth are shown in (b) and (c) autocovariance of the data and fit (line).
3. Results
First, we present measurements of the flow velocities at the center of the channel before the bacteria solution is seeded into the system. This serves as a reference case to demonstrate the changes in flow velocity profiles as the biofilm growth progresses inside the channel. Figures 4(a–b) show the depth resolved transverse and longitudinal flow velocity components, respectively and Fig. 4(c) shows the magnitude of the total flow velocity calculated as . The negative sign of the longitudinal flow velocity component indicates the direction at which the tracer particles are moving in the z-direction. It should be noted that the measured transverse flow velocity lacks directionality (cf. Eq. 1). The parabolas in Fig. 4(c) show the confidence interval of the reference flow velocity calculated based on the set-point of the mass-flow controller and the measured channel dimensions. The measured total flow velocity is in good agreement with the reference velocity. Due to variations of the channel geometry caused by manufacturing tolerances and imperfections, the longitudinal axis of the channel is not guaranteed to be perpendicular to the propagation direction of the imaging beam. This results in the local longitudinal flow velocity at a particular point in the channel to be non-zero.
Fig. 4.
Measured flow velocities at the center of the flow channel: (a) transverse flow velocity, (b) longitudinal flow velocity, and (c) total flow velocity. The parabolae show the confidence interval of the reference flow velocity calculated based on the set-point of the mass-flow controller and the measured channel depth and width.
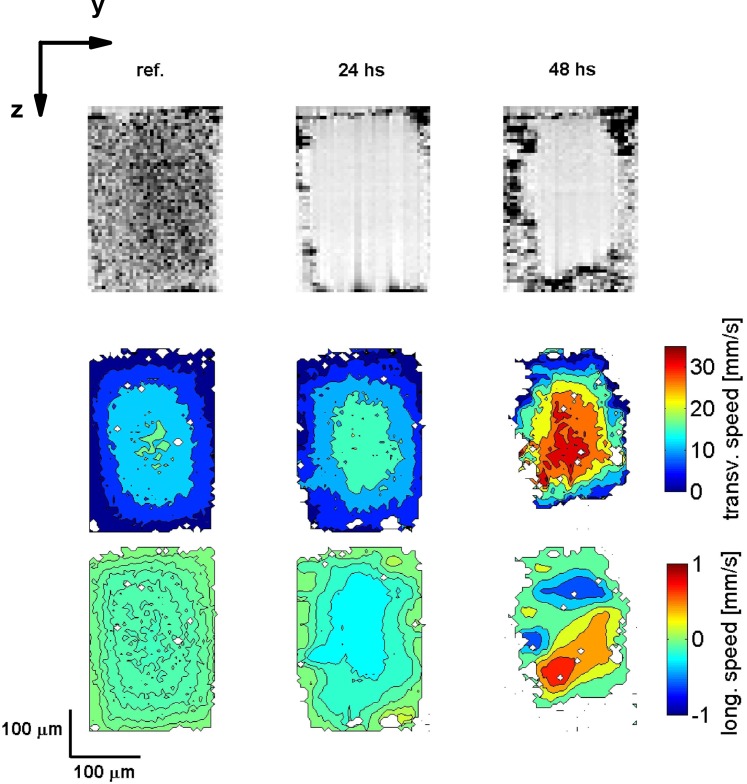
Second, we present measurements of the channel morphology and flow velocities as biofilm growth progresses. Figure 5 shows a representative cross-section of the flow channel in the (y, z)–plane. The first column shows the reference case where the channel is filled only with the suspension of tracer particles. The second and third column show the channel morphology and flow velocities after 24 and 48 hours of seeding the bacteria solution, respectively. The transverse (second row) and longitudinal (third row) flow velocities show a smooth parabolic flow profile. The growth of the biofilm at the walls of the flow channel is seen in the OCT images as a clear increase in the biofilm thickness as the experiment progresses. Biofilm growth occurs predominantly on the side and bottom PDMS walls of the channel and less on the top glass wall. Correspondingly, the transverse and longitudinal flow velocity profiles change in magnitude, where a clear increase of the maximum flow velocity is observed. The flow shape when compared to the reference case is no longer parabolic and a shift of the maximum flow velocity away from the center of the channel is observed for the transverse flow velocity. Additionally, a clear change in the direction of the longitudinal flow velocity is seen after 48 hours of growth.
Fig. 5.
Channel morphology and longitudinal and transverse flow velocities in the (y, z)-plane. The first row shows the channel morphology, the second row shows the transverse flow velocity and the third row shows the longitudinal flow velocity. The first column shows the reference data, and the second and third column show the data after 24 and 48 hours after starting the experiment, respectively. The scale of the flow velocity is the same for all three cases. The points where the velocity estimation algorithm did not converge are shown in white.
To quantify biofilm growth, we calculate the ratio of biofilm volume to channel surface area ( ) based on the type of data shown in the first row of Fig. 5. We do this for the two days of measurements. For the biofilm volume calculations we filtered the biofilm morphology data using a binary mask. In the location where we observe the biofilm we set the index to 1 and all other locations are set the index to 0. We do this for 20 cross-sections. Then we calculate the total number of elements with a value of 1 and multiply the sum with the voxel size. The channel surface area was calculated by multiplying the perimeter by the distance scanned in the x-direction. For determining the biofilm locations we select a threshold based on the gray-scale intensity picture. This results in a biofilm to surface area of after 24 hours and after 48 hours.
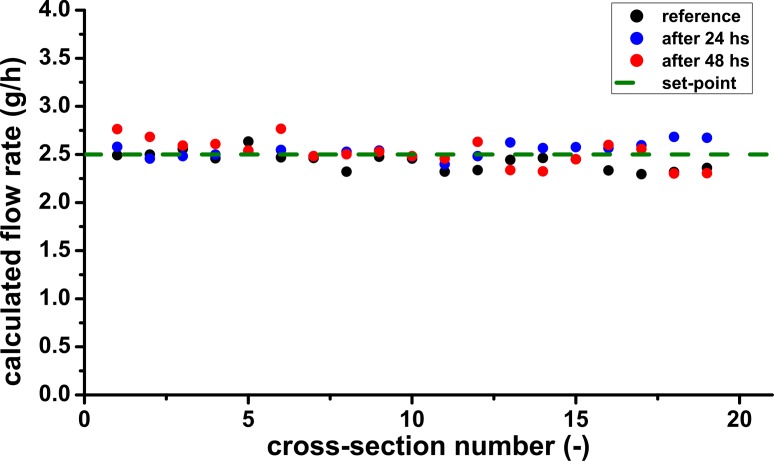
Based on the velocity and the channel morphology both quantified with our OCT based method shown in Fig. 5 the total flow rate through the channel cross-section is calculated. Figure 6 shows the results of the numerical integration of the flow velocity data for the reference measurement, for the measurement after 24 hours of growth and for the measurement after 48 hours of growth. Each data point represents a different cross-section of the channel separated by 5 μm. The data shown in Fig. 5 corresponds to the fifth cross-section. The calculated flow rate is in good agreement with the flow rate set-point of the mass-flow controller of 2.5 ± 0.05 g/h.
Fig. 6.
Flow rates through the cross-section of the flow channel calculated by numerically integrating the measured velocity data. The dashed line shows the set-point of the mass-flow controller.
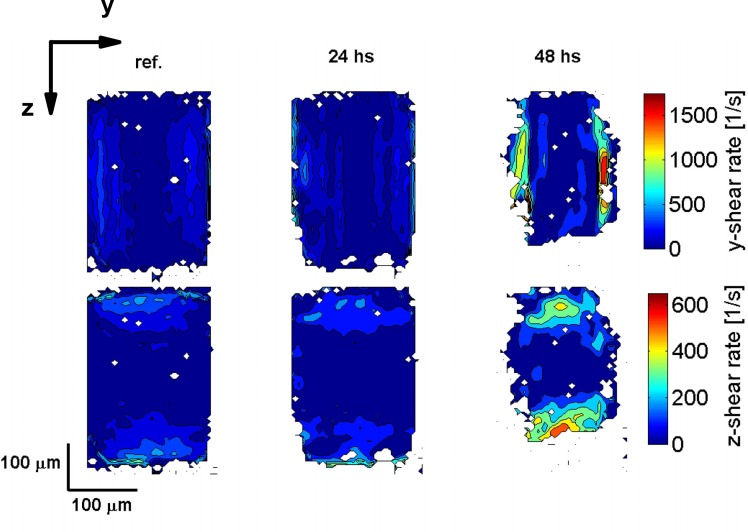
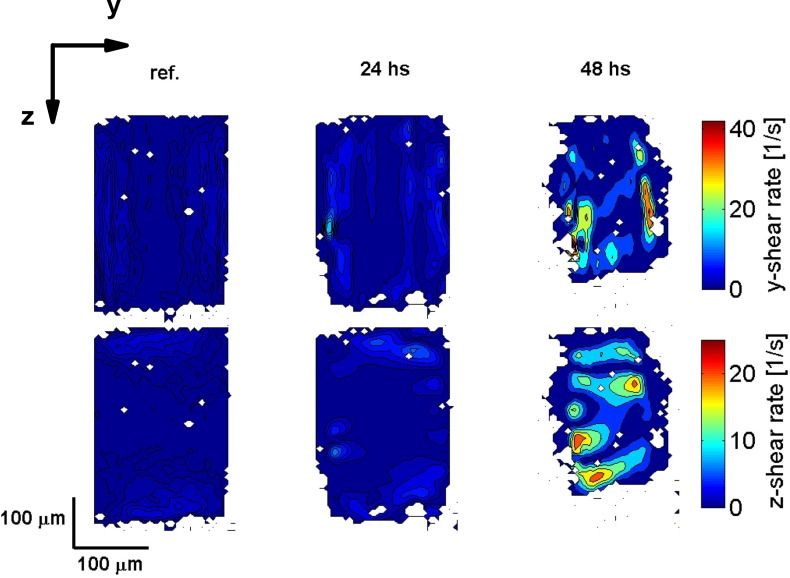
Third, we present results on the calculated shear-rates based on the velocity data shown in Fig. 5. Figures 7 and 8 show the shear-rate in the (y, z)–plane for the transverse and the longitudinal flow velocities, respectively. As before, in both figures the first column shows the reference data, and the second and third column show the data after 24 and 48 hours, respectively. The first row shows the shear-rate in the y-direction (dv/dy) and the second row shows the shear-rate in the z-direction (dv/dz). As the experiment progresses, for both velocity components, the shear-rate increases. This is attributed to the combined effect of the increase in the flow velocity and biofilm growth reducing the cross-section of the flow channel. Due to the aspect ratio of the channel, the shear-rate in the y-direction is larger than the shear-rate in the z-direction.
Fig. 7.
Calculated shear-rate in the (y, z)–plane for the transverse flow velocity component corresponding to the velocity data shown in Fig. 5. The first row shows the shear-rate in the y-direction and the second row shows the shear-rate in the z-direction. The first column shows the reference data, and the second and third column show the data after 24 and 48 hours after starting the experiment, respectively.
Fig. 8.
Calculated shear-rate in the (y, z)–plane for the longitudinal flow velocity component corresponding to the velocity data shown in Fig. 5. The first row shows the shear-rate in the y-direction and the second row shows the shear-rate in the z-direction. The first column shows the reference data, and the second and third column show the data after 24 and 48 hours after starting the experiment, respectively.
4. Discussion
Our results show that using an OCT and a microfluidic platform biofilm growth and the underlying transverse and longitudinal flow velocities can be accurately measured.
Here, we have calculated the longitudinal flow velocity vz using the Doppler shift carried by the phase of the complex-valued OCT signal. In principle, a determination of vz by fitting the autocorrelation function of the complex OCT signal is possible [22], however in this way the sign of the longitudinal velocity is lost. Further, due to the relation between the transverse velocity vt and the autocorrelation function in Eq. 1, we are only able to measure the absolute value of vt. By introducing a velocity bias by scanning the imaging beam with, e.g., a galvanometric mirror, the sign of the transverse velocity can be measured [30]. In principle, the same method can be applied to resolve the transverse flow velocity in its elementary component vx and vy. However, this would result in prolonged measuring times for each location of the flow channel.
In the experiments presented here we have used a Coriolis mass-flow controller to drive the flow through the microfluidic channel at a constant rate. Since bacteria attachment is naturally not restricted to the flow channel of interest, but takes place in all tubing and valves of the system, we observed that the performance of the stability of the mass flow controller decreases for the later stages of the experiment. We attribute this to the bacteria attachment to the tubing and valve of the mass flow controller. However, for the flow velocity measurements in the first 48 hours the input flow was stable.
Our results show that as bacteria attaches to the walls of the channel, biofilm thicknesses down to 10 μm can be clearly detected based on the OCT magnitude images. However, due to the lack of scattering of the original bacteria suspension, tracer particles were used to measure the underlying flow velocities. In order to reduce unwanted interactions of the tracers with the biofilm and the flow system, the tracers were coated with polyethylene glycol (PEG). For this work we assumed minimized biofilm-particle interactions due to the PEG coating [31,32]. The duration of the presence of tracers inside the flow channel is minimized by the duration of the OCT based flow measurement. Optimization of the scan mechanism of the imaging beam can further reduce the duration of the presented flow measurement as well as limit the interaction of the tracers with the biofilm.
We have shown that determination of the flow velocities with high spatio-temporal resolution allows for an accurate determination of the shear-rates inside the flow channel. This approach allows for the direct observation of the dynamic deformations of the biofilm surface due to shear-stress [16]. This is important for the study of biofouling processes, e.g., for the production of drinking water [11]. For the current study, we have chosen a relatively simple geometry of the flow channel. To study more complex phenomena, such as e.g., the formation of biofilm streamers [6], curved channel structures or channels with features along the flow direction can be used. Furthermore, the presented approach can be further combined with numerical modeling to study physical and biochemical processes. In order to do this, biofilm OCT images can be used to extract structural templates to serve as boundary conditions to solve Navier-Stokes and mass-transport equations [33].
5. Conclusion
We have presented simultaneous and localized measurements of the longitudinal and transverse flow velocities and quantified biofilm growth in a microfluidic channel using optical coherence tomography. We have shown that there is a clear relation between the measured flow velocity data and the biofilm morphology. We anticipate that the presented methodology will improve the quantification and understanding of the influence of flow parameters such as channel geometry and local flow driving biofilm growth dynamics.
Acknowledgments
We thank F.A.W. Coumans for discussions.
Funding
IOP Photonic Devices Program; European Research Council (307342-TRAM).
References and links
- 1.Donlan R. M., Costerton J. W., “Biofilms: Survival mechanisms of clinically relevant microorganisms,” Clin. Microbiol. Rev. 15, 167–193 (2002). 10.1128/CMR.15.2.167-193.2002 [DOI] [PMC free article] [PubMed] [Google Scholar]
- 2.Toyofuku M., Inaba T., Kiyokawa T., Obana N., Yawata Y., Nomura N., “Environmental factors that shape biofilm formation,” Biosci. Biotech. Biochem. 80, 7–12 (2016). [DOI] [PubMed] [Google Scholar]
- 3.Costerton J. W., Stewart P. S., Greenberg E. P., “Bacterial biofilms: a common cause of persistent infections,” Science 284, 1318–1321 (1999). 10.1126/science.284.5418.1318 [DOI] [PubMed] [Google Scholar]
- 4.van der Wende E., Characklis W. G., Smith D. B., “Biofilms and bacterial drinking water quality,” Water Res. 23, 1313–1322 (1989). 10.1016/0043-1354(89)90193-0 [DOI] [Google Scholar]
- 5.Hall-Stoodley L., Costerton J. W., Stoodley P., “Bacterial biofilms: from the natural environment to infectious diseases,” Nature 2, 95–108 (2004). [DOI] [PubMed] [Google Scholar]
- 6.Drescher K., Shen Y., Bassler B. L., Stone H. A., “Biofilm streamers cause catastrophic disruption of flow with consequences for environmental and medical systems,” Proc. Natl. Acad. Sci. U.S.A. 110, 4345–4350 (2013). 10.1073/pnas.1300321110 [DOI] [PMC free article] [PubMed] [Google Scholar]
- 7.Stoodley P., de Beer D., Lewandowski Z., “Liquid flow in biofilm systems,” Appl. and Environ. Microb. 60, 2711–2716 (1994). [DOI] [PMC free article] [PubMed] [Google Scholar]
- 8.Lewandowski Z., Altobelli S. A., Fukushima E., “NMR and microelectrode studies of hydrodynamics and kinetics in biofilms,” Biotechnol. Progr. 9, 40–45 (1993). 10.1021/bp00019a006 [DOI] [Google Scholar]
- 9.Xi C., Marks D., Schlachter S., Luo W., Boppart S. A., “High-resolution three-dimensional imaging of biofilm development using optical coherence tomography,” J. Biomed. Opt. 11, 034001 (2006). 10.1117/1.2209962 [DOI] [PubMed] [Google Scholar]
- 10.van Leeuwen T. G., Kulkarni M. D., Yazdanfar S., Rollins A. M., Izatt J. A., “High-flow and shear-rate imaging by use of color Doppler optical coherence tomography,” Opt. Lett. 24, 1584–1586 (1999). 10.1364/OL.24.001584 [DOI] [PubMed] [Google Scholar]
- 11.Dreszer C., Wexler A. D., Drusová S., Overdijk T., Zwijnenburg A., Flemming H. C., Kruithof J. C., Vrouwenvelder J. S., “In-situ biofilm characterization in membrane systems using optical coherence tomography: Formation, structure, detachment and impact of flux change,” Water Res. 67, 243–254 (2014). 10.1016/j.watres.2014.09.006 [DOI] [PubMed] [Google Scholar]
- 12.Akhondi E., Wu B., Sun S., Marxer B., Lim W., Gu J., Liu L., Burkhardt M., McDougald D., Pronk W., Fane A. G., “Gravity-driven membrane filtration as pretreatment for seawater reverse osmosis: Linking biofouling layer morphology with flux stabilization,” Water Res. 70, 158–173 (2015). 10.1016/j.watres.2014.12.001 [DOI] [PubMed] [Google Scholar]
- 13.West S., Wagner M., Engelke C., Horn H., “Optical coherence tomography for the in situ three-dimensional visualization and quantification of feed spacer channel fouling in reverse osmosis membrane modules,” J. Membrane Sci. 498, 345–352 (2016). 10.1016/j.memsci.2015.09.047 [DOI] [Google Scholar]
- 14.Wibisono Y., Yandi W., Golabi M., Nugraha R., Cornelissen E. R., Kemperman A. J. B., Ederth T., Nijmeijer K., “Hydrogel-coated feed spacers in two-phase flow cleaning in spiral wound membrane elements: A novel platform for eco-friendly biofouling mitigation,” Water Res. 71, 171–186 (2015). 10.1016/j.watres.2014.12.030 [DOI] [PubMed] [Google Scholar]
- 15.Li C., Felz S., Wagner M., Lackner S., Horn H., “Investigating biofilm structure developing on carriers from lab-scale moving bed biofilm reactors based on light microscopy and optical coherence tomography,” Bioresource Technol. 200, 128–136 (2016). 10.1016/j.biortech.2015.10.013 [DOI] [PubMed] [Google Scholar]
- 16.Blauert F., Horn H., Wagner M., “Time-resolved biofilm deformation measurements using optical coherence tomography,” Biotechnol. Bioeng. 112, 1893–1905 (2015). 10.1002/bit.25590 [DOI] [PubMed] [Google Scholar]
- 17.Heidari A. E., Moghaddam S., Troung K. K., Chou L., Genberg C., Brenner M., Chen Z., “Visualizing biofilm formation in endotracheal tubes using endoscopic three-dimensional optical coherence tomography,” J. Biomed. Opt. 20, 126010 (2015). 10.1117/1.JBO.20.12.126010 [DOI] [PMC free article] [PubMed] [Google Scholar]
- 18.Nguyen C. T., Jung W., Kim J., Chaney E. J., Novak M., Stewart C. N., Boppart S. A., “Noninvasive in vivo optical detection of biofilm in the human middle ear,” Proc. Natl. Acad. Sci. U.S.A. 109, 9529–9534 (2012). 10.1073/pnas.1201592109 [DOI] [PMC free article] [PubMed] [Google Scholar]
- 19.Haisch C., Niessner R., “Visualisation of transient processes in biofilms by optical coherence tomography,” Water Res. 41, 1467–2472 (2007). 10.1016/j.watres.2007.03.017 [DOI] [PubMed] [Google Scholar]
- 20.Rasmussen K., Reilly C., Li Y., Jones R. S., “Real-time imaging of anti-biofilm effects using CP-OCT,” Biotechnol. Bioeng. 113, 198–205 (2016). 10.1002/bit.25701 [DOI] [PubMed] [Google Scholar]
- 21.Wagner M., Taherzadeh D., Haisch C., Horn H., “Investigation of the mesoscale structure and volumetric features of biofilms using optical coherence tomography,” Biotechnol. Bioeng. 107, 844–853 (2010). 10.1002/bit.22864 [DOI] [PubMed] [Google Scholar]
- 22.Weiss N., van Leeuwen T. G., Kalkman J., “Localized measurement of longitudinal and transverse flow velocities in colloidal suspensions using optical coherence tomography,” Phys. Rev. E 88, 042312 (2013). 10.1103/PhysRevE.88.042312 [DOI] [PubMed] [Google Scholar]
- 23.Hendargo H. C., McNabb R. P., Dhalla A., Shepherd N., Izatt J. A., “Doppler velocity detection limitations in spectrometer-based versus swept-source optical coherence tomography,” Biomed. Opt. Express 2, 2175–2188 (2011). 10.1364/BOE.2.002175 [DOI] [PMC free article] [PubMed] [Google Scholar]
- 24.Vrouwenvelder J. S., Beyer F., Dahmani K., Hasan N., Galjaard G., Kruithof J. C., Van Loosdrecht M. C., “Phosphate limitation to control biofouling,” Water Res. 44, 3454–3466 (2010). 10.1016/j.watres.2010.03.026 [DOI] [PubMed] [Google Scholar]
- 25.Lee J., Wu W., Jiang J. Y., Zhu B., Boas D. A., “Dynamic light scattering optical coherence tomography,” Opt. Express 20, 22262–22277 (2012). 10.1364/OE.20.022262 [DOI] [PMC free article] [PubMed] [Google Scholar]
- 26.Uribe-Patarroyo N., Villiger M., Bouma B. E., “Quantitative technique for robust and noise-tolerant speed measurements based on speckle decorrelation in optical coherence tomography,” Opt. Express 22, 24411–24429 (2014). 10.1364/OE.22.024411 [DOI] [PMC free article] [PubMed] [Google Scholar]
- 27.Kalkman J., Sprik R., van Leeuwen T. G., “Path-length-resolved diffusive particle dynamics in spectral-domain optical coherence tomography,” Phys. Rev. Lett. 105, 198302 (2010). 10.1103/PhysRevLett.105.198302 [DOI] [PubMed] [Google Scholar]
- 28.Choma M. A., Ellerbee A. K., Yazdanfar S., Izatt J. A., “Doppler flow imaging of cytoplasmic streaming using spectral domain phase microscopy,” J. Biomed. Opt. 11, 024014 (2006). 10.1117/1.2193167 [DOI] [PubMed] [Google Scholar]
- 29.Weiss N., van Leeuwen T. G., Kalkman J., “Simultaneous and localized measurement of diffusion and flow using optical coherence tomography,” Opt. Express 23, 3448–3459 (2015). 10.1364/OE.23.003448 [DOI] [PubMed] [Google Scholar]
- 30.Huang B. K., Choma M. A., “Resolving directional ambiguity in dynamic light scattering-based transverse motion velocimetry in optical coherence tomography,” Opt. Letters 39, 521–524 (2014). 10.1364/OL.39.000521 [DOI] [PMC free article] [PubMed] [Google Scholar]
- 31.Banerjee I., Pangule R. C., Kane R. S., “Antifouling coatings: recent developments in the design of surfaces that prevent fouling by proteins, bacteria, and marine organisms,” Adv. Matter 23, 690–718 (2011). 10.1002/adma.201001215 [DOI] [PubMed] [Google Scholar]
- 32.Meng F., Engbers G. H. M., Feijen J., “Polyethylene glycol-grafted polystyrene particles,” J. Biomed. Mater. Res. A 70A, 49–58 (2004). 10.1002/jbm.a.30056 [DOI] [PubMed] [Google Scholar]
- 33.Li C., Wagner M., Lackner S., Horn H., “Assessing the influence of biofilm surface roughness on mass transfer by combining optical coherence tomography and two-dimensional modeling,” Biotechnol. Bioeng. 113, 989–1000 (2016). 10.1002/bit.25868 [DOI] [PubMed] [Google Scholar]


