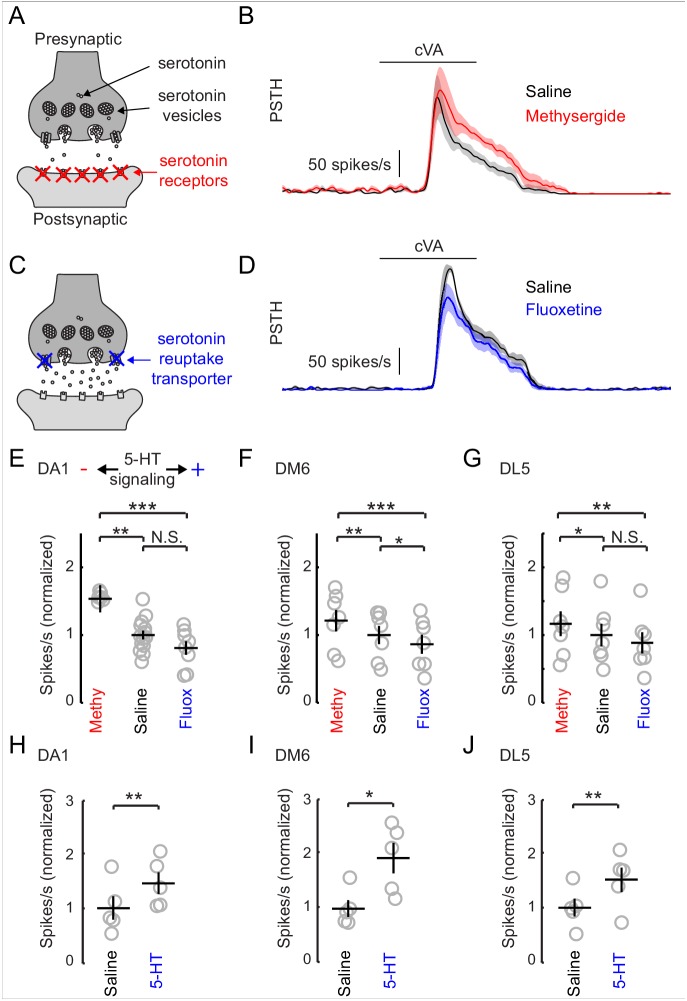
Figure 5. Increasing serotonergic transmission decreases PN responses in vivo.
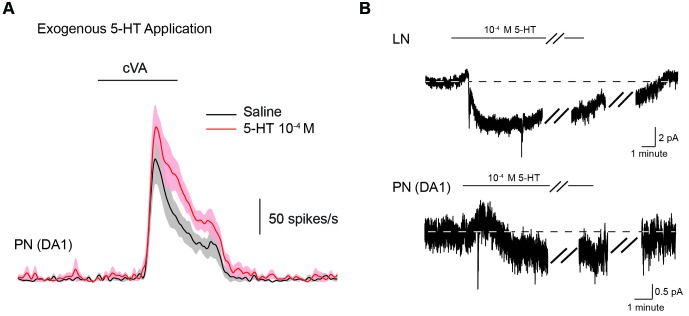
(A) A schematic of a serotonergic synapse showing vesicles and postsynaptic receptors. The receptors are blocked by the antagonist methysergide. (B) A mean PSTH of the DA1 PN responses to a 500 ms pulse of cVA in saline and methysergide. The shaded regions show the standard error of the mean. (C) A schematic representation of a serotonergic synapse showing serotonin reuptake transporters blocked by fluoxetine (10 μm). Blockade of reuptake transporters concentrates 5-HT in the synaptic cleft. (D) DA1 PN responses to a 500 ms pulse of cVA in saline and fluoxetine. (E) Quantification of DA1 responses. Data are normalized to the mean of the responses in saline. Serotonergic transmission increases from left to right (methysergide, saline, fluoxetine). n = 6 for saline vs. methy and n = 8 for saline vs fluox. ANOVA, p=8.7 × 10− 4, F = 9.46. Tukey-Kramer post-hoc test was used for panels E,F, and G. Methy vs saline p=0.0055, saline vs fluox p=0.38, methy vs fluox p=0.0008. (F) DM6 PN responses to valeric acid (10−6) under the same protocol. n = 7 for each condition, repeated measures ANOVA, p=3.5 × 10⁻⁵, F = 27.10. Methy vs saline p=0.0021, saline vs fluox p=0.036, methy vs fluox p=3.0 × 10⁻⁵. (G) DL5 PN responses to trans-2-hexenal (10−7) under the same protocol. n = 7 for each condition, repeated measures ANOVA, p=0.0025, F = 10.32. Methy vs saline p=0.049, saline vs fluox p=0.20, methy vs fluox p=0.0019. (H,I,J) PN responses from the same three glomeruli are compared in saline vs exogenous serotonin application (104 M), n = 5 for each glomeruli. DA1 p=0.005, DM6 p=0.019, DL5 p=0.008.


