

Abstract
The photophysical behavior of pyrrolocytosine (PC), a fluorescent base analogue of cytosine, has been investigated using theoretical approaches. The similarities between the PC and cytosine structures allow PC to maintain the pseudo-Watson–Crick base-pairing arrangement with guanine. Cytosine, similar to the other natural nucleobases, is practically non-fluorescent, because of ultrafast radiationless decay occurring through conical intersections. PC displays a much higher fluorescence quantum yield than cytosine, making it an effective fluorescent marker to study the structure, function, and dynamics of DNA/RNA complexes. Similar to 2-aminopurine, a constitutional isomer of adenine that base-pairs with thymine, PC's fluorescence is quenched when it is incorporated into a dinucleotide or a trinucleotide. In this work we examine the photophysical properties of isolated PC, microhydrated PC, as well as, complexes where PC is either base-stacked or hydrogen-bonded with guanine. Our results indicate that hydration affects the radiationless decay pathways in PC by destabilizing conical intersections. The calculations of dimers and trimers show that the radiative decay is affected by π stacking, while the presence of charge transfer states between PC and guanine may contribute to radiationless decay.
1 Introduction
Cytosine (C) and other natural nucleobases absorb at approximately 260 nm and exhibit very low fluorescence quantum yields (10−4).1–4 The nucleobases decay to the ground state non-radiatively, without photoemission, by passing through conical intersections (CIs) after irradiation with ultraviolet (UV) light.4–6 Nevertheless, DNA is not inert, and hence it is susceptible to photochemical reactions that are initiated by excessive exposure to UV light. Resulting photodamaged sections of the DNA sequence can possibly lead to mutation or cell death and eventually cause skin cancer.7
Modification of nucleic acids by extending the conjugation system, adding or removing different functional groups, may render them fluorescent.8 These analogues often have much higher fluorescence quantum yields, which are however significantly quenched when incorporated into DNA/RNA. Hydrogen bonding, base-stacking or base-pairing arrangements are crucial factors that dictate the quantum yields of these analogues.9 In addition to being useful as fluorescent probes, modified nucleobases can help understand the development of the genetic building blocks in prebiotic earth. The very short excited state lifetimes observed in natural nucleobases make them more photostable, since they do not live for sufficient time on the excited state for photochemistry to occur. It has been suggested that the bases were naturally selected to be the building blocks in the nucleic acids among many other existing molecules based on their photostability. It has also been suggested that before the current bases there were also other alternative bases which existed in the pre-RNA world. Photostability was very important for any base surviving because of the intense UV radiation in early earth prior to the formation of the stratospheric ozone layer. Studying modified bases provides a way to find which of these molecules have ultrafast decay and photostability.4,6,10–16
The cytosine fluorescent base analogue pyrrolocytosine (PC) can be utilized as a probe to study nucleic acid structural dynamics, owing to the sensitivity of its fluorescence quantum yield upon incorporation into DNA single and double strands.9,17–23 The difference between C and PC is the replacement of the amine group at C4 by a pyrrole (Fig. 1). The similarities in their structures allow PC to maintain the pseudo-Watson-Crick arrangement with guanine when incorporated into DNA double strands without significantly perturbing the overall structure of the nucleic acid. Previous studies on the deactivation mechanism of cytosine show that it undergoes barrierless decay to a lower energy state through several conical intersection seams.5,24–31 The Potential Energy Surfaces (PESs) for PC have not been examined, and it has not been explained how the difference in the structure affects the fluorescence yields.
Fig. 1.
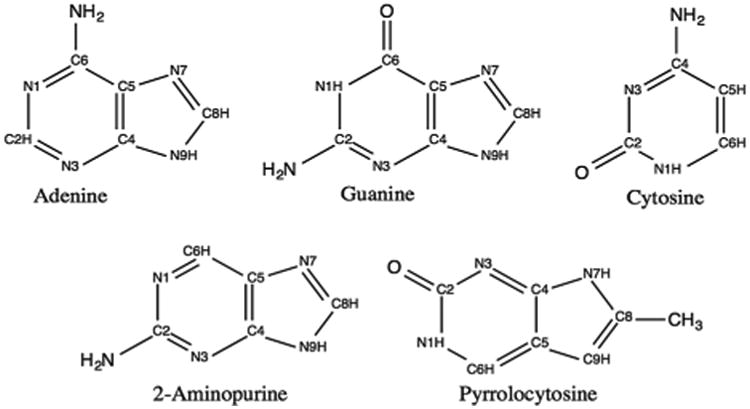
Molecular structures and labeling of adenine, guanine, cytosine, 2-aminopurine, and pyrrolocytosine.
Experimental studies show that PC's lowest singlet excitation occurs around 332 nm.32 Its emission peak red-shifts from 449 nm, in vacuo, to 460 nm, when a sugar moiety is added.32 It has been reported that PC fluorescence is reduced by 60% when incorporated into single-stranded RNA and is further reduced to 75% in double-stranded RNA.33 The effects of base stacking and base pairing on the fluorescence quantum yield of PC depend on the identity of the neighboring bases in the molecule. Hardman and Thompson have demonstrated that the fluorescence of PC is insensitive to base stacking except when surrounded by guanine moieties.32,34 Incorporating a pyrrolocytosine molecule into a dinucleotide or a trinucleotide involving guanine molecules leads to a 45% and 5% loss of fluorescence relative to that of the free base, respectively. It is suggested that base stacking alone does not lead to the observed changes. PC fluorescence is marginally enhanced when exposed to organic cosolvents and buffer solutions, while it is moderately affected by the ionic strength.32,33 Limited theoretical studies have been done on the base pair of guanine–pyrrolocytosine,34,35 where it was shown that while base stacking with guanine results in a dramatic effect on the properties of PC, the hydrogen bonding environment only slightly alters the oscillator strength of the isolated base.
2-Aminopurine (2AP) is the most popular fluorescent base analogue. The fluorescence is quenched dramatically when 2AP is incorporated into dinucleotides or oligonucleotides. For example, fluorescence of 2APG is quenched by more than 90%.36 The lifetimes also change by orders of magnitude. The mechanism for this has been investigated extensively.36 In recent work we found that the presence of exciplexes and bonded exciplexes on the excited states of the dimers with charge transfer (CT) character is likely responsible for quenching.37–39 The effect of π stacking is less severe in PC compared to 2AP. In addition, while the fluorescence decay in 2AP dinucleotides requires multiple exponentials to be fitted, PC almost always requires a single exponential.32,33
We present a theoretical study on the fluorescent properties of PC, isolated, microhydrated, or interacting with guanine. Guanine is chosen since, as discussed above, experimental work suggests that it is the only base that leads to changes in fluorescence. Initially basic features of the monomer PES are shown and differences with cytosine are highlighted to understand the different fluorescent properties of the two molecules. Then we discuss the changes of the fluorescence properties, including oscillator strengths, vertical excitation energies and fluorescent rate constants of PC when it is base-paired or base-stacked with guanine molecules. According to the literature dinucleosides containing at least one purine are conformationally flexible but exist primarily in stacked conformations in aqueous solution at around room temperature.32,40,41 The contribution of charge transfer character towards the non-radiative decay pathways of PC is also examined by calculating charge transfer (CT) states and the redox properties of PC and G using different computational methods. The redox potentials of PC are compared to 2AP.
2 Computational methods
The ground state geometries of monomer systems were optimized at the MP2/6-31G(d,p) level. Geometries of dimers and trimers were obtained from the literature in order to obtain the proper orientation, while the monomers present in them were optimized at the MP2/6-31G(d,p) level.34,35 The monomers include PC, 2AP, and G (see Fig. 1). The systems under analysis involve four models. Two of the dimers are stacked complexes where PC is placed either above or below guanine at the 5′ or 3′ terminus as it would be in B-form DNA, with 3.375 Å rise per base, and 36.00° twist. The third dimer is a G and PC base-pair. The fourth model, the 5′-GPCG-3′ trinucleotide, was also retrieved from the same reference. In this system, PC is sandwiched between two G molecules with 3.375 Å rise per base and 36.00° twist. Fig. 2 shows the hydrogen bonded dimer and the trimer structures. Optimizations of the ground state equilibrium geometries of the cations and anions of 2AP, PC, and G, were performed at the MP2 level with several Dunning correlation basis sets42 and the DFT/B3LYP level with Pople basis sets. These calculations were used to obtain adiabatic and vertical IPs and EAs, and for the determination of redox potentials as will be discussed in the results section.
Fig. 2.
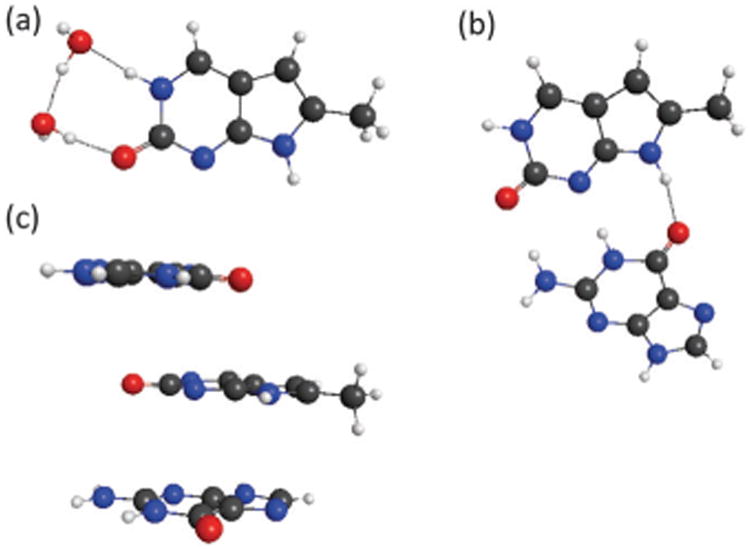
Structures of (a) PC with two water molecules, (b) PC hydrogen bonded with G, (c) π-stacked trimer 5′-GPCG-3′.
The deactivation pathway in the PC monomer was investigated utilizing the Algebraic Diagrammatic Construction through Second Order (ADC(2)) level of theory43 in combination with Ahlrichs' basis set, def2-TZVP.44–46 Additionally, multiconfigurational methods were used. Single points and optimizations of the S1 state and conical intersections between S1 and S0 for the monomer were computed at the multi-configurational complete active space self-consistent field (CASSCF) level. CASSCF energies were corrected using the n-electron valence state perturbation theory (NEVPT2).47 An active space comprising 14 electrons and 11 orbitals (9 π and two lone pairs on oxygen and nitrogen) was employed and state-average CASSCF included the ground state and the first four excited states. The cc-pVDZ basis set was used in all CASSCF and NEVPT2 calculations. The ADC(2) method was used to optimize stationary points on the S1 PES including dynamical correlation. As will be discussed below dynamical correlation is essential for the S1 PES of PC, and one has to go beyond CASSCF. The PC monomer saddle-point was located using Nudged Elastic Band (NEB) calculations to describe the minimum energy pathway between the S1 minima and the CI which utilized frozen endpoints and 10 intermediate geometries. Furthermore, the saddle-point geometry was optimized utilizing a transition state (TS) search. The CI geometry obtained using CASSCF was used as a starting geometry to optimize further on the S1 surface with ADC(2) until the S1 energy was approximately 0.1 eV above the S0 energy. This is used as the CI geometry at the ADC(2) level. It is known that ADC(2) cannot describe conical intersections between the ground and an excited state.48 For this reason, we tested the resulting geometry by performing a single point NEVPT2 calculation. The gap between S0 and S1 at the NEVPT2 level is less than 0.1 eV, indicating that this geometry is very close to a CI at the NEVPT2 level, and thus validating our approach.
The effect of the solvent on the PES was included in two separate calculations. In order to incorporate the effects of bulk solvation single point calculations for the monomer pathway geometries were undertaken with the NEVPT2 method and the inclusion of solvent utilizing the SMD solvent model.49 Further calculations were done using two explicit water molecules around PC. These calculations are used to obtain the effect of hydrogen bonding on the PES. The microhydration calculations were done at the ADC(2)/def2-TZVP level of theory.
The ADC(2)/def2-TZVP approach was used to calculate the excited states of dimers and trimers. Electron distributions to describe the excited states were depicted through the natural transition orbitals (NTOs) obtained at the ADC(2) level. The eigenvalues for the natural transition orbitals shown here are mostly above 0.95 and in one case the eigenvalue is above 0.80. Single reference methods based on perturbation theory were also used for the dimers and trimers. These methods were also applied to the monomer for comparisons. Vertical excitation energies for all systems were calculated using the configuration interaction singles (CIS) with perturbative second order corrections (CIS(D)).50 30 CIS states were included in the calculation to ensure that the CT states are present. Even though this approach is not as accurate as ADC(2) it shows similar qualitative results as will be discussed below. Furthermore, we have used it with two basis sets to examine the effect of diffuse functions. Dunning's basis sets, cc-pVDZ, and aug-cc-pVDZ were employed in combination with CIS(D). Implicit solvation effects were added to CIS(D) using the SS(V)PE solvation model as implemented in QChem.51
Calculations with the ADC(2) method were done using the Turbomole software package.52 NEB calculations were performed with the Turbomole and the Chemshell53 software package. Calculations for the determination of the ionization potentials and electron affinities were done with the Gaussian0354 software package. The QChem computational package was used for all CIS(D) calculations.55 All monomer and dimer geometries were viewed and rendered with Macmolplt56 and WebMO.57 Orca58 was utilized for NEVPT2 calculations including the SMD solvation model.
3 Results and discussion
3.1 Pyrrolocytosine monomers
The excited states of PC are examined first, focusing particularly on why this molecule fluoresces much more than its analogue, cytosine. Table 1 shows results for the first excited state of PC at various theoretical levels. Results for more states are shown in the ESI† (Tables S1–S5). At all levels of theory examined here the first excited state is a bright ππ* state. The energy for the first ππ* transition of PC obtained from NEVPT2/cc-pVDZ, 3.76 eV, is very similar to the CIS(D)/aug-cc-pVDZ level at 3.77 eV, while at the ADC(2) level it is 3.52 eV. When solvation is added to the calculations (implicit or explicit) the S1 state is blueshifted by 0.06–0.14 eV. Both implicit NEVPT2/SMD and explicit ADC(2) (+2 water molecules) give values close to the experimental value from the literature measured in pH 7 phosphate buffer at 25 °C, 3.74 eV,32 with the first approach overestimating the excitation energy by about 0.08 eV while the second underestimates it by 0.08 eV.
Table 1.
Excitation energies and oscillator strengths of the first excited state in PC, PCG-Hbonding, 5′-PCG-3′,5′-GPC-3′,5′-GPCG-3′. “water” means SMD for NEVPT2 and SS(V)PE for CIS(D) calculations
| E/eV | f | |
|---|---|---|
| PC | ||
| CIS(D)/aug-cc-pVDZ | 3.77 | 0.255 |
| CIS(D)/cc-pVDZ | 3.91 | 0.301 |
| CIS(D)/cc-pVDZ/water | 4.10 | 0.287 |
| ADC(2)/def2-TZVP | 3.52 | 0.083 |
| ADC(2)/def2-TZVP + 2H2O | 3.66 | 0.087 |
| NEVPT2(14,11)/cc-pVDZ | 3.76 | 0.089 |
| NEVPT2(14,11)/cc-pVDZ/water | 3.82 | 0.093 |
| Experiment32 | 3.74 | |
| PCG-Hbonding | ||
| CIS(D)/aug-cc-pVDZ | 3.74 | 0.261 |
| CIS(D)/cc-pVDZ | 3.89 | 0.303 |
| CIS(D)/cc-pVDZ/water | 4.08 | 0.306 |
| ADC(2)/def2-TZVP | 3.51 | 0.085 |
| 5′-PCG-3′ | ||
| CIS(D)/aug-cc-pVDZ | 3.79 | 0.200 |
| CIS(D)/cc-pVDZ | 3.94 | 0.248 |
| CIS(D)/cc-pVDZ/water | 4.08 | 0.234 |
| ADC(2)/def2-TZVP | 3.54 | 0.064 |
| 5′-GPC-3′ | ||
| CIS(D)/aug-cc-pVDZ | 3.72 | 0.208 |
| CIS(D)/cc-pVDZ | 3.88 | 0.255 |
| CIS(D)/cc-pVDZ/water | 4.06 | 0.245 |
| ADC(2)/def2-TZVP | 3.47 | 0.066 |
| 5′-GPCG-3′ | ||
| CIS(D)/cc-pVDZ | 3.90 | 0.209 |
| CIS(D)/cc-pVDZ/water | 4.05 | 0.200 |
| ADC(2)/def2-TZVP | 3.48 | 0.050 |
All levels of theory predict the S2 state to be 0.82 to 1.11 eV above S1 (see ESI†). This is in contrast to cytosine, where previous studies report small spacings between the first two states that vary between 0.03 and 0.4 eV.24,30,59,60 The first bright transition in C is also a ππ* state followed closely by two dark transitions, which correspond to the nπ* type.5,24–30 Another main difference between C and PC is the energy of the S1 ππ* state which is considerably red-shifted in PC. This is expected since the expansion of the conjugated system leads to a red shift in the excitation energies to ππ* states. Without diffuse functions S2 and S3 of PC are nπ* states, however, with the inclusion of diffuse functions the Rydberg state is stabilized and becomes the second excited state.
In order to describe and analyze the fluorescence in the monomer, minima on the S1 PES and conical intersections with the ground state were sought. Multiconfigurational methods are needed for optimizing CIs, since these cannot be described by single reference methods. In PC however the situation becomes more complicated since dynamical correlation is important for the geometries of S1. This is evident in the S1 minimum predicted by CASSCF, which, when dynamical electron correlation is included, has energy higher than the vertical excitation (an unphysical result). For this reason optimizations were carried out using ADC(2) (since there are no analytic gradients available for NEVPT2 it is not possible to use that method). The S1 minimum is found using ADC(2), while the minimum point on the CI seam is first optimized using CASSCF. In order to add the effects of dynamical correlation the CI geometry is refined by optimizing the S1 state further until the gap between S1 and S0 is less than 0.1 eV. The gap between S0 and S1 at the NEVPT2 level using that geometry is less than 0.1 eV, indicating that this geometry is very close to a CI at the NEVPT2 level, and thus validating our approach.
Fig. 3 shows the results obtained for the stationary points on the S1 surface at the ADC(2) level. Two very similar S1 minima were found with energy 3.04 eV, 0.5 eV lower than the vertical excitation energy. The S1 minima exhibit slight pyramidalization at N1 with the C6 hydrogen atom slightly lifted out of plane. The loss of planarity and symmetry due to pyramidalization results in the existence of two closely related S1 minima. The minima are different from the S0 minimum in having shorter N1–C2, C2–N3, C4–C5 bonds by, respectively, 0.01, 0.06, and 0.06 Å, and longer N3–C4, C2–O bonds by 0.07, and 0.05 or 0.04 Å (due to slight differences in the S1 minimum geometries at the C2–O bond).
Fig. 3.

S1 deactivation pathway for the PC monomer in vacuo (top) and hydrogen-bonded with two water molecules (bottom) at the ADC(2)/def2-TZVP level.
A conical intersection was found for PC using CASSCF. Refining the geometry using S1 optimization at the ADC(2) level gave a geometry with a smaller S0–S1 gap at the ADC(2) level. The two geometries are quite similar. The ADC(2) CI geometry involves puckering of N1 and the folding of the molecule through the C4–C5 bond. Lengthening in N1–C2, N3–C4, and C5–C6 bonds by, respectively, 0.15, 0.04, and 0.11 Å, and shortening in C2–N3, C4–C5, C2–O by 0.04, 0.05, 0.02 Å are also observed. The average energy of S1 and S0 at the ADC(2) level is 0.07 eV lower than the S1 minimum. Using the nudged elastic band method in conjunction with the ADC(2) method, a second-order saddle point was located along the pathway between the S1 minimum and the conical intersection. The larger frequency is representative of the pathway reaction coordinate along the decay leading to the CI. The second frequency describes the rotation of the PC methyl group, and this is not an important mode. Since it was not possible to find the true TS where methyl rotation is not at a maximum we use this saddle point as the TS. At the ADC(2) level the barrier from S1 to TS is 0.18 eV.
The path of the S1 surface has been re-evaluated using single point NEVPT2 calculations (shown in the ESI,† Fig. S1 and Table S1). The energy of the S1 minimum is 3.55 eV. NEVPT2 also predicts that the energy at the approximate CI is 3.17 eV, which is also lower in energy than the S1 minima obtained. Furthermore, the single point energy calculation at the transition state geometry optimized with ADC(2) shows that it lies below the S1 minimum at the NEVPT2 level.
In both ADC(2) and NEVPT2 results the barrier is predicted to be small or negligible, and these calculations predict that the gas-phase species will most likely not exhibit high quantum yield for fluorescence. Leutwyler and coworkers have illustrated that the excited state lifetimes and fluorescence of another fluorescent base analogue, 2AP, depend on microhydration, and specifically the excited state lifetime increases with the addition of water molecules.61 A theoretical study of the effect performed by Barbatti and Lischka62 illustrated that the barrier is a consequence of hydrogen-bonding with the N1 nitrogen prohibiting deactivation along the reaction coordinate. Similar effects may be realized for PC. A strong solvent effect has been observed in the fluorescence of PC, reinforcing this idea.33 Specifically, it was found that the free PC fluorescence increases 3.5-fold and 2.2-fold upon addition of 50% ethanol and formamide, respectively.33
In order to examine the effect of H-bonding we performed calculations including two water molecules at the ADC(2) level. The two water molecules are H-bonded on the O and N1–H sites. The ground state minimum geometry is shown in Fig. 2a. The results of the S1 pathway are shown in Fig. 3. The fluorescence maximum in these calculations is 2.67 eV which is close to the experimental value of 2.76 eV. Furthermore, the energy of the CI is destabilized and it is now 0.44 eV higher than the S1 minimum. This indicates that H-bonding by solvent molecules makes the CI less accessible, and will likely lead to increased fluorescence in PC when solvated. It should be noted that implicit solvation is not as important as the H-bonding with water (see Table S2 in the ESI,† for the energies of the S1 including implicit solvation).
3.2 Pyrrolocytosine interacting with guanine
This section focuses on the radiative decay in PC so we will only discuss excited states in the Franck–Condon (FC) region.
3.2.1 Hydrogen-bonding complex
First we will examine the effects of hydrogen bonding between PC and guanine on the excited state properties. Table 1 shows the first excited state for the hydrogen bonded base pair (denoted PCG-Hbonding), while a more extended table can be found in the ESI† (Table S6). The first excited state is a ππ* state localized on PC. The NTOs for this transition are shown in Fig. 4. This state is slightly redshifted (0.01–0.03 eV) in the dimer compared to the monomer. Previous studies using the TD-B3LYP/6-31++G(d,p) method predicted that the first transition involves CT character,35 but the current results do not show any charge-transfer states at low energies. It is widely known that TDDFT with many of the traditional functionals such as B3LYP cannot properly describe CT states.63 Our studies support the idea that no molecular orbitals delocalize across more than one base in the lowest energy transitions.
Fig. 4.

Natural transition orbitals at the ADC(2)/def2-TZVP level for the lowest transitions of (a) 5′-PCG-3′ (b) PCG-Hbonding (c) 5′-GPC-3′ (d) 5′-GPCG-3′.
The effect of hydrogen bonding on the oscillator strength of the first excited bright state is also important in this study, since this shows how the other base affects the radiative lifetime of the excited state. Oscillator strengths for the base-pair obtained at various levels of theory are shown in Table 1. Our results show that the oscillator strength increases by a small amount (1–7%) when PC is H-bonded to guanine. There are currently no available experimental results for the hydrogen bonding base pair to compare with. Overall, base-pairing does not significantly affect the nature of excited state character in PC in the Franck–Condon region.
3.2.2 Base-Stacking in pyrrolocytosine
Dinucleotides
Results for the energies and oscillator strengths of S1 for the π-stacked dimers of PC with G are presented in Table 1. The lowest singlet excitation is ππ* for both systems, with orbitals localized on PC only (Fig. 4). Depending on whether PC is at the 5′ or 3′ position the energy of S1 is either blue-shifted or red-shifted by a small amount, respectively (+0.02, −0.05 eV at the ADC(2)/def2-TZVP level). The oscillator strength of S1 decreases in both dimers at all levels of theory used indicating that p-stacking has an effect on the radiative decay. The decrease is very similar regardless of the level of theory. At the ADC(2)/def2-TZVP level it is about 23% for 5′-PCG-3′ and 21% for 5′-GPC-3′. This change in radiative lifetime will be used below to try to explain the experimental changes in fluorescence. We have further investigated whether this change in oscillator strength is caused by the wavefunctions of the monomers interacting or whether it is because of the steric/electrostatic effects. We compared CIS calculations for the dimers where either both monomers are treated quantum mechanically or only PC is quantum mechanical while guanine is replaced by CHELPG point charges on each atom. The decrease in the oscillator strength is not present when only partial charges represent G indicating that the interaction of wavefunctions is responsible for it.
Trinucleotides
Similar to the dimer, the lowest transition in the trimer is ππ* with molecular orbitals localized on PC (Fig. 4). Table 1 shows that sandwiching PC between two guanines redshifts the S1 energy by 0.04 eV with respect to the dimers while it reduces the oscillator strength of PC by 40%. In agreement with our results, Hardman et al. reported a 38% reduction in the oscillator strength of PC at the CIS/6-31++G(d,p) level; however, only a 5% fluorescence reduction is observed for 5′-GPCG-3′ in pH 7 phosphate buffer at 25 °C.32,34 Thus π-stacking does not seem to be the only contributor in the fluorescence intensity changes in the trimer.
3.3 Fluorescent properties and comparisons with experiment
We will now use our theoretical results to estimate radiative lifetimes of the excited states and compare with experimental values. The oscillator strengths can be related to the fluorescence rate constants, which are used to predict the behavior of the fluorescence quantum yields by equations.
| (1) |
| (2) |
| (3) |
where kr stands for the radiative rate constant of fluorescence, f is the oscillator strength, and knr is the nonradiative decay rate constant. νij is the frequency of the fluorescence transition, ħ is Planck's constant, ε is the permittivity of space, c is the speed of light, μij is the transition dipole moment, me and e are the mass and charge of the electron, all in SI units. Using these equations and the calculated energies and oscillator strengths we can calculate kr. The experimental kr is obtained from eqn (3) using the experimental values for fluorescence quantum yields and total lifetimes were. In the trimer two decay times were obtained from the fitting. In this case eqn (3) cannot be used. This multiexponential indicates that there are more than one process involved or more than one environment affecting the excited state behavior. The experimental properties are shown in Table 2.
Table 2.
Experimental fluorescent quantum yields (Φ), lifetime (τ in ns), emission wavelengths (λe in nm), radiative and nonradiative rate constants (kr & knr), and the fluorescence reduction (%red) for PC and the dimer and trimer systems. All kr, knr values are reported with a magnitude of 10−7 s−1. All experimental values are taken from ref. 32
| λe | Φ (%red) | τtotal | kr (%red) | knr | |
|---|---|---|---|---|---|
| PC | 449 | 0.038 | 2.86 | 1.3 | 34 |
| PCtp | 460 | 0.028 (−26) | 2.13 | 1.3 (−1) | 46 |
| 5′-PCG-3′ | 452 | 0.021 (−45) | 1.98 | 1.1 (−20) | 49 |
| 5′-GPCG-3′ | 451 | 0.036 (−5) | 0.65, 2.64 |
Emission energies should be obtained from the minimum on the excited state. However in the current calculations we only optimized a minimum for the monomer, since it would be complicated to find minima for the dimers and trimers in these gas phase calculations. The error of using absorption instead of emission values will be estimated by comparing the absorption and emission energies of PC. The theoretical fluorescence rate constant computed using the NEVPT2 emission energy and oscillator strength is 1.65 × 10⁷ s−1, in excellent agreement with the experimental value of 1.33 × 10⁷ s−1. If instead we use the absorption NEVPT2 energy and oscillator strength we predict a value of 5.43 × 10⁷ s−1, more than 3 times larger than the value using emission properties, and 4 times larger than the experimental value. Since the ADC(2)/def2-TZVP method was used for the dimers we can also calculate kr using the ADC(2)/def2-TZVP absorption properties, and in that case we find a value of 4.46 × 10⁷ s−1, somewhat smaller than the NEVPT2 value. The assumption that we make in the following discussion is that the error between absorption and emission will most likely be similar for all species we study and it will not affect our conclusions on relative changes on radiative constants. One reason to believe that this assumption is reasonable is the fact that the experimental emission wavelengths for dimers and trimers are not very different from the monomer, indicating that the same type minimum is involved in all cases.
Table 3 lists the theoretically derived fluorescence radiative rate constants for PC, 5′-PCG-3′, PCG-Hbonding, and 5′-GPCG-3′. The theoretical kr is reduced from 4.46 × 10⁷ s−1 to 3.47 × 10⁷ s−1 when PC is incorporated into the 5′-PCG-3′ dimer, which corresponds to a 22% fluorescence quenching. kr for 5′-GPC-3′ is also 23% smaller than the monomer. Experimentally kr decreases by 20%, in good agreement with the value we predict. Base stacking reproduces the experimental changes in fluorescence, providing evidence that the observed fluorescence decay is possibly due to π-stacking interactions affecting the radiative decay.
Table 3.
Theoretical energies (in eV) and absorption wavelengths (in nm) of PC and the dimer and trimer systems calculated based on the ADC(2)/def2-TZVP method. kr values are reported with a magnitude of 10−7 s−1
| E | λa | f | kr (%red) | |
|---|---|---|---|---|
| PC | 3.52 | 352 | 0.083 | 4.46 |
| 5′-PCG-3′ | 3.54 | 350 | 0.064 | 3.47 (−22) |
| 5′-GPC-3′ | 3.47 | 357 | 0.066 | 3.44 (−23) |
| PCG-Hbonding | 3.51 | 353 | 0.085 | 4.54 (1.8) |
| 5′-GPCG-3′ | 3.48 | 356 | 0.050 | 2.64 (−41) |
Meanwhile, a small rise in the fluorescent rate constant is observed for the hydrogen bonding model, which is predicted to be 4.54 × 10⁷ s−1 compared to the value of 4.46 × 10⁷ s−1 for the monomer. This result agrees with what is seen for the oscillator strength of this system, which is enhanced due to the hydrogen bonding environment. No experimental values have been reported for this arrangement.
For the trimer we predict a 41% decrease in kr. The two experimentally observed lifetimes of PC in the trimer, 0.65 and 2.64 ns, are listed in Table 2.32 The weighted-average quantum yield of the trimer in two disparate environments, 0.036, is 5% lower than that of the isolated base. Clearly our results do not predict the experimentally observed effect on fluorescence, indicating that the observed behavior is not due to the π-stacking interactions affecting the radiative decay (as was the case in the dimer). It should be pointed out however that we do not know the experimental kr for the trimer since there are two lifetimes observed, so eqn (3) cannot be used, so we cannot directly compare our radiative results to experiment. An explanation that has been given previously is that the extra G moiety in the system is thought to preserve the fluorescence of PC by shielding it from the solvent molecules, causing the predicted fluorescence loss to be much higher than the experimental value. Overall, the behavior of the trimer is more complicated involving more than one process.
Fluorescence quenching in PC by neighboring bases is not as large as in 2AP, where more than 90% of the fluorescence is quenched. Furthermore, in 2AP multiple exponential decays are needed to fit the fluorescence decays while in PC a single exponential is needed for the dimers and two for the trimer. In 2AP the fluorescence quenching can be explained by various radiationless pathways leading to exciplexes and conical intersections. What is seen here for PC is a much smaller effect for the dimers can be reproduced by examining changes in radiative rates. In the trimer however two lifetimes are observed and one of them is much faster than the lifetimes in the monomer and dimer. This indicates that in the trimer fast radiationless decay is possible, and some of the mechanisms found in 2AP may be applied here as well. In the next section we explore the CT states in the PC π-stacked systems in order to examine their possible involvement in radiationless decay pathways.
3.4 Charge transfer states
It has been found that nonradiative decay in interacting chromophores can be quenched through electron migration between neighboring bases on the excited state. CT states have been found as a responsible mechanism for the fluorescence loss in some other base analogues, such as 2-aminopurine.37–39 CT is believed to depopulate the excited state and ultimately lead to the shortening of lifetime.64 To examine the effect of charge-transfer processes in these systems, we first need to find the energies of CT states. We also need to calculate the redox properties for G and PC in order to find the driving forces for electron transfer. The TDDFT method with common functionals has been proven to provide inaccurate (underestimated) energies for the charge-transfer states.63 CIS on the other hand overestimates the energies of CT states.65 ADC(2) is a more balanced treatment of CT states, and results using this approach are reported here. When perturbation theory is added to CIS (at the CIS(D) level) and enough CIS states are included in the calculation it is possible to get good results for CT states. We report the CIS(D) results in the ESI† to demonstrate this point. Fig. 5 shows results at the ADC(2)/def2-TZVP level for monomers, dimers and trimers and compares them to each other. States with partial charge transfer character are denoted as CT in that chart while states where the charge transfer is more complete are shown as ET.
Fig. 5.
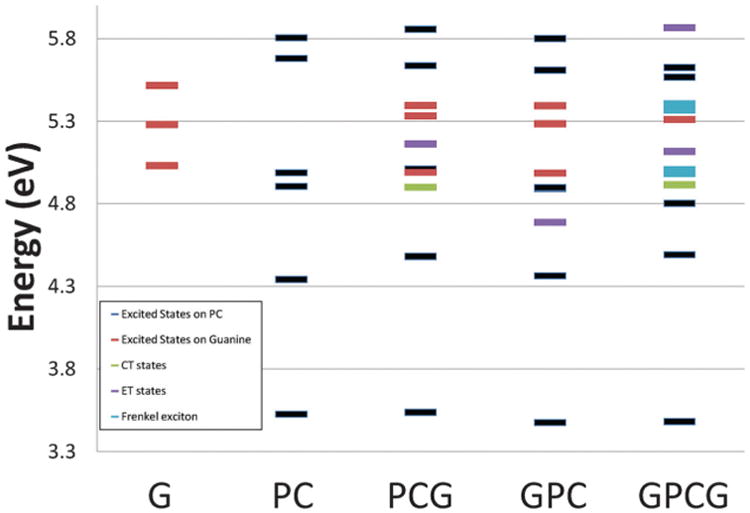
Excited states of G, PC, the dimers and the trimer formed between them calculated at the ADC(2)/def2-TZVP level of theory.
For 5′-PCG-3′ the first ET state is the S6 state with an excitation energy of 5.16 eV, more than 1.5 eV above the first excited state. Electron transfer occurs from guanine to PC. A small amount of charge transfer is shown in the S3 state as well. Natural transition orbitals describing the transitions are shown in Fig. 6. For 5′-GPC-3′ the first ET state is at 4.69 eV. In both cases the ET state is more than 1 eV above the first bright state so it is unlikely that it will be populated initially upon absorption. The difference in excitation energies for the ET states indicates that it is somewhat easier for the electron to be transferred from 5′ G. The movement of the π electron from the highest occupied molecular orbital (HOMO) of G to the lowest unoccupied molecular orbital (LUMO) of PC suggests that guanine is the stronger reducing agent.
Fig. 6.
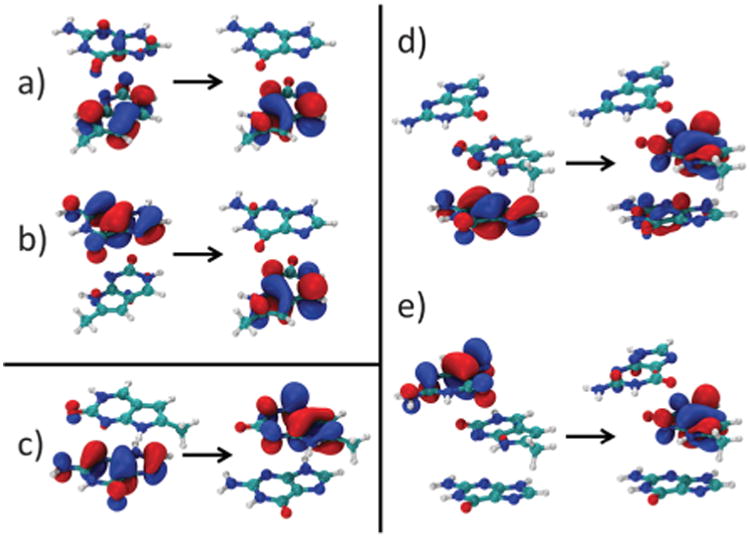
ADC(2) natural transition orbitals describing the first CT/ET state in (a) 5′-PCG-3′ S3 CT (b) 5′-PCG-3′ S6 ET (c) 5′-GPC-3′ S3 ET (d) 5′-GPCG-3′ S4 CT (e) 5′-GPCG-3′ S8 ET.
In the trimer, the first partial CT state has an excitation energy of 4.91 eV while a pure ET state is at 5.12 eV, both states more than 1.4 eV higher than the S1 bright ππ* state. In CT the electron is promoted from the HOMO of 5′ G to the LUMO of PC while in ET it is promoted from the G located at the 3′ terminus to PC. This oscillator strength of the mixed CT is 0.0294 while for ET is much smaller, 0.0094. Even though initially the gap between S1 and S2 is large and the CT states are not directly populated in the FC region, the involvement of CT cannot be ignored. Relaxation away from the FC region may stabilize these states leading to minima with CT character and additional decay mechanisms. This behavior has been found in several π-stacked bases including 2AP systems,66 and could play a role in the PC systems as well.
3.5 Redox properties
Overall, the direction of the π-electron transfer suggests that PC is a stronger oxidizing agent than G. We calculated the redox properties of PC and compared them to G and 2AP for a better understanding of the likelihood for electron transfer. The redox properties of 2AP have been studied extensively, and here we compare the 2AP results with experimental values in order to validate our approach. The calculated IP and EA values at the B3LYP level are shown in Table 4. Details and additional calculations are given in the ESI.† These results show that PC has the lowest IP and 2AP has the highest IP. PC is also the only base that has a positive EA indicating that it can accept an electron easier than 2AP or G. Our calculations for isolated bases in the gas phase confirm that the one-electron ionization of guanine by PC is a favorable process.
Table 4. Vertical (V) and adiabatic (A) electron affinities and ionization potentials in eV for PC, 2AP, and G computed.
| PC | 2AP | G | |||
|---|---|---|---|---|---|
|
|
|
|
|||
| A | V | A | V | A | V |
| Electron affinity B3LYP/6-311+G(2df,p) | |||||
| 0.15 | −0.02 | −0.32 | −0.46 | −0.36a | −0.39 |
| Ionization potential B3LYP/6-31++G(d,p) | |||||
| 7.41 | 7.54 | 7.83 | 7.97 | 7.63 | 7.87 |
Dipole-Bound.
The EA and IP calculated values are used to calculate redox properties referenced to NHE using the equations obtained by Crespo-Hernandez et al.67
| (4) |
These expressions are the linear fits of the oxidation potential vs. the IP and the reduction potential vs. EA for more than 20 organic molecules and DNA bases. The IPs and EAs were computed at the DFT/B3LYP level with the 6-31++G(d,p) (for IPs) and 6-311+G(2df,p) (for EAs) basis sets. Hence, we also use our results obtained using these two basis sets to determine the redox potentials for each monomer. The results are shown in Table 5. PC has the smallest and the most positive . The redox properties of 2AP have been measured previously,68 was found to be 1.6–1.7 V depending on the solvent while our theoretical value is 1.88 V. was measured to be −2.1– (−2.3) V while our value is −2.47 V. In both cases our values are within 0.3–0.4 V from the experimental values. The larger error appears in the Ered of guanine, and this is because the gas phase calculations predict a dipole bound state anion for this molecule.
Table 5.
Redox potentials for PC, 2AP, and G in the gas phase, in V. Experimental values for 2AP are shown from ref. 68
| Redox potentials | |||||||||||
|---|---|---|---|---|---|---|---|---|---|---|---|
|
| |||||||||||
| PC | 2AP | G | |||||||||
|
|
|
|
|||||||||
|
|
|
|
|
|
|
||||||
| S0 | 1.64 | −2.11 | 1.88 | −2.46 | 1.82 | −2.41 | |||||
| S0 exp | 1.6–1.7 | −2.1-(−2.3) | 1.5–1.7 | −2.8–(−3.0) | |||||||
| S1 | −1.9 | 1.4 | −1.8 | 1.2 | |||||||
| S1 exp | −2.0 | 1.4 | |||||||||
Since we are interested in photoinitiated CT occurring when the fluorescent probes are excited, the excited state redox properties of these probes need to be studied. These are calculated using the origin of the S1 state, E00. The experimental value of E00 in 2AP is 3.6 eV,68 while for PC we use the NEVPT2 value of 3.55 eV. Using these values and the equations below we can get the excited state redox potentials:
| (5) |
The resulting values are shown in Table 5. The values for 2AP are similar to the experimental values,68 providing some confidence that we are able to predict these properties with reasonable accuracy.
Finally, using the redox properties we can calculate the free energy of electron transfer for the quenching of PC or 2AP by G based on the Rehn–Weller equations.69 The free energies for the nucleobase base oxidation (NBO) and reduction (NBR) processes:
| (6) |
Because of the large error in guanine Ered we will use the experimental values for guanine ( and ) instead of the theoretical ones. The results in Table 6 show that the oxidation of G by PC is more favorable than the oxidation of G by 2AP, while the reduction of G by either fluorescent probe is not favorable. Experimentally, it has been shown that the oxidation of G by 2AP is more favorable than reduction.68 Given the great uncertainty in the values of EA our results may not be taken quantitative. However, the comparison between PC and 2AP should be valid, and especially the fact that PC is a stronger oxidizing agent than 2AP.
Table 6. Oxidation and reduction free energies of 2AP-G and PC-G in eV.
| Free energies | ||||||||
|---|---|---|---|---|---|---|---|---|
|
| ||||||||
| PC & G | 2AP & G | |||||||
|
|
|
|||||||
|
|
|
|
|
|||||
| Excited state | 0.1 | 1.0 | 0.4 | 1.1 | ||||
4 Conclusions
In this work we examined fluorescence properties of PC, initially isolated and then in dimers and trimers with guanine. The excited S1 state PES of PC shows that a very small barrier separates the S1 minimum from a conical intersection, indicating that fast radiationless decay is possible. When water molecules are H-bonded to PC, however, the CI is destabilized indicating that solvation increases fluorescence.
π-Stacked dimers 5′-PCG-3′ and 5′-GPC-3′ have decreased fluorescence quantum yield which can be explained by reduction in the radiative rates for fluorescence due to π stacking. The trimer 5′-GPCG-3′ however has a more complicated behavior. Two excited state lifetimes are observed indicating more than one pathway contributing to the excited state behavior. One of the decay components shows a shorter lifetime, indicating a strong nonradiative component. The excited state calculations performed here show that the radiative component alone cannot explain the experimental findings. On the other hand, several CT states exist at higher energies, which may be stabilized away from the FC region leading to the fast radiationless decay component. Calculations of redox properties support the possibility that the photoinitiated oxidation of G by PC is possible, and that PC is a better oxidizing agent than 2-aminopurine.
Supplementary Material
Figure S1: Deactivation pathway for the pyrrolocytosine monomer in vacuo. The geometries were obtained from calculations with ADC(2)/def2-TZVP. All energies are calculated at the NEVPT2/cc-pVDZ level.
Figure S2: Natural orbitals at the CIS/cc-pVDZ level for the lowest transitions of (a) 5′-GPC-3′, (b) 5′-GPCG-3′, (c) 5′-PCG-3′, (d) PCG-Hbonding. The occupation numbers for the two orbitals shown are 0.9-1, so there are no other relevant contributions besides the pairs shown. Natural orbital calculations were carried out using the GAMESS computational package.3
Figure S3: Excited states of G, PC, the dimers and the trimer formed between them calculated at the CIS(D)/cc-pVDZ level of theory.
Figure S4: CIS/cc-pVDZ natural orbitals (left) and difference of the dipole moment of the CT state minus the dipole moment of the ground state (Δμ) describing the first CT state in (a) 5′-PCG-3′: S0 - S4 transition, Δμ=19.68 Debye (b) 5′-GPC-3′: S0-S6 transition, Δμ=7.62 Debye (c) 5′-GPCG-3′, S0-S2 transition, Δμ=16.65 Debye. Occupation numbers are 0.9-1, except for 5′-GPC-3′ where the occupation numbers are 1.2 and 0.8.
Figure S5: Adiabatic (A) and Vertical (V) electron affinities of PC, 2AP, G monomers computed at the DFT/B3LYP level with different basis sets. Solvation effects were modeled using IEFPCM.
Figure S6: B3LYP/6-311++G (2df,p) singly occupied molecular orbitals of (a) G, (b) 2AP, (c) PC anions in gas phase and water environment.
Table S1: Energies of the states in eV along the S1 PES for gas phase PC at the NEVPT2/cc-pVDZ level
Table S2: Energies of the states in eV along the S1 PES for aqueous phase PC at the NEVPT2/cc-pVDZ level using the continuum solvation SMD model.
Table S3: Energies of the states in eV along the S1 PES for gas phase PC at the ADC(2)/def2-TZVP level
Table S4: Energies of the states in eV along the S1 PES for PC with two water molecules at the ADC2 def2-TZVP level
Table S5: Excitation energies at different levels of theory in eV with oscillator strengths in parenthesis for BDNA geometries of all systems, PC, G, PCG-Hbonding, 5′-PCG-3′,5′-GPC-3′,5′-GPCG-3′. The corresponding characters are also included. * corresponds to πσ* state.
Table S6: CIS(D)/aug-cc-pVDZ Singlet excited state energies for PC, G monomers and PCG-Hbonded complex. State characters are included.
Table S7: ADC(2)/def2-TZVP singlet excited state energies for PCG, GPC and PCG-Hbonded complex. State characters are included.
Table S8: ADC(2)/def2-TZVP singlet excited state energies for GPCG. State characters are included.
Table S9: Vertical (V) and adiabatic (A) electron affinities and ionization potentials for PC, 2AP, and G computed at different levels of theory. Dipole moments (D) in Debye for each system at different levels are also shown.
Table S10: S0 Minimum for PC optimized with MP2/6-31G(d,p).
Table S11: Conical intersection between S1 and S0 for PC monomer optimized with CASSCF/cc-pVDZ.
Table S12: Conical intersection between S1 and S0 for PC monomer optimized with ADC(2)/def2-TZVP.
Table S13: S1 minimum 1 for PC monomer optimized with ADC(2)/def2-TZVP.
Table S14: S1 minimum 2 for PC monomer optimized with ADC(2)/def2-TZVP.
Table S15: S1 second order saddle point for PC monomer optimized with ADC(2)/def2-TZVP.
Table S16: S0 minimum for PC monomer with two explicit waters optimized with MP2/6-31G(d,p).
Table S17: Conical intersection between S1 and S0 for PC monomer with two explicit waters optimized with ADC(2)/def2-TZVP.
Table S18: S1 minimum 1 for PC monomer with two explicit waters optimized with ADC(2)/def2-TZVP.
Table S19: S1 minimum 2 for PC monomer with two explicit waters optimized with ADC(2)/def2-TZVP.
Table S20: Hydrogen bonded dimer
Table S21: Cartesian coordinates of the trimer GPCG. The π-stacked dimers were extracted from this geometry by removing the extra guanine.
Acknowledgments
This material is based upon work supported by the National Science Foundation under CHE-1465138. QLN was supported by MARC Undergraduate Student Training in Research grant NIH 2T34 GM087239.
Footnotes
Electronic supplementary information (ESI) available: Additional details of calculations and cartesian coordinates. See DOI: 10.1039/c6cp01559j
References
- 1.Callis PR. Annu Rev Phys Chem. 1983;34:329. [Google Scholar]
- 2.Daniels M, Hauswirth W. Science. 1971;171:675. doi: 10.1126/science.171.3972.675. [DOI] [PubMed] [Google Scholar]
- 3.Daniels M. Photochemistry and Photobiology of Nucleic Acids. Vol. 1. Academic Press; New York: 1976. p. 23. [Google Scholar]
- 4.Crespo-Hernandez CE, Cohen B, Hare PM, Kohler B. Chem Rev. 2004;104:1977. doi: 10.1021/cr0206770. [DOI] [PubMed] [Google Scholar]
- 5.Barbatti M, Aquino AJA, Szymczak JJ, Nachtigallová D, Hobza P, Lischka H. Proc Natl Acad Sci U S A. 2010;107:21453–21458. doi: 10.1073/pnas.1014982107. [DOI] [PMC free article] [PubMed] [Google Scholar]
- 6.Middleton CT, de La Harpe K, Su C, Law YK, Crespo-Hernandez CE, Kohler B. Annu Rev Phys Chem. 2009;60:217. doi: 10.1146/annurev.physchem.59.032607.093719. [DOI] [PubMed] [Google Scholar]
- 7.Mutation, DNA Repair, and DNA Integrity.
- 8.Matsika S. Top Curr Chem. 2015;355:209–243. doi: 10.1007/128_2014_532. [DOI] [PubMed] [Google Scholar]
- 9.Wilhelmsson M. Q Rev Biophys. 2010;42:159–183. doi: 10.1017/S0033583510000090. [DOI] [PubMed] [Google Scholar]
- 10.Sobolewski AL, Domcke W. Europhys News. 2006;37:20–23. [Google Scholar]
- 11.Shapiro R. Origins Life Evol Biospheres. 1995;25:83–98. doi: 10.1007/BF01581575. [DOI] [PubMed] [Google Scholar]
- 12.Levy M, Miller SL. Proc Natl Acad Sci U S A. 1998;95:7933–7938. doi: 10.1073/pnas.95.14.7933. [DOI] [PMC free article] [PubMed] [Google Scholar]
- 13.Orgel LE. Crit Rev Biochem Mol Biol. 2004;39:99–123. doi: 10.1080/10409230490460765. [DOI] [PubMed] [Google Scholar]
- 14.Ehrenfreund P, Rasmussen S, Cleaves J, Chen LH. Astrobiology. 2006;6:490–520. doi: 10.1089/ast.2006.6.490. [DOI] [PubMed] [Google Scholar]
- 15.Limbach PA, Crain PF, McCloskey JA. Nucleic Acids Res. 1994;22:2183–2196. doi: 10.1093/nar/22.12.2183. [DOI] [PMC free article] [PubMed] [Google Scholar]
- 16.Cockell CS, Horneck G. Photochem Photobiol. 2001;73:447–451. doi: 10.1562/0031-8655(2001)073<0447:thotur>2.0.co;2. [DOI] [PubMed] [Google Scholar]
- 17.Liu C, Martin CT. J Mol Biol. 2001;308:465–475. doi: 10.1006/jmbi.2001.4601. [DOI] [PubMed] [Google Scholar]
- 18.Berry DA, Jung KY, Wise DS, Sercel AD. Tetrahedron Lett. 2004;45:2457–2461. [Google Scholar]
- 19.Mart AA, Jockusch S, Li Z, Ju J. Nucleic Acids Res. 2006;34:e50. doi: 10.1093/nar/gkl134. [DOI] [PMC free article] [PubMed] [Google Scholar]
- 20.Zhang X, Wadkins RM. Biophys J. 2009;96:1884–1891. doi: 10.1016/j.bpj.2008.12.3890. [DOI] [PMC free article] [PubMed] [Google Scholar]
- 21.Zang H, Fang Q, Pegg AE, Guengerich FP. J Biol Chem. 2005;280:30873. doi: 10.1074/jbc.M505283200. [DOI] [PubMed] [Google Scholar]
- 22.Kuznetsov NA, Vorobjev YN, Krasnoperov LN, Fedorova O. Nucleic Acids Res. 2012;40:7384–7392. doi: 10.1093/nar/gks423. [DOI] [PMC free article] [PubMed] [Google Scholar]
- 23.Taherpour S, Lönnberg T. RSC Adv. 2015;5:10837–10844. [Google Scholar]
- 24.Ismail N, Blancafort L, Olivucci M, Kohler B. J Am Chem Soc. 2002;124:6818. doi: 10.1021/ja0258273. [DOI] [PubMed] [Google Scholar]
- 25.Merchán M, González-Luque R, Climent T, Serrano-Andrés L, Rodrguez E, Reguero M, Peláez D. J Phys Chem B. 2006;110:26471–26476. doi: 10.1021/jp066874a. [DOI] [PubMed] [Google Scholar]
- 26.Blancafort L. Photochem Photobiol. 2007;83:603–610. doi: 10.1562/2006-05-29-RA-903. [DOI] [PubMed] [Google Scholar]
- 27.Kistler KA, Matsika S. J Phys Chem A. 2007;111:2650–2661. doi: 10.1021/jp0663661. [DOI] [PubMed] [Google Scholar]
- 28.Kistler KA, Matsika S. J Chem Phys. 2008;128:215102. doi: 10.1063/1.2932102. [DOI] [PubMed] [Google Scholar]
- 29.Hudock HR, Martnez TJ. ChemPhysChem. 2008;9:2486–2490. doi: 10.1002/cphc.200800649. [DOI] [PubMed] [Google Scholar]
- 30.Aquino AJA, Nachtigallova D, Hobza P, Truhlar DG. J Comput Chem. 2011;32:1217–1227. doi: 10.1002/jcc.21702. [DOI] [PubMed] [Google Scholar]
- 31.Giussani A, Segarra-Marti J, Roca-Sanjuan D, Merchan M. Top Curr Chem. 2015;355:57–97. doi: 10.1007/128_2013_501. [DOI] [PubMed] [Google Scholar]
- 32.Hardman SJO, Botchway SW, Thompson KC. Photochem Photobiol. 2008;84:1473–1479. doi: 10.1111/j.1751-1097.2008.00368.x. [DOI] [PubMed] [Google Scholar]
- 33.Tinsley RA, Walter NG. RNA. 2006;12:522–529. doi: 10.1261/rna.2165806. [DOI] [PMC free article] [PubMed] [Google Scholar]
- 34.Hardman SJO, Thompson KC. Biochemistry. 2006;45:9145. doi: 10.1021/bi060479t. [DOI] [PubMed] [Google Scholar]
- 35.Thompson KC, Miyake N. J Phys Chem B. 2005;109:6012–6019. doi: 10.1021/jp046177n. [DOI] [PubMed] [Google Scholar]
- 36.Jones AC, Neely RK. Q Rev Biophys. 2015;48:244–279. doi: 10.1017/S0033583514000158. [DOI] [PubMed] [Google Scholar]
- 37.Liang J, Matsika S. J Am Chem Soc. 2011;133:6799–6808. doi: 10.1021/ja2007998. [DOI] [PubMed] [Google Scholar]
- 38.Liang J, Matsika S. J Am Chem Soc. 2012;134:10713–10714. doi: 10.1021/ja303361z. [DOI] [PubMed] [Google Scholar]
- 39.Liang J, Nguyen QL, Matsika S. Photochem Photobiol Sci. 2013;12:1387–1400. doi: 10.1039/c3pp25449f. [DOI] [PMC free article] [PubMed] [Google Scholar]
- 40.Cheng DM, Sarma RH. J Am Chem Soc. 1977;99:7333–7348. doi: 10.1021/ja00464a038. [DOI] [PubMed] [Google Scholar]
- 41.Norberg J, Nilsson L. Biophys J. 1995;69:2277–2285. doi: 10.1016/S0006-3495(95)80098-6. [DOI] [PMC free article] [PubMed] [Google Scholar]
- 42.Dunning TH. J Chem Phys. 1989;90:1007. [Google Scholar]
- 43.Hättig C. Adv Quantum Chem. 2005;50:37–60. [Google Scholar]
- 44.Schaefer A, Horn H, Ahlrichs R. J Chem Phys. 1992;97:2571–2577. [Google Scholar]
- 45.Weigend F, Ahlrichs R. Phys Chem Chem Phys. 2005;7:3297–3305. doi: 10.1039/b508541a. [DOI] [PubMed] [Google Scholar]
- 46.Weigend F. Phys Chem Chem Phys. 2006;8:1057–1065. doi: 10.1039/b515623h. [DOI] [PubMed] [Google Scholar]
- 47.Schapiro I, Sivalingam K, Neese F. J Chem Theory Comput. 2013;9:3567–3580. doi: 10.1021/ct400136y. [DOI] [PubMed] [Google Scholar]
- 48.Tuna D, Lefrancois D, Wolański L, Gozem S, Schapiro I, Andruniów T, Dreuw A, Olivucci M. J Chem Theory Comput. 2015;11:5758–5781. doi: 10.1021/acs.jctc.5b00022. [DOI] [PubMed] [Google Scholar]
- 49.Marenich AV, Cramer CJ, Truhlar DG. J Phys Chem B. 2009;113:6378–6396. doi: 10.1021/jp810292n. [DOI] [PubMed] [Google Scholar]
- 50.Head-Gordon M, Oumi M, Maurice D. Mol Phys. 1999;96:593–602. [Google Scholar]
- 51.Chipman DM. J Chem Phys. 2000;112:5558. [Google Scholar]
- 52.TURBOMOLE V6.5, a development of University of Karlsruhe and Forschungszentrum Karlsruhe GmbH, 1989-2007, TURBOMOLE GmbH, since 2007. available from http://www.turbomole.com.
- 53.Sherwood P, de Vries AH, Guest MF, Schreckenback G, Catlow CRA, French SA, Sokol AA, Bromley ST, Thiel W, Turner AJ, Billeter S, Terstegen F, Thiel S, Kendrick J, Rogers SC, Casci J, Watson M, King F, Karlsen E, Sjovoll M, Fahmi A, Scha¨fer A, Lennartz C. THEOCHEM. 2003;632:1–28. [Google Scholar]
- 54.Frisch MJ, Trucks GW, Schlegel HB, Scuseria GE, Robb MA, Cheeseman JR, Montgomery JA, Jr, Vreven T, Kudin KN, Burant JC, Millam JM, Iyengar SS, Tomasi J, Barone V, Mennucci B, Cossi M, Scalmani G, Rega N, Petersson GA, Nakatsuji H, Hada M, Ehara M, Toyota K, Fukuda R, Hasegawa J, Ishida M, Nakajima T, Honda Y, Kitao O, Nakai H, Klene M, Li X, Knox JE, Hratchian HP, Cross JB, Bakken V, Adamo C, Jaramillo J, Gomperts R, Stratmann RE, Yazyev O, Austin AJ, Cammi R, Pomelli C, Ochterski JW, Ayala PY, Morokuma K, Voth GA, Salvador P, Dannenberg JJ, Zakrzewski VG, Dapprich S, Daniels AD, Strain MC, Farkas O, Malick DK, Rabuck AD, Raghavachari K, Foresman JB, Ortiz JV, Cui Q, Baboul AG, Clifford S, Cioslowski J, Stefanov BB, Liu G, Liashenko A, Piskorz P, Komaromi I, Martin RL, Fox DJ, Keith T, Al-Laham MA, Peng CY, Nanayakkara A, Challacombe M, Gill PMW, Johnson B, Chen W, Wong MW, Gonzalez C, Pople JA. Gaussian 03, Revision D.01. Gaussian, Inc.; Wallingford, CT: 2004. [Google Scholar]
- 55.Shao Y, Molnar LF, Jung Y, Kussmann J. Phys Chem Chem Phys. 2006;8:3172. doi: 10.1039/b517914a. [DOI] [PubMed] [Google Scholar]
- 56.Bode BM, Gordon MS. J Mol Graphics Modell. 1998;16:133–138. doi: 10.1016/s1093-3263(99)00002-9. [DOI] [PubMed] [Google Scholar]
- 57.Schmidt JR, Polik WF. WebMO Enterprise, version 13.0. WebMO LLC; Hollan, MI, USA: 2013. [Google Scholar]
- 58.Neese F. The ORCA program system. Wiley Interdiscip Rev: Comput Mol Sci. 2012;2:73–78. [Google Scholar]
- 59.Merchán M, Serrano-Andrés L. J Am Chem Soc. 2003;125:8108. doi: 10.1021/ja0351600. [DOI] [PubMed] [Google Scholar]
- 60.Shterev IG, Delchev VB. Monatsh Chem. 2012;143:763–770. [Google Scholar]
- 61.Lobsiger S, Blaser S, Sinha R, Frey HM, Leutwyler S. Nat Chem. 2014;6:989–993. doi: 10.1038/nchem.2086. [DOI] [PubMed] [Google Scholar]
- 62.Barbatti M, Lischka H. Phys Chem Chem Phys. 2015;17:15452–15459. doi: 10.1039/c5cp01151e. [DOI] [PubMed] [Google Scholar]
- 63.Dreuw A, Head-Gordon M. Chem Rev. 2005;105:4009–4037. doi: 10.1021/cr0505627. [DOI] [PubMed] [Google Scholar]
- 64.Wan C, Xia T, Becker HC, Zewail AH. Chem Phys Lett. 2005;412:158–163. [Google Scholar]
- 65.Subotnik JE. J Chem Phys. 2011;135:71104. doi: 10.1063/1.3627152. [DOI] [PubMed] [Google Scholar]
- 66.Spata VA, Lee W, Matsika S. J Phys Chem Lett. 2016;7:976–984. doi: 10.1021/acs.jpclett.5b02756. [DOI] [PubMed] [Google Scholar]
- 67.Crespo-Hernandez CE, Close DM, Gorb L, Leszczynski J. J Phys Chem B. 2007;111:5386. doi: 10.1021/jp0684224. [DOI] [PubMed] [Google Scholar]
- 68.Narayanan M, Kodali G, Xing Y, Stanley RJ. J Phys Chem B. 2010;114:10573–10580. doi: 10.1021/jp102355v. [DOI] [PubMed] [Google Scholar]
- 69.Roca-Sanjuán D, Rubio M, Merchán M, Serrano-Andrés L. J Chem Phys. 2006;125:84302. doi: 10.1063/1.2336217. [DOI] [PubMed] [Google Scholar]
Associated Data
This section collects any data citations, data availability statements, or supplementary materials included in this article.
Supplementary Materials
Figure S1: Deactivation pathway for the pyrrolocytosine monomer in vacuo. The geometries were obtained from calculations with ADC(2)/def2-TZVP. All energies are calculated at the NEVPT2/cc-pVDZ level.
Figure S2: Natural orbitals at the CIS/cc-pVDZ level for the lowest transitions of (a) 5′-GPC-3′, (b) 5′-GPCG-3′, (c) 5′-PCG-3′, (d) PCG-Hbonding. The occupation numbers for the two orbitals shown are 0.9-1, so there are no other relevant contributions besides the pairs shown. Natural orbital calculations were carried out using the GAMESS computational package.3
Figure S3: Excited states of G, PC, the dimers and the trimer formed between them calculated at the CIS(D)/cc-pVDZ level of theory.
Figure S4: CIS/cc-pVDZ natural orbitals (left) and difference of the dipole moment of the CT state minus the dipole moment of the ground state (Δμ) describing the first CT state in (a) 5′-PCG-3′: S0 - S4 transition, Δμ=19.68 Debye (b) 5′-GPC-3′: S0-S6 transition, Δμ=7.62 Debye (c) 5′-GPCG-3′, S0-S2 transition, Δμ=16.65 Debye. Occupation numbers are 0.9-1, except for 5′-GPC-3′ where the occupation numbers are 1.2 and 0.8.
Figure S5: Adiabatic (A) and Vertical (V) electron affinities of PC, 2AP, G monomers computed at the DFT/B3LYP level with different basis sets. Solvation effects were modeled using IEFPCM.
Figure S6: B3LYP/6-311++G (2df,p) singly occupied molecular orbitals of (a) G, (b) 2AP, (c) PC anions in gas phase and water environment.
Table S1: Energies of the states in eV along the S1 PES for gas phase PC at the NEVPT2/cc-pVDZ level
Table S2: Energies of the states in eV along the S1 PES for aqueous phase PC at the NEVPT2/cc-pVDZ level using the continuum solvation SMD model.
Table S3: Energies of the states in eV along the S1 PES for gas phase PC at the ADC(2)/def2-TZVP level
Table S4: Energies of the states in eV along the S1 PES for PC with two water molecules at the ADC2 def2-TZVP level
Table S5: Excitation energies at different levels of theory in eV with oscillator strengths in parenthesis for BDNA geometries of all systems, PC, G, PCG-Hbonding, 5′-PCG-3′,5′-GPC-3′,5′-GPCG-3′. The corresponding characters are also included. * corresponds to πσ* state.
Table S6: CIS(D)/aug-cc-pVDZ Singlet excited state energies for PC, G monomers and PCG-Hbonded complex. State characters are included.
Table S7: ADC(2)/def2-TZVP singlet excited state energies for PCG, GPC and PCG-Hbonded complex. State characters are included.
Table S8: ADC(2)/def2-TZVP singlet excited state energies for GPCG. State characters are included.
Table S9: Vertical (V) and adiabatic (A) electron affinities and ionization potentials for PC, 2AP, and G computed at different levels of theory. Dipole moments (D) in Debye for each system at different levels are also shown.
Table S10: S0 Minimum for PC optimized with MP2/6-31G(d,p).
Table S11: Conical intersection between S1 and S0 for PC monomer optimized with CASSCF/cc-pVDZ.
Table S12: Conical intersection between S1 and S0 for PC monomer optimized with ADC(2)/def2-TZVP.
Table S13: S1 minimum 1 for PC monomer optimized with ADC(2)/def2-TZVP.
Table S14: S1 minimum 2 for PC monomer optimized with ADC(2)/def2-TZVP.
Table S15: S1 second order saddle point for PC monomer optimized with ADC(2)/def2-TZVP.
Table S16: S0 minimum for PC monomer with two explicit waters optimized with MP2/6-31G(d,p).
Table S17: Conical intersection between S1 and S0 for PC monomer with two explicit waters optimized with ADC(2)/def2-TZVP.
Table S18: S1 minimum 1 for PC monomer with two explicit waters optimized with ADC(2)/def2-TZVP.
Table S19: S1 minimum 2 for PC monomer with two explicit waters optimized with ADC(2)/def2-TZVP.
Table S20: Hydrogen bonded dimer
Table S21: Cartesian coordinates of the trimer GPCG. The π-stacked dimers were extracted from this geometry by removing the extra guanine.