

Abstract
Cognitive slowing is a prevalent symptom observed in Gulf War Illness (GWI). The present study assessed the extent to which functional connectivity between dorsolateral prefrontal cortex (DLPFC) and other task-relevant brain regions was predictive of GWI-related cognitive slowing. GWI patients (n = 54) and healthy veteran controls (n = 29) were assessed on performance of a processing speed task (the Digit Symbol Substitution Task; DSST) while undergoing functional magnetic resonance imaging (fMRI). GWI patients were slower on the DSST relative to controls. Bilateral DLPFC connectivity with task-relevant nodes was altered in GWI patients compared to healthy controls during DSST performance. Moreover, hyperconnectivity in these networks predicted GWI-related increases in reaction time on the DSST, whereas hypoconnectivity did not. These results suggest that GWI-related cognitive slowing reflects reduced efficiency in cortical networks.
Keywords: functional magnetic resonance imaging, dorsolateral prefrontal cortex, Gulf War Illness, processing speed, functional connectivity, cognitive efficiency
Highlights
-
•
This study used functional magnetic resonance imaging to assess the relationship between cognitive slowing in Gulf War Illness (GWI) and networks connected to dorsolateral prefrontal cortex (DLPFC)
-
•
GWI patients performed more slowly on a processing speed task than healthy veteran controls
-
•
Increased functional connectivity with DLPFC predicted reductions in processing speed in GWI patients, where decreased functional connectivity did not
-
•
Results suggest that executive-network hyperconnectivity is associated with reduced network efficiency and cognitive slowing in GWI patients
1. Introduction
Approximately one-third of the 700,000 troops deployed to the 1991 Persian Gulf War developed chronic physical and psychological symptoms known as Gulf War Illness (GWI). To date, it is the most prevalent health condition affecting Gulf War veterans (Research Advisory Committee on Gulf War Veterans’ Illnesses, 2008). GWI is characterized by diverse symptomology, affecting digestive (e.g., abdominal pain, chronic diarrhea), integumentary (e.g., idiopathic skin rashes), respiratory (e.g., chronic cough, dyspnea) and nervous systems (e.g., chronic headaches, cognitive impairment, neuropathic pain). Few studies have assessed the neural correlates of the cognitive symptoms experienced by GWI sufferers (Odegard et al., 2013, Tillman et al., 2010, Tillman et al., 2012, Tillman et al., 2013). However, recent work suggests that cognitive deficits in GWI might arise from executive dysfunction caused by aberrant functioning of prefrontal neural systems (Hubbard et al., 2014).
Executive processes depend upon dorsolateral prefrontal cortex (DLPFC; e.g., Curtis and D'Esposito, 2003, D'Esposito et al., 1995, Goldman-Rakic et al., 1996, Hubbard et al., 2014, Hubbard et al., 2015, Rypma, 2006, Rypma et al., 1999, Rypma et al., 2002, Rypma and D'Esposito, 1999, Rypma and Prabhakaran, 2009). This area directs sensory and motor information and receives and integrates input from an array of specialized cortical structures (Curtis and D'Esposito, 2003, Goldman-Rakic et al., 1984, Goldman-Rakic et al., 1996, Hubbard et al., 2015, Niki et al., 1972, Petrides and Pandya, 1984, Petrides and Pandya, 1999, Rypma et al., 2006, Rypma and Prabhakaran, 2009). Indeed, blood-oxygen-level dependent (BOLD) activity changes in DLPFC are known to accompany executive cognitive deficits in GWI (Hubbard et al., 2014).
Prior research has established that connectivity between DLPFC and parietal regions, as well as other task-relevant regions, is predictive of individual differences in fundamental abilities (Jung and Haier, 2007), including cognitive slowing in healthy (Biswal et al., 2010, Rypma et al., 2006, Rypma and Prabhakaran, 2009) and clinical populations (Hubbard et al., 2016). One study, for instance, found that slower performers showed increased DLPFC connectivity, and that significant variance in performance on the DSST could be explained by the degree of DLPFC connectivity (Rypma et al., 2006). These results suggested that slower performers required greater DLPFC connectivity for executive control and monitoring processes. However, it remains unknown whether functional connectivity changes in DLPFC exist in GWI, and whether such changes might predict cognitive slowing in GWI.
In the present study, we assessed cognitive slowing and functional connectivity in GWI. Specifically, we used functional magnetic resonance imaging (fMRI) to assess the extent to which connectivity with DLPFC was altered during processing speed task performance in GWI relative to healthy-control veterans. We further assessed whether GWI-related changes in DLPFC functional connectivity could predict cognitive slowing in these patients.
2. Materials and Methods
2.1. Participants
Ninety-seven participants were selected by a three-stage sampling procedure from a nationally representative sample of Gulf War-era US military veterans, stratified by age, education, gender and wartime military rank (Haley et al., 2013). Sixty-six veterans (GWI patients) met the standardized factor case definition of the disease (Haley et al., 1997b; Iannacchione et al., 2011), approximately equally representing the three syndrome variants defined by factor analysis: variant 1, impaired cognition; variant 2, confusion-ataxia; and variant 3, central neuropathic pain. All three variants were included to capture the full spectrum of the disorder (Haley et al., 1997, Iannacchione et al., 2011). All of the cases met the more inclusive CDC case definition (Fukuda et al., 1998), all but 2 met the Kansas case definition without comorbidity exclusions, and approximately half met the original Kansas case definition with comorbidities excluded (Steele, 2000). Thirty-one veterans (healthy controls) met none of the three case definitions. Complete task-performance and functional imaging data were available for 54 GWI patients and 29 healthy controls (N = 83); their characteristics are given in Table 1. No participants had a diagnosable neurological condition, such as motor neuron disease, cerebrovascular disease, Parkinson’s disease, Guillain-Barré syndrome, or traumatic brain injury.
Table 1.
Characteristics of the participants included in the analysis.
| Characteristic | Controlsa (N = 29) | GWI casesa (N = 54) |
|---|---|---|
| Age, mean (SD) | 50.4 (7.8) | 50.0 (8.0) |
| Sex | ||
| Male | 23 (79) | 43 (80) |
| Female | 6 (21) | 11 (20) |
| Handedness | ||
| Right | 28 (97) | 51 (94) |
| Left | 1 ( 3) | 3 ( 6) |
| Education survey response, mean (SD) | 5.4 (1.6) | 5.2 (1.8) |
| Deployment to Kuwaiti Theater of Operations | ||
| Deployed | 15 (52) | 55 (100) |
| Non-deployed | 14 (48) | 0 ( 0) |
| Wartime rank | ||
| Officer | 4 (14) | 4 ( 7) |
| Enlisted | 25 (86) | 50 (93) |
| Syndrome variants of the Factor Case Definition | ||
| Variant 1 (cognitive impairment) | -- | 18 (33) |
| Variant 2 (confusion/ataxia) | -- | 22 (40) |
| Variant 3 (neuropathic pain) | -- | 15 (27) |
| Met CDC criteria for multisymptom illness | ||
| Yes | 0 ( 0) | 54 (100) |
| No | 29 (100) | 0 ( 0) |
| Met Kansas criteria for multisymptom illness | ||
| Yes | 0 ( 0) | 30 (56) |
| No | 29 (100) | 24 (44) |
| Met Kansas criteria with no co-morbidity exclusions | ||
| Yes | 0 ( 0) | 52 (96) |
| No | 29 (100) | 2 ( 4) |
GWI patients met the Factor Case Definition of Gulf War illness, and controls did not meet it. Cells contain N (column %) unless otherwise specified in the row heading.
All procedures were approved by institutional review boards from both the University of Texas at Dallas and the University of Texas Southwestern Medical Center. Participants provided informed consent prior to undergoing any procedure. All procedures were monitored by trained, certified MR technicians who screened participants for contraindications to MR imaging. Upon completion, all participants were compensated monetarily for their participation.
2.2. Behavioral measurement
Participants completed three runs of an fMRI-adapted digit-symbol substitution task (DSST; Rypma et al., 2006). Each run lasted approximately 5 minutes and consisted of 75 trials. For each trial, a key containing 9 digit–symbol pairs was displayed in the upper half of the viewing screen. In the lower half, a single digit–symbol probe appeared simultaneously (Fig. 1). Participants were instructed to, as quickly and accurately as possible, press a right-thumb button if the probe-pair matched a pair in the key, and to press a left-thumb button if the probe-pair did not match one in the key. The probe-pair matched a pair in the key 50% of the time. Digit-symbol pairings in the key changed from trial to trial. Accuracy was calculated as the proportion of correct responses. Reaction time (RT) was calculated as the average time in ms it took a participant to respond correctly to a trial and was used to assess cognitive slowing.
Fig. 1.

A sample stimulus array from a single trial of the DSST.
2.3. Image acquisition and preprocessing
Imaging data were acquired using a Siemens 3 Tesla magnet with a 12-channel head coil. High-resolution anatomical, magnetization-prepared rapid acquisition of gradient echo (MPRAGE; Brant-Zawadzki et al., 1992) scans were acquired using the following parameters: T1-weighted type, 1 × 1 × 1 mm³ voxel, 160 slices/ volume, sagittal plane, 3.31 ms echo time, 12° flip angle, 256 × 256 matrix, left-to-right acquisition, 281 s scan duration. Functional scans during the DSST were acquired using the following parameters: BOLD, gradient-echo signal, 2.97 × 2.97 × 3.5 mm³ voxel, 44 slices/volume, 159 volumes/run, transverse plane, 20 ms echo time, 2000 ms repetition time, 90° flip angle, 64 × 64 matrix, foot-to-head acquisition, 318 s per scan.
Analysis of Functional Neuroimages (AFNI; Cox, 1996) was used to process functional neuroimaging data. Data were de-spiked using AFNI’s 3dDespike program that applies a scaling factor to values larger than 2.5 standard deviations above the mean (spikes) such that they then fall between 2.5 and 4 standard deviations above the mean. This scaling was done to reduce undue effects of outlier signal measurements (Jo et al., 2013). Head motion was corrected by registering functional volumes to the first volume of the first run of the functional task using a six-parameter rigid-body transformation. The MPRAGE volume was aligned to the functional data. The MPRAGE was then transformed to Colin space (Holmes et al., 1998, Van Essen, 2002), where the transformation matrix was applied to warp the functional data into Colin space. Functional volumes within grey matter were then smoothed using a Gaussian kernel (full width at half maximum; FWHM = 3 mm). Signal contributions from white matter and participant motion were labeled as nuisance covariates and removed from further processing using regression analysis (Jo et al., 2013). A high-pass filter (0.015625 Hz) was applied to the data and linear and quadratic trends were removed. Volumes for each participant were visually inspected to ensure pre-processing programs operated as intended. Anatomical ROI masks were algorithmically delineated via AFNI’s Talairach daemon (Cox, 1996) for each participant using Brodmann Area (BA) definitions for grey matter in left and right superior DLPFC corresponding to BA 9 (see Hutchison et al., 2014).
2.4. Image Analyses
2.4.1. DLPFC ΔBOLD
Previous research has shown attenuated BOLD activity in DLPFC for GWI patients compared to healthy controls (Hubbard et al., 2014). The magnitude of linear dependence, as assessed using Pearson correlations, is contingent upon variability (e.g., Alexander et al., 1984). Thus, when comparing two groups on measures of linear dependence, increases in BOLD time-series variability for one group compared to another could bias group differences in connectivity (Hubbard et al., 2016). Thus, prior to assessing group differences in connectivity within DLPFC, we ensured that GWI patients and healthy controls did not significantly differ in DLPFC variability. We thus computed ΔBOLD, that is, the standardized fluctuation of BOLD signal from the mean, within left and right DLPFC for GWI patients compared to healthy controls.
2.4.2. DLPFC connectivity
Using left and right BA 9 as seed regions, we performed voxelwise Pearson product-moment correlations between average BOLD signal time-series data in the seed regions and data in all other grey matter voxels. These correlations indicated how similarly time-series data in the seed region and in any other voxel in the brain varied together through time. Voxels with higher correlation coefficients are considered to be more connected than those with lower coefficients (Biswal et al., 1995, Biswal et al., 2010, Friston, 2011, Hubbard et al., 2015). To normalize data distributions, a Fisher z-transformation (Fisher, 1915) was applied to each Pearson correlation, yielding a z-connectivity score with left and right DLPFC, per voxel. Between-group connectivity differences were assessed using independent samples t-tests. Cluster-extent-based thresholding was used to correct for familywise error rate (FWER < .05). The AFNI program 3dClustSim estimated the probability of finding a noise-only cluster featuring faces-touching, contiguous voxels (k), on our specified grid space, with a smoothing kernel of 3 mm, and a p-value of .05 for each voxel within a cluster. At k ≥ 17, the probability of a noise-only cluster was p < .05.
2.4.3. Definition of DLPFC hyper- and hypoconnectivity
We hypothesized that GWI-related hyperconnectivity with DLPFC was related to group differences in cognitive slowing. To test this hypothesis, from each participant we extracted the average connectivity z-score from all voxels in regions where GWI patients were significantly more connected with left and right DLPFC than healthy controls. We also extracted the average connectivity z-score in regions where GWI patients were significantly less connected with left and right DLPFC than healthy controls. This approach yielded two summary z-scores for each participant. One z-score represented the average connectivity with left and right DLPFC in regions where GWI patients showed significantly increased connectivity compared to healthy controls (i.e., the hyperconnectivity coefficient). The other z-score represented the average connectivity with left and right DLPFC in regions where GWI patients showed significantly reduced connectivity compared to healthy controls (i.e., the hypoconnectivity coefficient). We then assessed whether hyper- and hypoconnectivity coefficients could predict DSST RT.
2.5. Statistical Analysis
All within-group distributions were examined for outliers. Any observation greater than two standard deviations above or below the mean was removed from that distribution, as reflected by the degrees of freedom in any statistical analysis we performed. Additionally, we used multivariate ordinary least squares regression models in accordance with Baron and Kenny’s protocol (Baron and Kenny, 1986). Briefly, this method has four criteria for identifying an intervening variable (Fig. 2). First, the effect of X on Y (i.e., the direct effect) must be significant (path α in Fig. 2). Second, the effect of X on M must be significant (path β in Fig. 2). Third, the effect of M on Y (path τ in Fig. 2) controlling for X must be significant (path α' in Fig. 2). Fourth, the effect of X on Y controlling for M must be non-significant or less than the effect of path α.
Fig. 2.
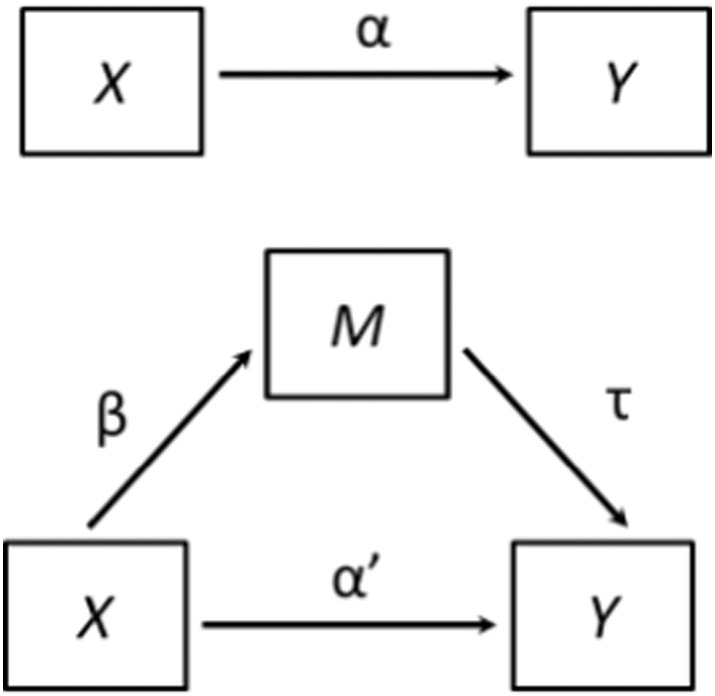
Baron & Kenny’s protocol to identify an intervening variable. X is the independent variable, Y is the dependent variable, M is the intervening variable, α is the effect of X on Y, β is the effect of X on M, τ is the effect of M on Y, and α' is the effect of X on Y controlling for M.
3. Results
3.1. DSST Performance
GWI patients and healthy controls did not significantly differ in DSST accuracy (MGWI = 95.73 % [SEM = 0.41 %] vs. Mhealthy = 97.03 % [.56 %]; t[79] = -1.87, p = .066). Because accuracy on the DSST was high (> 95%) and did not differ between groups, all trials were used in neuroimaging analyses. GWI patients (MGWI = 2223.60 ms [44.11]) were significantly slower to respond in the DSST compared to healthy controls (Mhealthy = 1981.39 ms [61.26]; t[80] = 3.21, p = .002).
3.2. DLPFC ΔBOLD
GWI patients (MGWI = 2.51 [.06]) did not significantly differ from healthy controls (Mhealthy = 2.53 [.08]) in left DLPFC ΔBOLD (t[77] = -.186, p = .853). Similarly, no significant group differences were found between GWI patients (MGWI = 2.48 [.05]) and healthy controls (Mhealthy = 2.47 [.07]) in right DLPFC ΔBOLD (t[78] = .115, p = .909). Fig. 3 depicts maps of BOLD signal during task across the entire brain for patients and controls.
Fig. 3.
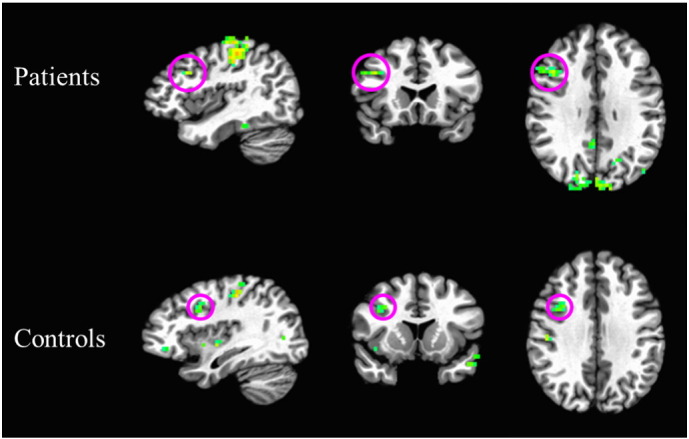
Group-average activation maps depicting BOLD signal during task (as measured across all trials) for patients (above) and controls (below). Maps depict the top 10% of voxels for the whole brain, with a cluster threshold of k = 10. Circled in magenta are clusters located in DLPFC.
3.3. DLPFC connectivity
Results of the connectivity analysis showed that GWI patients had both hyper- and hypoconnectivity with left and right DLPFC during DSST performance compared to healthy controls (Table 2; Fig. 4).
Table 2.
Anatomical regions showing hyper- or hypoconnectivity with left or right BA 9.
| Anatomical Region (BA) | x | y | z | Voxel count | t-value |
|---|---|---|---|---|---|
| Left BA 9 | |||||
| Right Declive | - 24 | - 69 | - 20 | 77 | -3.101 |
| Right Medial Frontal Gyrus (10) | - 03 | - 45 | - 09 | 52 | 3.692 |
| Right Culmen | - 21 | + 48 | - 20 | 47 | -3.716 |
| Right Cerebellar Tonsil | - 15 | + 51 | - 41 | 39 | -3.150 |
| Right Tuber | - 30 | + 77 | - 27 | 35 | -3.853 |
| Right Cerebellar Tonsil | - 45 | + 51 | - 34 | 34 | -2.841 |
| Left Insula (13) | + 39 | + 30 | + 19 | 32 | 3.327 |
| Left Parahippocampal Gyrus (27) | + 15 | + 33 | - 02 | 32 | -4.505 |
| Left Inferior Parietal Lobule (40) | + 57 | + 42 | + 29 | 31 | 3.300 |
| Right Culmen | - 09 | + 48 | - 16 | 31 | -3.474 |
| Left Tuber | + 36 | + 80 | - 30 | 29 | -3.471 |
| Right Inferior Semi-Lunar Lobule | - 33 | + 66 | - 37 | 27 | -3.291 |
| Right Inferior Frontal Gyrus (47) | - 30 | - 30 | - 06 | 23 | 3.125 |
| Left Superior Temporal Gyrus (38) | + 36 | + 06 | - 16 | 19 | 4.190 |
| Right Fusiform Gyrus (37) | - 45 | + 45 | - 13 | 18 | -4.273 |
| Right Middle Temporal Gyrus (21) | - 57 | + 06 | - 06 | 17 | 2.755 |
| Left Insula (47) | + 33 | - 12 | + 01 | 17 | 3.595 |
| Right BA 9 | |||||
| Left Parahippocampal Gyrus (30) | + 15 | + 36 | - 02 | 384 | -4.621 |
| Right Cerebellar Tonsil | - 09 | + 39 | - 44 | 224 | -3.748 |
| Left Pyramis | + 09 | + 80 | - 27 | 221 | -4.230 |
| Right Superior Temporal Gyrus (42) | - 65 | + 18 | + 08 | 53 | 4.003 |
| Right Tuber | - 30 | + 77 | - 27 | 44 | -3.152 |
| Right Middle Frontal Gyrus (9) | - 42 | - 30 | + 33 | 39 | 3.965 |
| Left Fusiform Gyrus (37) | + 36 | + 63 | - 09 | 36 | -3.426 |
| Right Postcentral Gyrus (3) | - 51 | + 15 | + 40 | 34 | 3.037 |
| Right Superior Temporal Gyrus (22) | - 57 | - 12 | - 06 | 30 | 3.713 |
| Left Inferior Semi-Lunar Lobule | + 21 | + 63 | - 44 | 30 | -3.174 |
| Right Inferior Frontal Gyrus (13) | - 36 | - 21 | + 08 | 28 | 3.484 |
| Left Medial Frontal Gyrus (10) | + 00 | - 50 | - 09 | 26 | 3.645 |
| Right Middle Frontal Gyrus (6) | - 30 | - 06 | + 54 | 23 | 2.626 |
| Left Inferior Frontal Gyrus (13) | + 33 | - 09 | - 16 | 22 | 3.590 |
| Right Middle Frontal Gyrus (45) | - 45 | - 24 | + 22 | 22 | 3.124 |
| Left Precentral Gyrus (3) | + 27 | + 21 | + 50 | 22 | 3.125 |
| Left Cerebellar Tonsil | + 12 | + 51 | - 37 | 22 | -3.753 |
| Right Fusiform Gyrus (37) | - 48 | + 45 | - 13 | 21 | -3.629 |
| Left Middle Temporal Gyrus (39) | + 48 | + 51 | + 05 | 21 | -2.866 |
| Right Middle Frontal Gyrus (46) | - 54 | - 30 | + 19 | 19 | 2.669 |
| Left Middle Temporal Gyrus (37) | + 48 | + 57 | - 09 | 19 | -3.537 |
| Left Declive (19) | + 21 | + 60 | - 13 | 18 | -2.685 |
| Right Inferior Parietal Lobule (40) | - 45 | + 36 | + 50 | 17 | 3.208 |
x, y and z are the Talaraich coordinates of the peak voxel in each cluster. T-values are independent-samples t-score of the peak voxel of each cluster. Significance was assessed at
p = .01, k ≥ 6, familywise error rate < .05. Positive t-values indicate hyperconnectivity, and negative t-values indicate hypoconnectivity.
Anatomical regions are the Brodmann areas nearest the peak voxel (with 5 mm).
Fig. 4.

Differences in connectivity on between veterans with Gulf War illness (N = 54) and matched controls (N = 29) on the DSST while undergoing fMRI. Results of seed-based connectivity analyses, using left and right BA 9 as seed regions. Voxels depict group differences in connectivity with the seed region in GWI patients relative to controls during DSST performance. Voxels appearing yellow and orange indicate hyperconnectivity; voxels appearing cyan and blue indicate hypoconnectivity.
3.4. Relationship between DLPFC connectivity and DSST RT
DLPFC hyperconnectivity coefficients significantly predicted DSST RT (β = 2143.02, r = .296, t[77] = 2.72, p = .008). DLPFC hypoconnectivity coefficients did not significantly predict DSST RT (β = -1022.02, r = -.155, t[78] = -1.39, p = .169). Finding that (1) GWI patients had significantly longer RT than healthy controls, (2) GWI patients had significantly greater DLPFC hyperconnectivity than controls, and (3) the DLPFC hyperconnectivity coefficient significantly predicted DSST RT, we sought to test whether the relationship between the DLPFC hyperconnectivity coefficient and group differences in DSST RT suggested the presence of an intervening variable between the group variable and DSST RT (e.g., Baron and Kenny, 1986). To test this, we utilized multiple regression predicting DSST RT from patients’ group status and the hyperconnectivity coefficient. The overall model was significant (F[2, 76] = 5.73, p = .005, R² adj = .13). Examination of the individual factors showed that when controlling for DLPFC hyperconnectivity, patients’ group status was no longer a significant predictor of DSST RT (β = -95.08, t[76] = -1.94, p = .056).
3.5. Parietal Connectivity and DSST RT
The finding that DLPFC hyperconnectivity was a significant intervening variable in the group-performance relationship suggests a central role for DLPFC in GWI-related cognitive slowing. Because activation-performance relationships have been observed in parietal cortex in previous work (e.g., Rypma et al., 2006, Rypma and Prabhakaran, 2009), we performed similar analyses using left and right BA 7 (corresponding to superior parietal lobule and precuneus) as seed regions to assess the specificity of the DLPFC results. We performed the same steps as above for DLPFC (cluster thresholding was identical to DLPFC). The only difference between our parietal cortex connectivity analyses and those we performed for DLPFC was that in the parietal analyses, we excluded voxels within DLPFC because DLPFC-parietal connectivity had already been determined in the DLPFC seed analysis.
Consistent with DLPFC analyses, GWI patients had both hyper- and hypoconnectivity with left and right BA 7 during DSST performance compared to healthy controls (Fig. 4; see also Supplementary Material). Inconsistent with DLPFC analyses, neither BA 7 hyperconnectivity coefficients (β = 272.43, r = .03, t[78] = .27, p = .786), nor hypoconnectivity coefficients (β = 267.75, r = .04, t[79] = .38, p = .707), significantly predicted DSST RT. Due to the absence of this relationship, there was no need to test whether parietal connectivity was an intervening variable in the relationship between group and DSST RT (Baron and Kenny, 1986).
4. Discussion
In this study, we compared processing speed and functional connectivity during DSST performance for GWI patients and healthy veteran controls. We assessed whether GWI-related changes in DLPFC functional connectivity were related to GWI patients’ reductions in processing speed compared to controls. There were three principle results. First, RT of GWI patients during DSST performance was slower than that of controls, while accuracy did not differ between groups. Second, GWI patients showed both hyper- and hypoconnectivity between DLPFC and other regions throughout the brain compared to controls. Third, hyperconnectivity with DLPFC in these other regions predicted group differences in DSST RT. Hypoconnectivity was not predictive of these RT group differences. No such results were observed for connectivity with parietal cortex. Our results suggest that cognitive slowing in GWI results from inefficient connectivity within executive networks.
One possible explanation for these findings is a pathologically altered central cholinergic system. Epidemiologic studies have linked GWI to environmental exposure to chemicals that inhibit acetylcholinesterase (AChE), including organophosphate pesticides, pyridostigmine bromide, and sarin nerve gas (Chao et al., 2010, Chao et al., 2014, Golomb, 2008, Haley and Kurt, 1997, Haley et al., 2009, Haley et al., 2013, Haley and Tuite, 2013, Heaton et al., 2007, Henderson et al., 2002, Li et al., 2011, Tuite and Haley, 2013). AChE is an enzyme necessary for degradation of the neurotransmitter acetylcholine. When AChE is inactivated, the resulting buildup of excess acetylcholine causes sustained excess stimulation, preventing neurons from returning to resting equilibrium and leading to excitotoxic damage. Other populations with documented poisoning by sarin nerve gas (Yokoyama et al., 1998) or organophosphate pesticides (Ecobichon, 1994) have chronic symptoms and neuropsychological abnormalities similar to those reported in GWI.
Executive cognitive function depends on the central cholinergic system, which modulates both processing speed and functional connectivity (Baddeley et al., 1986, Baddeley et al., 1991, Bartus, 2000, Hasselmo and Sarter, 2011, Ragozzino et al., 2012, Ricciardi et al., 2013, Rusted, 1988, Rusted and Warburton, 1988; see Hubbard et al., 2014). Further, it is known that alterations to the cholinergic system can lead to changes in both functional connectivity and cognitive functioning (Ricciardi et al., 2013). Ricciardi et al. (2013), for instance, assessed the effects of acute cholinergic augmentation on behavioral performance and functional connectivity. Participants performed a selective attention task during fMRI scanning immediately following administration of intravenous physostigmine (an acetylcholine enhancer) or saline placebo. Results showed that participants who received physostigmine were faster (i.e., showed decreased RT) than those who received a placebo, and showed reduced connectivity in prefrontal regions during the task relative to the placebo group. These results suggest that enhancement of the cholinergic system increases the efficiency of cognitive and neural processes. Recent studies have identified increased functional connectivity in early-moderate Alzheimer’s disease (Jiang et al., 2016, Kurth et al., 2015, Serra et al., 2016, Sui et al., 2015), also characterized by central cholinergic function loss (Mufson et al., 2008) and slowed DSST RT (Lafont et al., 2010, Rapp and Reischies, 2005). Similarly, GWI patients are known to have abnormal cholinergic function (Haley et al., 2009, Haley et al., 2013, Li et al., 2011) that could affect those DLPFC functions that control executive processes necessary for problem solving, reasoning, planning, and working memory (e.g., Braver, 2012, Chao et al., 2014, Fuster, 1995, Hubbard et al., 2014, Hubbard et al., 2015, Prabhakaran et al., 2001, Prabhakaran et al., 2011, Rypma and Prabhakaran, 2009, Shokri-Kojori et al., 2012).
An important question concerns the role that hyperconnectivity plays in GWI-related cognitive slowing. Under the assumption that damage to the central cholinergic system reduces neural signaling strength, possibly due to reduced ACh release at synapses (Golomb, 1999, Golomb, 2008) or mitochondrial-related energetic impairments (Koslik et al., 2014, Kannurpatti et al., 2015, White et al., 2016), additional neural cell assemblies might be recruited to maintain function. In the present results, these additional neural cell assemblies might be manifested as hyperconnectivity with DLPFC. Such added circuitry would be expected to slow RT (e.g., Rypma et al., 2006, Rypma and Prabhakaran, 2009) as we observed here.
An alternative explanation might follow compensation-based models wherein recruitment of additional cognitive resources serves to minimize age- and disease-related performance deficits (Cabeza, 2002, Park and Reuter-Lorenz, 2009, Reuter-Lorenz and Cappell, 2008). Such compensation mechanisms are hypothesized to optimize performance through broader recruitment of available neural and cognitive resources. However, compensation-based models would have predicted greater connectivity associated with faster DSST performance, which we did not observe. Additional research is needed to understand relationships between BOLD signal, functional connectivity, and performance, particularly if they are to inform development of GWI treatment strategies.
Efficiency explanations conceptualize brain and behavior changes in terms of departures from ideal system function. Models of cognitive efficiency (e.g., Cerella, 1991, Hutchison et al., 2013a, Hutchison et al., 2013b, Neubauer and Fink, 2009, Salthouse, 1996, Verhaeghen et al., 2002, Vernon, 1983) have suggested that optimal performance results from simultaneously maximizing the speed of cognitive processes and minimizing expenditure of cognitive resources. In this view, cognitive performance depends upon information transmission across a network of processing nodes wherein information relay across fewer nodes allows more direct processing paths and thus faster information processing. Inefficiency results from increases in the number of connections required to traverse nodes and leads to increases in neural activity and slowing of information processing (cf. Hebb, 1949, McClelland et al., 1986, Rypma and D'Esposito, 1999).
5. Conclusion
This study was the first to assess functional connectivity and processing speed in GWI patients. The slowing of reaction time and hyperconnectivity with DLPFC we observed in GWI patients suggest that their cognitive slowing is due to reductions in neural efficiency. Because DLPFC is central to executive cognitive functions, cognitive impairment experienced by GWI sufferers may be due to alterations to DLPFC connectivity evoked by ACh deficits. These findings thus support the conclusion that one of the most troublesome symptoms of GWI, cognitive slowing, is due to abnormal DLPFC functioning. That the study was performed in a sample of cases and controls drawn from a representative sample of Gulf War-era veterans strengthens the importance of this finding to the broader Gulf War veteran population. More generally, this finding establishes that GWI-related cognitive slowing is due to a pathological process, representing objective brain impairment.
The following is the supplementary data related to this article.
Anatomical regions showing hyper- or hypoconnectivity with BA 7.
Authors’ contributions
Monroe P. Turner: Manuscript drafting, data analysis, interpretation of results.
Nicholas A. Hubbard: Manuscript drafting, data analysis, interpretation of results.
Lyndahl M. Himes: Manuscript drafting, data analysis.
Shawheen Faghihahmadabadi: Manuscript drafting.
Joanna L. Hutchison: Manuscript drafting, data collection, data analysis, interpretation of results.
Ilana J. Bennett: Manuscript drafting, data collection, data analysis.
Michael A. Motes: Manuscript drafting, data collection, data analysis.
Robert W. Haley: Manuscript drafting, experimental design, interpretation of results.
Bart Rypma: Manuscript drafting, experimental design, data analysis, interpretation of results.
Conflicts of Interest
Authors report no conflicts of interest.
Acknowledgements and Funding
This research was supported in part by IDIQ contract VA549-P-0027 (to R. W. Haley), awarded by the Department of Veterans Affairs Medical Center, Dallas, TX; the National Institutes of Health (Grant 1R01AG029523 to B. Rypma), and the Friends of Brain Health (to N. A. Hubbard); U.S. Army Medical Research and Materiel Command grant number DAMD17-01-1-0741 (to R. W. Haley); and Grant Number UL1RR024982-05, titled North and Central Texas Clinical and Translational Science Initiative, from the National Center for Research Resources (NCRR), a component of the National Institutes of Health (NIH) and NIH Roadmap for Medical Research. The content does not necessarily reflect the position or the policy of the Federal government or the sponsoring agencies, and no official endorsement should be inferred.
References
- Alexander R.A., Alliger G.M., Hanges P.J. Correcting for range restriction when the population variance is unknown. Appl. Psychol. Meas. 1984;8(4):431–437. [Google Scholar]
- Baddeley A.D., Bressi S., Della Sala S., Logie R., Spinnler H. The decline of working memory in Alzheimer's disease. A longitudinal study. Brain J. Neurol. 1991;114(Pt 6):2521–2542. doi: 10.1093/brain/114.6.2521. [DOI] [PubMed] [Google Scholar]
- Baddeley A., Logie R., Bressi S., Sala S.D. Dementia and working memory. Q. J. Exp. Psychol. A Hum. Exp. Psychol. 1986;38(4-A):603–618. doi: 10.1080/14640748608401616. [DOI] [PubMed] [Google Scholar]
- Baron R.M., Kenny D.A. The moderator–mediator variable distinction in social psychological research: Conceptual, strategic, and statistical considerations. J. Pers. Soc. Psychol. 1986;51(6):1173. doi: 10.1037//0022-3514.51.6.1173. [DOI] [PubMed] [Google Scholar]
- Bartus R.T. On neurodegenerative diseases, models, and treatment strategies: lessons learned and lessons forgotten a generation following the cholinergic hypothesis. Exp. Neurol. 2000;163(2):495–529. doi: 10.1006/exnr.2000.7397. [DOI] [PubMed] [Google Scholar]
- Biswal B.B., Eldreth D.A., Motes M.A., Rypma B. Task-dependent individual differences in prefrontal connectivity. Cereb. Cortex. 2010;20(9):2188–2197. doi: 10.1093/cercor/bhp284. [DOI] [PMC free article] [PubMed] [Google Scholar]
- Biswal B., Zerrin Yetkin F., Haughton V.M., Hyde J.S. Functional connectivity in the motor cortex of resting human brain using echo-planar mri. Magn. Reson. Med. 1995;34(4):537–541. doi: 10.1002/mrm.1910340409. [DOI] [PubMed] [Google Scholar]
- Brant-Zawadzki M., Gillan G.D., Nitz W.R. MP RAGE: a three-dimensional, T1-weighted, gradient-echo sequence--initial experience in the brain. Radiology. 1992;182(3):769–775. doi: 10.1148/radiology.182.3.1535892. [DOI] [PubMed] [Google Scholar]
- Braver T.S. The variable nature of cognitive control: A dual mechanisms framework. Trends Cogn. Sci. 2012;16(2):106–113. doi: 10.1016/j.tics.2011.12.010. [DOI] [PMC free article] [PubMed] [Google Scholar]
- Cabeza R. Hemispheric asymmetry reduction in older adults: the HAROLD model. Psychol. Aging. 2002;17(1):85. doi: 10.1037//0882-7974.17.1.85. [DOI] [PubMed] [Google Scholar]
- Cerella J. Age effects may be global, not local: Comment on Fisk and Rogers (1991) J. Exp. Psychol. Gen. 1991;2:215–223. doi: 10.1037/0096-3445.120.2.215. [DOI] [PubMed] [Google Scholar]
- Chao L.L., Kriger S., Buckley S., Ng P., Mueller S.G. Effects of low-level sarin and cyclosarin exposure on hippocampal subfields in Gulf War Veterans. Neurotoxicology. 2014:44263–44269. doi: 10.1016/j.neuro.2014.07.003. [DOI] [PMC free article] [PubMed] [Google Scholar]
- Chao L.L., Rothlind J.C., Cardenas V.A., Meyerhoff D.J., Weiner M.W. Effects of low-level exposure to sarin and cyclosarin during the 1991 Gulf War on brain function and brain structure in US veterans. Neurotoxicology. 2010;31(5):493–501. doi: 10.1016/j.neuro.2010.05.006. [DOI] [PMC free article] [PubMed] [Google Scholar]
- Cox R.W. AFNI: software for analysis and visualization of functional magnetic resonance neuroimages. Comput. Biomed. Res. 1996;29(3):162–173. doi: 10.1006/cbmr.1996.0014. [DOI] [PubMed] [Google Scholar]
- Curtis C.E., D'Esposito M. Persistent activity in the prefrontal cortex during working memory. Trends Cogn. Sci. 2003;7(9):415–423. doi: 10.1016/s1364-6613(03)00197-9. [DOI] [PubMed] [Google Scholar]
- D'Esposito M., Detre J.A., Alsop D.C., Shin R.K., Atlas S., Grossman M. The neural basis of the central executive system of working memory. Nature. 1995;378(6554):279–281. doi: 10.1038/378279a0. [DOI] [PubMed] [Google Scholar]
- Ecobichon D.J. Organophosphorus ester insecticides. In: Ecobichon D.J., Joy R.M., editors. Pesticides and neurological diseases. 2nd ed. CRC Press; Boston, MA: 1994. pp. 171–250. [Google Scholar]
- Fisher R. Frequency Distribution of the Values of the Correlation Coefficient in Samples from an Indefinitely Large Population. Biometrika. 1915;10(4):507–521. [Google Scholar]
- Friston K.J. Functional and effective connectivity: a review. Brain Connect. 2011;1(1):13–36. doi: 10.1089/brain.2011.0008. [DOI] [PubMed] [Google Scholar]
- Fukuda K., Nisenbaum R., Stewart G., Thompson W.W., Robin L., Washko R.M., Noah D.L., Barrett D.H., Randall B., Herwaldt B.L., Mawle A.C., Reeves W.C. Chronic multisymptom illness affecting Air Force veterans of the Gulf War. JAMA. 1998;280:981–988. doi: 10.1001/jama.280.11.981. [DOI] [PubMed] [Google Scholar]
- Fuster J.M. Temporal processing. Ann. N. Y. Acad. Sci. 1995;769(1):173–182. doi: 10.1111/j.1749-6632.1995.tb38138.x. [DOI] [PubMed] [Google Scholar]
- Goldman-Rakic P.S., Cools A.R., Srivastava K. The prefrontal landscape: implications of functional architecture for understanding human mentation and the central executive [and discussion] Philos. Trans. R. Soc. B. 1996;351(1346):1445–1453. doi: 10.1098/rstb.1996.0129. [DOI] [PubMed] [Google Scholar]
- Goldman-Rakic P.S., Selemon L.D., Schwartz M.L. Dual pathways connecting the dorsolateral prefrontal cortex with the hippocampal formation and parahippocampal cortex in the rhesus monkey. Neuroscience. 1984;12(3):719–743. doi: 10.1016/0306-4522(84)90166-0. [DOI] [PubMed] [Google Scholar]
- Golomb B.A. RAND CORP; Santa Monica CA: 1999. A Review of the Scientific Literature as it Pertains to Gulf War Illnesses Volume 2: Pyridostigmine Bromide (No. RAND/MR-1018/2-OSD) [Google Scholar]
- Golomb B.A. Acetylcholinesterase inhibitors and Gulf War illnesses. Proc. Natl. Acad. Sci. U. S. A. 2008;105(11):4295–4300. doi: 10.1073/pnas.0711986105. [DOI] [PMC free article] [PubMed] [Google Scholar]
- Haley R.W., Kurt T.L. Self-reported exposure to neurotoxic chemical combinations in the Gulf War: a cross-sectional epidemiologic study. J. Am. Med. Assoc. 1997;277:231–237. [PubMed] [Google Scholar]
- Haley R.W., Tuite J.J. Epidemiological evidence of health effects from long-distance transit of chemical weapons fallout from bombing early in the 1991 Persian Gulf War. Neuroepidemiology. 2013;40(3):178–189. doi: 10.1159/000345124. [DOI] [PubMed] [Google Scholar]
- Haley R.W., Charuvastra E., Shell W.E., Buhner D.M., Marshall W.W., Biggs M.M., Hopkins S.C., Wolfe G.I., Verrnino S. Cholinergic autonomic dysfunction in veterans with Gulf War illness: Confirmation in a population-based sample. JAMA Neurol. 2013;70(2):191–200. doi: 10.1001/jamaneurol.2013.596. [DOI] [PubMed] [Google Scholar]
- Haley R.W., Kurt T.L., Hom J. Is there a Gulf War syndrome? Searching for syndromes by factor analysis of symptoms. J. Am. Med. Assoc. 1997;277:215–222. [PubMed] [Google Scholar]
- Haley R.W., Spence J.S., Carmack P.S., Gunst R.F., Schucany W.R., Petty F., Petty F., Devous M.D., Sr., Bonte F.J., Trivedi M.H. Abnormal brain response to cholinergic challenge in chronic encephalopathy from the 1991 Gulf War. Psychiatry Res. Neuroimaging. 2009;171(3):207–220. doi: 10.1016/j.pscychresns.2008.05.004. [DOI] [PubMed] [Google Scholar]
- Hasselmo M.E., Sarter M. Modes and models of forebrain cholinergic neuromodulation of cognition. Neuropsychopharmacology. 2011;36(1):52–73. doi: 10.1038/npp.2010.104. [DOI] [PMC free article] [PubMed] [Google Scholar]
- Heaton K.J., Palumbo C.L., Proctor S.P., Killiany R.J., Yurgelun-Todd D.A., White R.F. Quantitative magnetic resonance brain imaging in US army veterans of the 1991 Gulf War potentially exposed to sarin and cyclosarin. Neurotoxicology. 2007;28(4):761–769. doi: 10.1016/j.neuro.2007.03.006. [DOI] [PubMed] [Google Scholar]
- Hebb D.O. John Wiley & Sons; 1949. The organization of behavior: A neuropsychological approach. [Google Scholar]
- Henderson R.F., Barr E.B., Blackwell W.B., Clark C.R., Conn C.A., Kalra R., Marcha T.H., Soporia M.L., Tesfaigzia Y., Ménachea M.G., Mash D.C. Response of rats to low levels of sarin. Toxicol. Appl. Pharmacol. 2002;184(2):67–76. [PubMed] [Google Scholar]
- Holmes C.J., Hoge R., Collins L., Woods R., Toga A.W., Evans A.C. Enhancement of MR images using registration for signal averaging. J. Comput. Assist. Tomogr. 1998;22(2):324–333. doi: 10.1097/00004728-199803000-00032. [DOI] [PubMed] [Google Scholar]
- Hubbard N.A., Hutchison J.L., Motes M.A., Shokri-Kojori E., Bennett I.J., Brigante R.M., Haley R.W., Rypma B. Central executive dysfunction and deferred prefrontal processing in veterans with Gulf War Illness. Clin. Psychol. Sci. 2014;2(3):319–327. doi: 10.1177/2167702613506580. [DOI] [PMC free article] [PubMed] [Google Scholar]
- Hubbard N.A., Hutchison J.L., Turner M.P., Sundaram S., Oasay L., Robinson D., Strain J., Weaver T., Davis S., Remington G., Huang H., Biswal B.B., Hart J., Jr., Frohman T., Frohman E., Rypma B. Asynchrony in Executive Networks Predicts Cognitive Slowing in Multiple Sclerosis. Neuropsychology. 2016;30(1):75. doi: 10.1037/neu0000202. [DOI] [PubMed] [Google Scholar]
- Hutchison J.L., Lu H., Rypma B. Neural mechanisms of age-related slowing: the ΔCBF/ΔCMRO2 ratio mediates age-differences in BOLD signal and human performance. Cereb. Cortex. 2013;23:2337–2346. doi: 10.1093/cercor/bhs233. [DOI] [PMC free article] [PubMed] [Google Scholar]
- Hutchison J.L., Shokri-Kojori E., Lu H., Rypma B. A BOLD perspective on age-related neurometabolic-flow coupling and neural efficiency changes in human visual cortex. Front. Psychol. 2013:4. doi: 10.3389/fpsyg.2013.00244. [DOI] [PMC free article] [PubMed] [Google Scholar]
- Hutchison J.L., Hubbard N.A., Brigante R.M., Turner M., Sandoval T.I., Hillis G.A.J., Weaver T., Rypma B. The efficiency of fMRI region of interest analysis methods for detecting group differences. J. Neurosci. Methods. 2014;226:57–65. doi: 10.1016/j.jneumeth.2014.01.012. [DOI] [PMC free article] [PubMed] [Google Scholar]
- Iannacchione V.G., Dever J.A., Bann C.M., Considine K.A., Creel D., Carson C.P., Best H., Haley R.W. Validation of a research case definition of Gulf War illness in the 1991 US military population. Neuroepidemiology. 2011;37(2):129–140. doi: 10.1159/000331478. [DOI] [PubMed] [Google Scholar]
- Jiang Y., Huang H., Abner E., Broster L.S., Jicha G.A., Schmitt F.A., Kryscio R., Andersen A., Powell D., Van E.L., Gold B.T., Nelson P.T., Smith C., Ding M. Alzheimer's biomarkers are correlated with brain connectivity in older adults differentially during resting and task states. Front. Aging Neurosci. 2016;15 doi: 10.3389/fnagi.2016.00015. (Feb. 8, eCollection 2016) [DOI] [PMC free article] [PubMed] [Google Scholar]
- Jo H.J., Gotts S.J., Reynolds R.C., Bandettini P.A., Martin A., Cox R.W., Saad Z.S. Effective preprocessing procedures virtually eliminate distance-dependent motion artifacts in resting state FMRI. J. Appl. Math. 2013;2013 doi: 10.1155/2013/935154. [DOI] [PMC free article] [PubMed] [Google Scholar]
- Jung R.E., Haier R.J. The Parieto-Frontal Integration Theory (P-FIT) of intelligence: converging neuroimaging evidence. Behav. Brain Sci. 2007;30(02):135–154. doi: 10.1017/S0140525X07001185. [DOI] [PubMed] [Google Scholar]
- Kannurpatti S.S., Sanganahalli B.G., Herman P., Hyder F. Role of mitochondrial calcium uptake homeostasis in resting state fMRI brain networks. NMR Biomed. 2015;28(11):1579–1588. doi: 10.1002/nbm.3421. [DOI] [PMC free article] [PubMed] [Google Scholar]
- Koslik H.J., Hamilton G., Golomb B.A. Mitochondrial dysfunction in Gulf War illness revealed by 31Phosphorus Magnetic Resonance Spectroscopy: a case-control study. PLoS One. 2014;9(3) doi: 10.1371/journal.pone.0092887. [DOI] [PMC free article] [PubMed] [Google Scholar]
- Kurth S., Moyse E., Bahri M.A., Salmon E., Bastin C. Recognition of personally familiar faces and functional connectivity in Alzheimer's disease. Cortex. 2015;67:59–73. doi: 10.1016/j.cortex.2015.03.013. (Epub 2015 Apr 1) [DOI] [PubMed] [Google Scholar]
- Lafont S., Marin-Lamellet C., Paire-Ficout L., Thomas-Anterion C., Laurent B., Fabrigoule C. The Wechsler Digit Symbol Substitution Test as the best indicator of the risk of impaired driving in Alzheimer disease and normal aging. Dement. Geriatr. Cogn. Disord. 2010;29:154–163. doi: 10.1159/000264631. (Epub 2010 Feb 11) [DOI] [PubMed] [Google Scholar]
- Li X., Spence J.S., Buhner D.M., Hart J.J., Cullum C.M., Biggs M.M., Hester A.L., Odegard T.N., Carmack P.S., Briggs R.W., Haley R.W. Hippocampal dysfunction in Gulf War veterans: investigation with ASL perfusion MR imaging and physostigmine challenge. Radiology. 2011;261(1):218–225. doi: 10.1148/radiol.11101715. [DOI] [PMC free article] [PubMed] [Google Scholar]
- McClelland J.L., Rumelhart D.E., Hinton G.E. MIT Press; Cambridge, MA: 1986. The appeal of parallel distributed processing; pp. 3–44. [Google Scholar]
- Mufson E.J., Counts S.E., Perez S.E., Ginsberg S.D. Cholinergic system during the progression of Alzheimer's disease: therapeutic implications. Expert. Rev. Neurother. 2008;8:1703–1718. doi: 10.1586/14737175.8.11.1703. [DOI] [PMC free article] [PubMed] [Google Scholar]
- Neubauer A.C., Fink A. Intelligence and neural efficiency. Neurosci. Biobehav. Rev. 2009;33(7):1004–1023. doi: 10.1016/j.neubiorev.2009.04.001. [DOI] [PubMed] [Google Scholar]
- Niki H., Sakai M., Kubota K. Delayed alternation performance and unit activity of the caudate head and medial orbitofrontal gyrus in the monkey. Brain Res. 1972;38(2):343–353. doi: 10.1016/0006-8993(72)90717-2. [DOI] [PubMed] [Google Scholar]
- Odegard T.N., Cooper C.M., Farris E.A., Arduengo J., Bartlett J., Haley R. Memory impairment exhibited by veterans with gulf war illness. Neurocase. 2013;19(4):316–327. doi: 10.1080/13554794.2012.667126. [DOI] [PubMed] [Google Scholar]
- Park D.C., Reuter-Lorenz P. The adaptive brain: aging and neurocognitive scaffolding. Annu. Rev. Psychol. 2009;60:173. doi: 10.1146/annurev.psych.59.103006.093656. [DOI] [PMC free article] [PubMed] [Google Scholar]
- Petrides M., Pandya D.N. Projections to the frontal cortex from the posterior parietal region in the rhesus monkey. J. Comp. Neurol. 1984;228(1):105–116. doi: 10.1002/cne.902280110. [DOI] [PubMed] [Google Scholar]
- Petrides M., Pandya D.N. Dorsolateral prefrontal cortex: comparative cytoarchitectonic analysis in the human and the macaque brain and corticocortical connection patterns. Eur. J. Neurosci. 1999;11(3):1011–1036. doi: 10.1046/j.1460-9568.1999.00518.x. [DOI] [PubMed] [Google Scholar]
- Prabhakaran V., Rypma B., Gabrieli J.E. Neural substrates of mathematical reasoning: A functional magnetic resonance imaging study of neocortical activation during performance of the necessary arithmetic operations test. Neuropsychology. 2001;15(1):115–127. doi: 10.1037//0894-4105.15.1.115. [DOI] [PubMed] [Google Scholar]
- Prabhakaran V., Rypma B., Narayanan N.S., Meier T.B., Austin B.P., Nair V.A., Naing L., Thomas L.E., Gabrieli J.E. Capacity-Speed Relationships in Prefrontal Cortex. PLoS One. 2011;6(11) doi: 10.1371/journal.pone.0027504. [DOI] [PMC free article] [PubMed] [Google Scholar]
- Ragozzino M.E., Artis S., Singh A., Twose T.M., Beck J.E., Messer W.J. The selective M1 muscarinic cholinergic agonist CDD-0102A enhances working memory and cognitive flexibility. J. Pharmacol. Exp. Ther. 2012;340(3):588–594. doi: 10.1124/jpet.111.187625. [DOI] [PMC free article] [PubMed] [Google Scholar]
- Rapp M.A., Reischies F.M. Attention and executive control predict Alzheimer disease in late life: results from the Berlin Aging Study (BASE) Am. J. Geriatr. Psychiatr. 2005;13:134–141. doi: 10.1176/appi.ajgp.13.2.134. [DOI] [PubMed] [Google Scholar]
- Research Advisory Committee on Gulf War Veterans’ Illnesses . Department of Veterans Affairs; Washington, DC: 2008. Gulf War Illness and the health of Gulf War veterans.http://www1.va.gov/RAC-GWVI/Committee_Documents.asp Retrieved from. [Google Scholar]
- Reuter-Lorenz P.A., Cappell K.A. Neurocognitive aging and the compensation hypothesis. Curr. Dir. Psychol. Sci. 2008;17(3):177–182. [Google Scholar]
- Ricciardi E., Handjaras G., Bernardi G., Pietrini P., Furey M.L. Cholinergic enhancement reduces functional connectivity and BOLD variability in visual extrastriate cortex during selective attention. Neuropharmacology. 2013:64305–64313. doi: 10.1016/j.neuropharm.2012.07.003. [DOI] [PMC free article] [PubMed] [Google Scholar]
- Rusted J.M. Dissociative effects of scopolamine on working memory in healthy young volunteers. Psychopharmacology. 1988;96(4):487–492. doi: 10.1007/BF02180029. [DOI] [PubMed] [Google Scholar]
- Rusted J.M., Warburton D.M. The effects of scopolamine on working memory in healthy young volunteers. Psychopharmacology. 1988;96(2):145–152. doi: 10.1007/BF00177553. [DOI] [PubMed] [Google Scholar]
- Rypma B. Factors controlling neural activity during delayed-response task performance: Testing a memory organization hypothesis of prefrontal function. Neuroscience. 2006;139(1):223–235. doi: 10.1016/j.neuroscience.2005.07.062. [DOI] [PubMed] [Google Scholar]
- Rypma B., D'Esposito M. The roles of prefrontal brain regions in components of working memory: effects of memory load and individual differences. Proc. Natl. Acad. Sci. U. S. A. 1999;96(11):6558–6563. doi: 10.1073/pnas.96.11.6558. [DOI] [PMC free article] [PubMed] [Google Scholar]
- Rypma B., Prabhakaran V. When Less Is More and when More Is More: The Mediating Roles of Capacity and Speed in Brain-Behavior Efficiency. Intelligence. 2009;37(2):207–222. doi: 10.1016/j.intell.2008.12.004. [DOI] [PMC free article] [PubMed] [Google Scholar]
- Rypma B., Berger J.S., D’Esposito M. The Influence of Working-Memory Demand and Subject Performance on Prefrontal Cortical Activity. J. Cogn. Neurosci. 2002;14(5):721–731. doi: 10.1162/08989290260138627. [DOI] [PubMed] [Google Scholar]
- Rypma B., Berger J.S., Prabhakaran V., Bly B.M., Kimberg D.Y., Biswal B.B., D'Esposito M. Neural correlates of cognitive efficiency. NeuroImage. 2006;33(3):969–979. doi: 10.1016/j.neuroimage.2006.05.065. [DOI] [PubMed] [Google Scholar]
- Rypma B., Prabhakaran V., Desmond J.E., Glover G.H., Gabrieli J.D. Load-dependent roles of frontal brain regions in the maintenance of working memory. NeuroImage. 1999;9(2):216–226. doi: 10.1006/nimg.1998.0404. [DOI] [PubMed] [Google Scholar]
- Salthouse T.A. The processing-speed theory of adult age differences in cognition. Psychol. Rev. 1996;103(3):403. doi: 10.1037/0033-295x.103.3.403. [DOI] [PubMed] [Google Scholar]
- Serra L., Cercignani M., Mastropasqua C., Torso M., Spano B., Makovac E., Viola V., Giulietti G., Marra C., Caltagirone C., Bozzali M. Longitudinal changes in functional brain connectivity predicts conversion to Alzheimer's disease. J. Alzheimers Dis. 2016;51:377–389. doi: 10.3233/JAD-150961. [DOI] [PubMed] [Google Scholar]
- Shokri-Kojori E., Motes M.A., Rypma B., Krawczyk D.C. The network architecture of cortical processing in visuo-spatial reasoning. Sci. Rep. 2012;2411 doi: 10.1038/srep00411. [DOI] [PMC free article] [PubMed] [Google Scholar]
- Steele L. Prevalence and patterns of Gulf War illness in Kansas veterans: association of symptoms with characteristics of person, place, and time of military service. Am. J. Epidemiol. 2000;152:992–1002. doi: 10.1093/aje/152.10.992. [DOI] [PubMed] [Google Scholar]
- Sui X., Zhu M., Cui Y., Yu C., Sui J., Liu J., Duan Y., Zhang Z., Wang L., Zhang X., Jiang T. Functional connectivity hubs could serve as a potential biomarker in Alzheimer's disease: A reproducible study. Curr. Alzheimer Res. 2015;12:974–983. doi: 10.2174/1567205012666150710111615. [DOI] [PubMed] [Google Scholar]
- Tillman G.D., Calley C.S., Green T.A., Buhl V.I., Biggs M.M., Spence J.S., Briggs R.W., Haley R.W., Hart J., Jr., Kraut M.A. Event-related potential patterns associated with hyperarousal in Gulf War illness syndrome groups. Neurotoxicology. 2012;33(5):1096–1105. doi: 10.1016/j.neuro.2012.06.001. [DOI] [PMC free article] [PubMed] [Google Scholar]
- Tillman G.D., Calley C.S., Green T.A., Buhl V.I., Biggs M.M., Spence J.S., Briggs R.W., Haley R.W., Kraut M.A., Hart J., Jr. Visual event-related potentials as markers of hyperarousal in Gulf War illness: evidence against a stress-related etiology. Psychiatry Res. Neuroimaging. 2013;211(3):257–267. doi: 10.1016/j.pscychresns.2012.08.004. [DOI] [PMC free article] [PubMed] [Google Scholar]
- Tillman G.D., Green T.A., Ferree T.C., Calley C.S., Maguire M.J., Briggs R., Kraut M.A. Impaired response inhibition in ill Gulf War veterans. J. Neurol. Sci. 2010;297(1):1–5. doi: 10.1016/j.jns.2010.07.021. [DOI] [PubMed] [Google Scholar]
- Tuite J.J., Haley R.W. Meteorological and intelligence evidence of long-distance transit of chemical weapons fallout from bombing early in the 1991 Persian Gulf War. Neuroepidemiology. 2013;40(3):160–177. doi: 10.1159/000345123. [DOI] [PubMed] [Google Scholar]
- Van Essen D.C. Windows on the brain: the emerging role of atlases and databases in neuroscience. Curr. Opin. Neurobiol. 2002;12(5):574–579. doi: 10.1016/s0959-4388(02)00361-6. [DOI] [PubMed] [Google Scholar]
- Verhaeghen P., Cerella J., Semenec S.C., Leo M.A., Bopp K.L., Steitz D.W. Cognitive efficiency modes in old age: Performance on sequential and coordinative verbal and visuospatial tasks. Psychol. Aging. 2002;17(4):558. doi: 10.1037//0882-7974.17.4.558. [DOI] [PubMed] [Google Scholar]
- Vernon P.A. Speed of information processing and general intelligence. Intelligence. 1983;7(1):53–70. [Google Scholar]
- White R.F., Steele L., O'Callaghan J.P., Sullivan K., Binns J.H., Golomb B.A.…Hardie A. Recent research on Gulf War illness and other health problems in veterans of the 1991 Gulf War: Effects of toxicant exposures during deployment. Cortex. 2016;74:449–475. doi: 10.1016/j.cortex.2015.08.022. [DOI] [PMC free article] [PubMed] [Google Scholar]
- Yokoyama K., Araki S., Murata K., Nishikitani M., Okumura T., Ishimatsu S., Takasu N. Chronic neurobehavioral and central and autonomic nervous system effects of Tokyo subway sarin poisoning. J. Physiol. Paris. 1998;92:317–323. doi: 10.1016/s0928-4257(98)80040-5. [DOI] [PubMed] [Google Scholar]
Associated Data
This section collects any data citations, data availability statements, or supplementary materials included in this article.
Supplementary Materials
Anatomical regions showing hyper- or hypoconnectivity with BA 7.