

SYNOPSIS
DW and DCE MRI already contribute significantly to several aspects of personalized cancer medicine, namely diagnosis, treatment planning, response assessment, and prognosis. Nevertheless, the need for further standardization of theses imaging techniques is beyond question, and needs to be addressed. Whole body DW MRI is an exciting field, however future studies need to investigate in more depth the biologic significance of the findings depicted, their prognostic relevance and cost effectiveness in comparison to MDCT and PET/CT. New MR imaging probes such as targeted or activatable contrast agents and dynamic nuclear hyperpolarization show great promise to further improve the care of cancer patients in the near future.
Keywords: DWI, DCE, hepatobiliary contrast agent, SPIO, MRS, DNP
1. Introduction
The National Cancer Institute defines personalized cancer medicine as „a form of medicine that uses […] specific information about a person’s tumor to help diagnose, plan treatment, find out how well treatment is working, or make a prognosis“ (1). Functional imaging allows visual analysis and quantification of biological processes in vivo, such as tumor metabolism, chemical composition, and blood flow. Its most important strength in comparison to other laboratory based tests of tumor biology is its capacity for whole body imaging, to capture whole tumor heterogeneity in vivo, and the noninvasive assessment of (treatment related) changes over time. Genetic tumor analysis based on single/few tumor biopsy samples may not reflect intratumoral heterogeneity and phenotypic diversity. A study in primary renal carcinoma and associated metastatic sites revealed that intratumoral heterogeneity can lead to underestimation of the tumor genomic landscape represented from single tumor biopsy samples (2) and thus may contribute to treatment failure.
Multiple functional/molecular imaging technologies are available (3, 4), with positron emission tomography/computed tomography (PET/CT), single photon emission computed tomography (SPECT), and magnetic resonance imaging (MRI) being represented in clinical routine. Since these modalities image different biologic processes they have the potential to be used in conjunction rather than in competition with one another. Irrespective of their field of application the advantages of MRI in comparison to PET and SPECT relate to its high spatial and temporal resolution, the superior soft tissue contrast, the capacity of multiparametric imaging and the lack of ionizing radiation which is relevant in vulnerable populations such as children and women of child-bearing age (5), but might be less relevant in adult cancer patients who undergo chemo- and/or radiation therapy.
Several functional MRI techniques are being used to e.g. evaluate tissue organization with diffusion weighted imaging (DWI), to assess tumor vascularity with dynamic contrast enhanced (DCE) MRI, and to detect tumor metabolites using magnetic resonance spectroscopy (MRS)/spectroscopic imaging (MRSI) or dynamic nuclear polarization (DNP). In addition, several specific and non-specific MR contrast agents are clinically applicable or under investigation (3, 4). On T2*-weighted imaging hypoxia can be detected based on an increase in the transverse relaxation rate of water caused by the paramagnetic effect of endogenous deoxyhemoglobin using blood oxygen level dependent (BOLD) MR. This technique has been used for imaging tumor hypoxia and treatment response (6–8).
Radiogenomics is another exiting field that aims to correlate cancer imaging features and genetic data for the evaluation of imaging biomarkers. For example, imaging features extracted from MRI have been shown to be correlated with gene expression in breast cancer (9) and glioblastoma (10). Texture analysis describes mathematical parameters computed from the distribution of pixels and is a noninvasive method of assessing heterogeneity within the tumor. Features derived by texture analysis have for example been shown to act as a potential imaging biomarker of tumoral response to neoadjuvant chemo-/radiation therapy in rectal cancer (11).
2. Diffusion weighted imaging
DWI utilizes the incoherent three-dimensional motion of water molecules in vivo (Brownian motion) to generate contrast. The degree of water diffusion within intra-and extracellular fluid and between intra- and extracellular compartments is impeded by tissue cellularity, intracellular elements, membranes, and macromolecules (12). The motion of water molecules e.g. in tumor tissue, cytotoxic edema, abscess, and fibrosis is more restricted and displays higher DWI signal intensity. The apparent diffusion coefficient (ADC) is a measure of the magnitude of diffusion and is lower in tissue with restricted diffusion compared to normal parenchyma (Figure 1). ADC is expressed in units of mm2/s.
Figure 1.
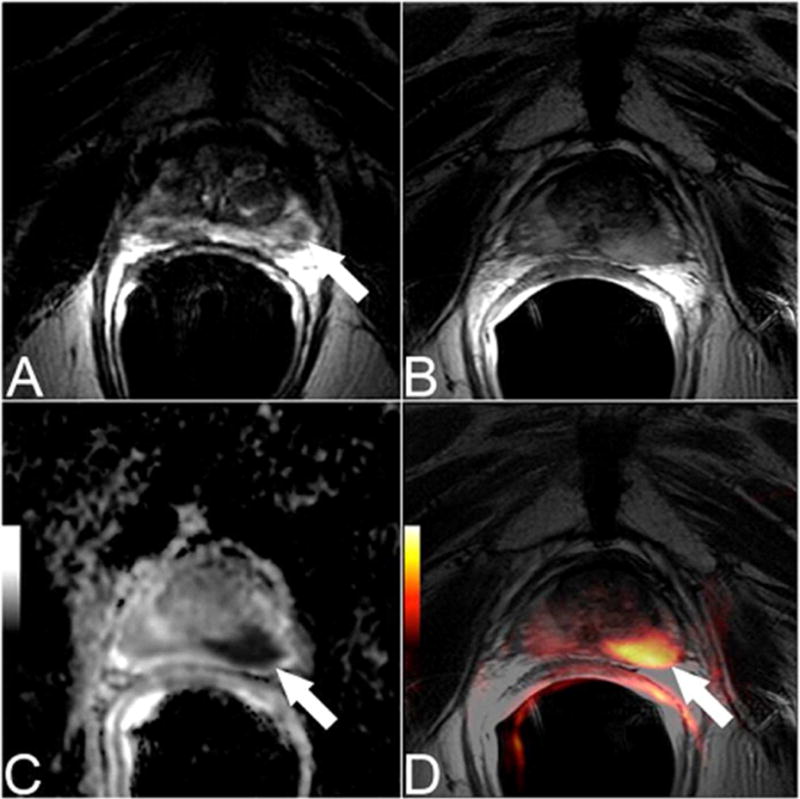
Pretreatment transverse T2-weighted image (A) showed a tumor focus in the left peripheral zone. The patient was treated with radiation therapy. An MRI was performed 2 years later due to rising PSA. A discrete abnormality was difficult to appreciate on the transverse T2-weighted images at this time (B), however the ADC map (b-values of b=0, 1000 s/mm2) (C) and the fused T2-weighted and DW MR images (D) clearly depict the presence of recurrent tumor.
Diffusion based contrast primarily depends on the selection of b values (the degree of diffusion weighting that is applied during image acquisition), with improved contrast to noise ratio at higher b values, at the expense of lower signal-to-noise ratios. In general, malignant tumors exhibit higher DWI signal and lower ADC values compared to normal/reactive tissue or benign tumors. DWI has been shown to improve detection and diagnostic accuracy in several primary malignancies, for example in prostate (13) or endometrial (14) cancer. DWI in conjunction with morphologic MR imaging sequences improves detection of metastatic spread to the peritoneal cavity (15), in particularly in gynecologic malignancies with a reported sensitivity and specificity for the detection of peritoneal implants of 90% and 95.5%, respectively (16).
In several studies lower ADC values have been associated with a more aggressive tumor (17–20). However, DWI signal intensity and ADC values are dependent on histologic characteristics such as tumor type, tumor grade/differentiation, and extent of necrosis (12). False negatives may occur particularly in well-differentiated tumors, in cystic or necrotic lesions. Abscess and infection might cause false positive findings.
Low pretreatment tumor ADC has been found to predict a favorable treatment response, for example in colorectal and gastric carcinomas (21, 22). This observation might be explained by the relationship between tumor necrosis and unfavorable patient outcomes.
Successful treatment is generally reflected by decreases in signal intensity on high b value images and corresponding increases in ADC values due to treatment induced necrosis, edema or cellular lysis; all of them induce an increase in water diffusion in the extracellular space. However, transient early decreases in ADC values can be seen after treatment (23).
The development of echoplanar imaging, high gradient amplitudes, multichannel coils, and parallel imaging facilitated DWI to be extended to whole body imaging (23) (Figure 2). Whole body DW MRI is an exciting field to image systemic disease such as multiple myeloma, lymphoma and leukemia, but also solid tumors with associated metastatic spread, particularly those involving the skeleton. Whole body DWI can provide complementary information to CT, PET/CT and SPECT or might be able to replace tests using ionizing radiation. However, published data on staging/restaging accuracy and treatment response assessment are limited. Whole body DWI for tumor staging has some limitations, especially with regards to the limited anatomical coverage for intravenous contrast-enhanced sequences. Some solutions have been proposed. For example Klenk et al (24) used ferumoxytol (AMAG Pharmaceuticals inc, Waltham, MA, USA) enhanced whole body DWI for staging of children and young adults with malignant lymphoma and sarcoma in comparison to 18F-FDG PET/CT. Ferumoxytol increases the signal intensity on T1-weighted and decreases the signal intensity on T2-weighted images (hereby improving the contrast between tumor and the reticuloendothelial system). The fusion of ferumoxytol-enhanced whole-body DWI scans with ferumoxytol-enhanced anatomical T1-weighted scans provided diagnostic images very similar to an 18F-FDG PET/CT scan with equivalent sensitivities, specificities, and staging results of both imaging modalities (24).
Figure 2.
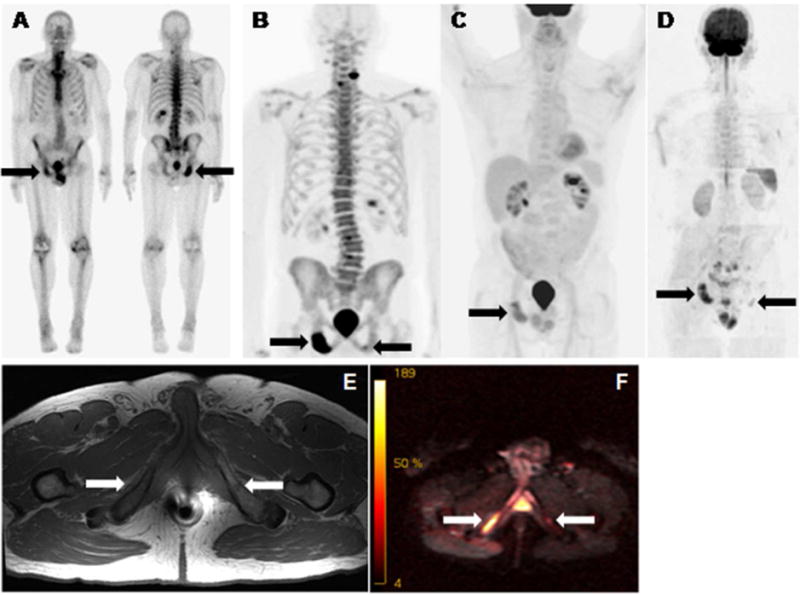
Bone scan (A), 18F-sodium floride PET (B), 18F-FDG PET (C), whole body DW MR (D), T1w MR (E), and b50/900 fused MR (F) of a patient with metastazied prostate cancer. All scans readily depicted a bone met in the right pubic bone (right arrows on all images). 18F-sodium floride PET (B) and whole body DW MR (D/F) detected an additional T1 low signal lesion in the left pubic bone suspicious for metastatic disease (left arrows on B, D, E and F). Degenerative 18F-sodium floride avidity of the spine (B).
Short- and midterm test-retest variability of repeated ADC measurements in a healthy population has been reported to be not significant with a mean coefficient of variation of 14% (25). However, the authors suggest that treatment effects of less than approximately 27% (1.96 × coefficient of variation) will not be meaningfully detectable (25). Interestingly this definition of tumor response is very similar to what was reported in several studies investigating metabolic tumor response by 18F-FDG PET and which was suggested as a cutoff in the recently introduced PERCIST criteria (26).
The lack of standardization and the limited published data on interscanner variability hinder the comparison of DWI results between studies. A recent prospective study (27) evaluated the variability of ADC values in various anatomic regions in the upper abdomen measured with systems from different vendors and with different field strengths. The authors found no significant differences between ADC values measured at 1.5T and at 3T in any anatomic region. However, in two of seven regions at 1.5 T (left and right liver lobes) and in four of seven regions at 3T (left liver lobe, pancreas, and renal cortex and medulla), intervendor differences were significant.
3. Dynamic contrast-enhanced MRI and MR contrast agents
Perfusion imaging
Extracellular paramagnetic gadolinium based contrast agents (EGBCA) distribute nonspecifically in the blood plasma and interstitial space and are administered to reduce the T1 relaxation time of nearby protons, and therewith increase the signal intensity on T1-weighted images. In oncologic imaging DCE MRI uses a bolus injection of EGBCA to acquire multiple serial images as the contrast agent passes through tissue to obtain information on altered blood flow and vascularization of tumors. The perfusion data extracted from DCE MRI can be investigated qualitatively (visual), in a semiquantitative or quantitative manner to obtain data on enhancement fraction and permeability, respectively. Most of the pharmacologic models used for the quantitative approach are based on determining the rate of contrast exchange between blood plasma and extracellular space using transfer rate constants, such as Ktrans (forward volume transfer constant) an kep (reverse reflux rate constant between extracellular space and plasma).
The absence of enhancement is a strong predictor of benignity in several tumors, e.g. in breast cancer (28), whereas the semiquantitative enhancement criterion that suggests malignancy is a rapid initial enhancement (Figure 3). Quantitative DCE MRI also allows differentiation of malignant from benign tumors as has been shown for example in adnexal masses (29). On the other hand, qualitative DCE MRI time curve type analysis was found to perform poorly for the differentiation of prostate cancer from healthy prostatic tissue (30). DCE is currently considered to add relatively little incremental value to the combination of T2w and DWI for the detection of prostate cancer, as reflected in the recently updated Prostate Imaging and Reporting and Data Systems: Version 2 (PIRADS v2.0), which ascribed DCE a minor role in determining the PIRADS Assessment Category when T2W and DWI are of diagnostic quality (31). The addition of DCE MRI to T2-weighted and DWI also did not contribute significant incremental value in the detection of locally recurrent prostate cancer after radiation therapy (32).
Figure 3.
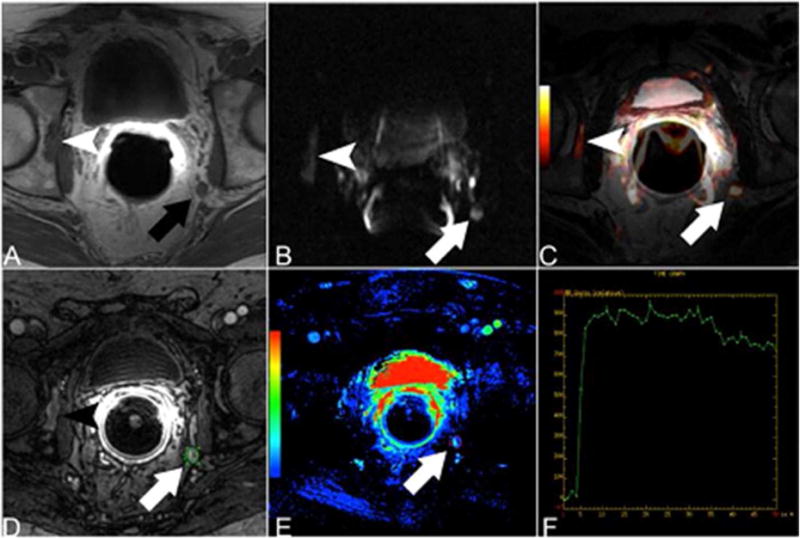
Patient with rising PSA after radical prostatectomy. Hypointense lesion in the right acetabulum (arrowhead) and enlarged left internal iliac lymph node (arrow) are suspicious for metastatic disease on T1-weighted MRI (A). DWI (B) and fused T2-weighted and DWI data (C) show hyperintense signal in the right acetabulum as well as in the left internal iliac lymph node. DCE MRI (D) shows early contrast media uptake of both lesions. The parametric map (E) and the time-signal intensity curve (F) confirm the early contrast media uptake.
Anatomic tumor size measurements using standard WHO, RECIST, and RECIST 1.1 criteria (33) have limitations, particularly in assessing early treatment response and in assessing the effects of molecularly targeted therapies and anti-angiogenic strategies that stabilize disease rather than induce fast tumor shrinkage. DCE MRI parameters can serve as predictive biomarkers and enable early treatment response assessment in patients who undergo treatment with anti-angiogenic drugs and other therapies (34–38). However, the clinical application of the potentially powerful biomarkers derived from DCE MRI has been limited by the lack of standardization to permit interscanner/interinstitutional comparison of DCE MRI studies. Initiatives such as the Quantitative Imaging Biomarker Alliance (39) will help to address these issues in the future.
Hepatobiliary contrast agents
Three hepatobiliary contrast agents (HBCA) have been developed for liver MR imaging: gadoxetic acid (Gd-EOB-DTPA; Eovist® (US), Primovist® (Europe, Australia)), gadobenate dimeglumine (Gd-BOPTA; MultiHance®), and Mangafodipir trisodium (Mn-DPDP; Teslascan®; marketing status: discontinued). Gd-BOPTA and Gd-EOB-DTPA are taken up to varying degrees by functioning hepatocytes via organic anion transporters and are subsequently excreted in the bile (Figure 4). The relatively stronger hepatic signal intensity and biliary tree enhancement of Gd-EOB-DTPA in comparison to Gd-BOPTA results due to approximately 50% and 3–5% of excretion via the bile route, respectively (40). T1 shortening of the liver and biliary tree results in an increased difference in signal intensity for nonhepatocellular lesions compared with normal liver background. Therefore, HBCA allow dynamic imaging in the arterial phase (20s p.i.), portal venous phase (60–70s p.i.) and late venous phase (2–3 min p.i.), as well as liver specific imaging with regards to a lesions hepatocyte function and hepatocyte content during the hepatobiliary phase (20 min p.i.) (41). The results of several studies have shown that MRI with HBCA depicts more metastatic lesions in the liver than contrast enhanced MRI with EGBCA and adds diagnostic information and confidence (42, 43). Gd-BOPTA and Gd-EOB-DTPA have been shown to be equivalent to EGBCA dynamic imaging for lesion characterization (44, 45). However, the relatively short bolus transit time due to the lower approved dose of Gd-EOB-DTPA (0.025 mmol/kg) in comparison to conventional EGBCA (1.0 mmol/kg) may result in weaker arterial enhancement of liver lesions and impaired lesion characterization. Therefore, the acquisition of the arterial phase needs specific attention and might benefit from modified injection strategies (46, 47). In addition, acute self-limiting dyspnea was observed significantly more often using gadoxetate disodium compared to gadobenate dimeglumine and might affect arterial phase MR image quality (48).
Figure 4.
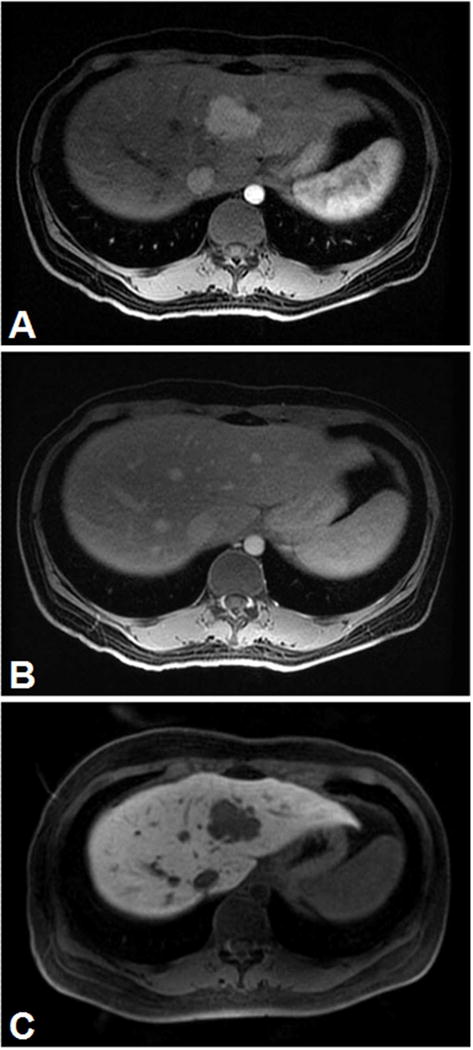
Hypervascular hepatic tumor (A), no washout of extracellular contrast agent (B) but hypointense on delayed hepatobiliary phase with Eovist (C). The biopsy was consistent with adrenocortical metastasis.
(Courtesy of Dr. Richard Kinh Gian Do, MSKCC)
Superparamagnetic particles of iron oxide (SPIO)
SPIO are composed of a crystalline iron oxide core (ferri(Fe3+)magnetic and ferro(Fe2+) magnetic material in the form of maghemite (γFe2O3) and magnetite (Fe3O4)) and a stabilizing coating material, usually made of low molecular weight dextran. SPIO are divided into different classes according to their global size: standard SPIO (SSPIO) have a diameter of >50nm, whereas SPIO with a diameter of <50nm are referred to as ultra small particles of iron oxide (USPIO). Due to their shortening of T2/T2* they are also known as negative, i.e. signal eliminating, contrast agents with darkening of the contrast enhanced tissue at a given echo time. However, enhancement on T1-weighted images can also be seen with the smaller nanoparticles. Various SPIO have been tested in clinical and preclinical settings (49).
The passive uptake of SPIO in the mononuclear phagocyte system or reticuloendothelial system after intravenous application has been shown to increase the sensitivity of detecting metastasis in the liver (50), the spleen (51), lymph nodes (52), and bone marrow (53).
Other MR imaging agents
Nanoparticles can also be targeted towards specific receptors or molecules by conjugating specific ligands to their surface such as antibodies, peptides, or small molecules (3).
Activatable MR contrast agents enable to induce an imaging signal only when a particular disease state is present (54, 55).
Due to the 100% natural abundance and relatively high sensitivity of 19F for MRI (83% to that of protons), 19F MRI has been used in preclinical and clinical studies to track drug biodistribution (56), and to assess regional tumor hypoxia amongst others (57).
Another example is chemical exchange saturation transfer (CEST) agents, where contrast enhancement is based on selectively reducing the magnetization of the water signal, with only minimal effect on its longitudinal relaxation rate (58). Multimodality probes aim to combine MRI with nuclear or optical imaging to obtain high spatial resolution and high sensitivity or enable preoperative staging and intraoperative molecular imaging (3).
4. Imaging of tumor metabolites using “traditional” magnetic resonance spectroscopy/spectroscopic imaging and dynamic nuclear polarization
“Traditional” magnetic resonance spectroscopy
MRS/MRSI permits noninvasive acquisition of signals from cancer metabolites. Accessible nuclei are e.g. 1H, 31P, 23Na, 19F, 13C (59), with differences in detectability and signal intensity related to variations in signal susceptibility, percentage isotope concentration, and tissue concentration. Clinical MRS/MRSI studies use signals from 1H nuclei of compounds in tissue since 1H nuclei provide the largest signal, and do not require hardware modification to the scanner (60). The major metabolites evaluated in 1H MRS include choline (cell membrane marker), creatine (energy marker), lipids (tissue breakdown and cell death), lactate (metabolic acidosis), and in the brain N-acetyl aspartate (normal neuronal marker) (61).
The metabolic fingerprints of several malignancies have been studied, however the main field of investigation is the brain (Figure 5), followed by prostate and breast imaging. Most brain tumors manifest with relative reduction of N-acetyl aspartate and elevation of choline. MRS in brain tumors has been shown to be a useful tool in the initial diagnosis, tumor grading, imaging guided biopsy, and treatment response assessment (62, 63). Elevated choline signal however can also be observed in other tumors, such as prostate cancer (64) and breast cancer (65). Early studies in prostate cancer reported an ability of MRS to help differentiate cancer from benign/necrotic tissue (66–68), however a prospective multicenter study, conducted by the American College of Radiology Imaging Network (ACRIN) reported that the addition of MR spectroscopic imaging to anatomic MR imaging did not improve the accuracy for localization of peripheral zone prostate cancer (69). In breast cancer, a prospective single center study reported that MRS in addition to DCE MRI and DWI improves the accuracy of breast cancer diagnosis (70). The evaluation of MRS using newer platforms with improved spatial and temporal resolution and comparisons to currently standard of care functional techniques such as DWI is warranted.
Figure 5.
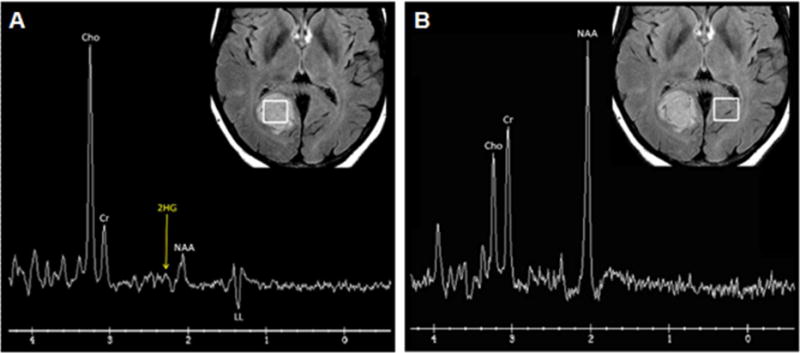
Single voxel spectroscopy in a FLAIR hyperintense IDH mutant low grade astrocytoma. The tumor (A) shows high choline (Cho, a cell membrane marker) at 3.2 ppm, low creatine (Cr, an energy marker) at 3.0 ppm, low N-acetylaspartate (NAA, a neuronal marker) at 2.0 ppm, and inverted lipid/lactate (LL, an anaerobic glycolysis marker) at 1.3 ppm. The high choline and lipid/lactate are consistent with malignancy. Using a variable TE1/TE2, a small 2HG (2-hydroxyglutarate, an oncometabolite formed exclusively by isocitrate dehydrogenase [IDH] mutant tumors) peak is also present at 2.25 ppm. Compare with normal spectrum seen in contralateral brain (B) with absent 2HG peak.
(Courtesy of Dr. Robert J. Young, MSKCC)
Dynamic nuclear polarization (hyperpolarization)
MRI signal intensity is proportional to the spin polarization (the difference in the fraction of nuclei aligned with or against an applied magnetic field). Since polarization is typically very small on the order of 0.0001% to 0.0005% depending on the nucleus and field, nuclei other than protons (with its high concentration in water and fat which overcomes poor polarization) are difficult to image using standard techniques (71). Hyperpolarization refers to a procedure that drives nuclei (such as 15N or 13C), temporarily, into a significant redistribution of the ordinary population of energy levels to gain signals 10.000-fold or more (71).
After the administration of a hyperpolarized agent (such as [1-13C] pyruvate) the agent’s delivery as well as its metabolic substrates can be monitored using MRI. Measurements of hyperpolarized 13C label flux between pyruvate and lactate in lymphoma (72) and glioblastoma (73) bearing mice has been shown to be able to detect response to chemotherapy. In addition, the amount of hyperpolarized lactate measured after injection of hyperpolarized [1- 13C] pyruvate showed great potential as a new biomarker capable of noninvasively grading prostate cancer in mice (74). The first in-man imaging study of MRI with hyperpolarized [1- 13C] pyruvate in 31 patients with untreated biopsy proven prostate cancer (75) confirmed the safety of the agent (no dose limiting toxicities were observed) and showed elevated [1- 13C] lactate/[1- 13C] pyruvate ratio in regions of biopsy proven prostate cancer (75).
5. Summary – functional MRI today and tomorrow
DW and DCE MRI already contribute significantly to several aspects of personalized cancer medicine, namely diagnosis, treatment planning, response assessment, and prognosis. Nevertheless, the need for further standardization of theses imaging techniques is beyond question, and needs to be addressed. Whole body DWI is an exciting field, however future studies need to investigate in more depth the biologic significance of the findings depicted, their prognostic relevance and cost effectiveness in comparison to MDCT and PET/CT. New MR imaging probes such as targeted or activatable contrat agents and dynamic nuclear hyperpolarization show great promise to further improve the care of cancer patients in the near future.
KEY POINTS.
-
■
Several functional MRI techniques are being used to detect biological processes in vivo, e.g. to evaluate tissue organization with DWI, to assess tumor vascularity with DCE MRI or tumor metabolites using MRS or DNP.
-
■
The most important strength of functional MRI is its capacity for whole body imaging, to capture whole tumor heterogeneity in vivo, and the noninvasive assessment of changes over time.
-
■
Standardization of these imaging techniques needs to be addressed in the future.
Footnotes
Publisher's Disclaimer: This is a PDF file of an unedited manuscript that has been accepted for publication. As a service to our customers we are providing this early version of the manuscript. The manuscript will undergo copyediting, typesetting, and review of the resulting proof before it is published in its final citable form. Please note that during the production process errors may be discovered which could affect the content, and all legal disclaimers that apply to the journal pertain.
DISCLOSURE STATEMENT
The Authors have nothing to disclose.
Contributor Information
Hebert Alberto Vargas, Email: vargasah@mskcc.org.
Evis Sala, Email: salae@mskcc.org.
References
- 1.http://www.cancer.gov/dictionary?cdrid=561717.
- 2.Gerlinger M, Rowan AJ, Horswell S, et al. Intratumor heterogeneity and branched evolution revealed by multiregion sequencing. N Engl J Med. 2012 Mar 8;366(10):883–92. doi: 10.1056/NEJMoa1113205. [DOI] [PMC free article] [PubMed] [Google Scholar]
- 3.Kircher MF, Willmann JK. Molecular body imaging: MR imaging, CT, and US. part I. principles. Radiology. 2012 Jun;263(3):633–43. doi: 10.1148/radiol.12102394. [DOI] [PMC free article] [PubMed] [Google Scholar]
- 4.Kircher MF, Willmann JK. Molecular body imaging: MR imaging, CT, and US. Part II. Applications. Radiology. 2012 Aug;264(2):349–68. doi: 10.1148/radiol.12111703. [DOI] [PubMed] [Google Scholar]
- 5.Pearce MS, Salotti JA, Little MP, et al. Radiation exposure from CT scans in childhood and subsequent risk of leukaemia and brain tumours: a retrospective cohort study. Lancet. 2012 Aug 4;380(9840):499–505. doi: 10.1016/S0140-6736(12)60815-0. [DOI] [PMC free article] [PubMed] [Google Scholar]
- 6.Gross S, Gilead A, Scherz A, Neeman M, Salomon Y. Monitoring photodynamic therapy of solid tumors online by BOLD-contrast MRI. Nat Med. 2003 Oct;9(10):1327–31. doi: 10.1038/nm940. [DOI] [PubMed] [Google Scholar]
- 7.Jiang L, Weatherall PT, McColl RW, Tripathy D, Mason RP. Blood oxygenation level-dependent (BOLD) contrast magnetic resonance imaging (MRI) for prediction of breast cancer chemotherapy response: a pilot study. Journal of magnetic resonance imaging: JMRI. 2013 May;37(5):1083–92. doi: 10.1002/jmri.23891. [DOI] [PubMed] [Google Scholar]
- 8.Lin YC, Wang JJ, Hong JH, et al. Noninvasive monitoring of microvascular changes with partial irradiation using dynamic contrast-enhanced and blood oxygen level-dependent magnetic resonance imaging. Int J Radiat Oncol Biol Phys. 2013 Apr 1;85(5):1367–74. doi: 10.1016/j.ijrobp.2012.10.022. [DOI] [PubMed] [Google Scholar]
- 9.Grimm LJ, Zhang J, Mazurowski MA. Computational approach to radiogenomics of breast cancer: Luminal A and luminal B molecular subtypes are associated with imaging features on routine breast MRI extracted using computer vision algorithms. Journal of magnetic resonance imaging: JMRI. 2015 Mar 17; doi: 10.1002/jmri.24879. [DOI] [PubMed] [Google Scholar]
- 10.Zinn PO, Mahajan B, Sathyan P, et al. Radiogenomic mapping of edema/cellular invasion MRI-phenotypes in glioblastoma multiforme. PLoS One. 2011;6(10):e25451. doi: 10.1371/journal.pone.0025451. [DOI] [PMC free article] [PubMed] [Google Scholar]
- 11.De Cecco CN, Ganeshan B, Ciolina M, et al. Texture analysis as imaging biomarker of tumoral response to neoadjuvant chemoradiotherapy in rectal cancer patients studied with 3-T magnetic resonance. Invest Radiol. 2015 Apr;50(4):239–45. doi: 10.1097/RLI.0000000000000116. [DOI] [PubMed] [Google Scholar]
- 12.Padhani AR, Liu G, Koh DM, et al. Diffusion-weighted magnetic resonance imaging as a cancer biomarker: consensus and recommendations. Neoplasia. 2009 Feb;11(2):102–25. doi: 10.1593/neo.81328. [DOI] [PMC free article] [PubMed] [Google Scholar]
- 13.Jung SI, Donati OF, Vargas HA, Goldman D, Hricak H, Akin O. Transition zone prostate cancer: incremental value of diffusion-weighted endorectal MR imaging in tumor detection and assessment of aggressiveness. Radiology. 2013 Nov;269(2):493–503. doi: 10.1148/radiology.13130029. [DOI] [PubMed] [Google Scholar]
- 14.Beddy P, Moyle P, Kataoka M, et al. Evaluation of depth of myometrial invasion and overall staging in endometrial cancer: comparison of diffusion-weighted and dynamic contrast-enhanced MR imaging. Radiology. 2012 Feb;262(2):530–7. doi: 10.1148/radiol.11110984. [DOI] [PubMed] [Google Scholar]
- 15.Low RN, Sebrechts CP, Barone RM, Muller W. Diffusion-weighted MRI of peritoneal tumors: comparison with conventional MRI and surgical and histopathologic findings–a feasibility study. AJR American journal of roentgenology. 2009 Aug;193(2):461–70. doi: 10.2214/AJR.08.1753. [DOI] [PubMed] [Google Scholar]
- 16.Fujii S, Matsusue E, Kanasaki Y, et al. Detection of peritoneal dissemination in gynecological malignancy: evaluation by diffusion-weighted MR imaging. Eur Radiol. 2008 Jan;18(1):18–23. doi: 10.1007/s00330-007-0732-9. [DOI] [PubMed] [Google Scholar]
- 17.Woodfield CA, Tung GA, Grand DJ, Pezzullo JA, Machan JT, Renzulli JF., 2nd Diffusion-weighted MRI of peripheral zone prostate cancer: comparison of tumor apparent diffusion coefficient with Gleason score and percentage of tumor on core biopsy. AJR American journal of roentgenology. 2010 Apr;194(4):W316–22. doi: 10.2214/AJR.09.2651. [DOI] [PubMed] [Google Scholar]
- 18.Hilario A, Ramos A, Perez-Nunez A, et al. The added value of apparent diffusion coefficient to cerebral blood volume in the preoperative grading of diffuse gliomas. AJNR Am J Neuroradiol. 2012 Apr;33(4):701–7. doi: 10.3174/ajnr.A2846. [DOI] [PMC free article] [PubMed] [Google Scholar]
- 19.Nakanishi M, Chuma M, Hige S, et al. Relationship between diffusion-weighted magnetic resonance imaging and histological tumor grading of hepatocellular carcinoma. Ann Surg Oncol. 2012 Apr;19(4):1302–9. doi: 10.1245/s10434-011-2066-8. [DOI] [PubMed] [Google Scholar]
- 20.Curvo-Semedo L, Lambregts DM, Maas M, Beets GL, Caseiro-Alves F, Beets-Tan RG. Diffusion-weighted MRI in rectal cancer: apparent diffusion coefficient as a potential noninvasive marker of tumor aggressiveness. Journal of magnetic resonance imaging: JMRI. 2012 Jun;35(6):1365–71. doi: 10.1002/jmri.23589. [DOI] [PubMed] [Google Scholar]
- 21.Cui Y, Zhang XP, Sun YS, Tang L, Shen L. Apparent diffusion coefficient: potential imaging biomarker for prediction and early detection of response to chemotherapy in hepatic metastases. Radiology. 2008 Sep;248(3):894–900. doi: 10.1148/radiol.2483071407. [DOI] [PubMed] [Google Scholar]
- 22.Heijmen L, Ter Voert EE, Oyen WJ, et al. Multimodality imaging to predict response to systemic treatment in patients with advanced colorectal cancer. PLoS One. 2015;10(4):e0120823. doi: 10.1371/journal.pone.0120823. [DOI] [PMC free article] [PubMed] [Google Scholar]
- 23.Koh DM, Collins DJ. Diffusion-weighted MRI in the body: applications and challenges in oncology. AJR American journal of roentgenology. 2007 Jun;188(6):1622–35. doi: 10.2214/AJR.06.1403. [DOI] [PubMed] [Google Scholar]
- 24.Klenk C, Gawande R, Uslu L, et al. Ionising radiation-free whole-body MRI versus (18)F-fluorodeoxyglucose PET/CT scans for children and young adults with cancer: a prospective, non-randomised, single-centre study. Lancet Oncol. 2014 Mar;15(3):275–85. doi: 10.1016/S1470-2045(14)70021-X. [DOI] [PubMed] [Google Scholar]
- 25.Braithwaite AC, Dale BM, Boll DT, Merkle EM. Short- and midterm reproducibility of apparent diffusion coefficient measurements at 3.0-T diffusion-weighted imaging of the abdomen. Radiology. 2009 Feb;250(2):459–65. doi: 10.1148/radiol.2502080849. [DOI] [PubMed] [Google Scholar]
- 26.Wahl RL, Jacene H, Kasamon Y, Lodge MA. From RECIST to PERCIST: Evolving Considerations for PET response criteria in solid tumors. J Nucl Med. 2009 May;50(Suppl 1):122S–50S. doi: 10.2967/jnumed.108.057307. [DOI] [PMC free article] [PubMed] [Google Scholar]
- 27.Donati OF, Chong D, Nanz D, et al. Diffusion-weighted MR imaging of upper abdominal organs: field strength and intervendor variability of apparent diffusion coefficients. Radiology. 2014 Feb;270(2):454–63. doi: 10.1148/radiol.13130819. [DOI] [PubMed] [Google Scholar]
- 28.Schnall MD, Blume J, Bluemke DA, et al. Diagnostic architectural and dynamic features at breast MR imaging: multicenter study. Radiology. 2006 Jan;238(1):42–53. doi: 10.1148/radiol.2381042117. [DOI] [PubMed] [Google Scholar]
- 29.Thomassin-Naggara I, Balvay D, Aubert E, et al. Quantitative dynamic contrast-enhanced MR imaging analysis of complex adnexal masses: a preliminary study. Eur Radiol. 2012 Apr;22(4):738–45. doi: 10.1007/s00330-011-2329-6. [DOI] [PubMed] [Google Scholar]
- 30.Hansford BG, Peng Y, Jiang Y, et al. Dynamic Contrast-enhanced MR Imaging Curve-type Analysis: Is It Helpful in the Differentiation of Prostate Cancer from Healthy Peripheral Zone? Radiology. 2015 Jan 5;:140847. doi: 10.1148/radiol.14140847. [DOI] [PubMed] [Google Scholar]
- 31.http://www.acr.org/Quality-Safety/Resources/PIRADS.
- 32.Donati OF, Jung SI, Vargas HA, et al. Multiparametric prostate MR imaging with T2-weighted, diffusion-weighted, and dynamic contrast-enhanced sequences: are all pulse sequences necessary to detect locally recurrent prostate cancer after radiation therapy? Radiology. 2013 Aug;268(2):440–50. doi: 10.1148/radiol.13122149. [DOI] [PMC free article] [PubMed] [Google Scholar]
- 33.Tirkes T, Hollar MA, Tann M, Kohli MD, Akisik F, Sandrasegaran K. Response criteria in oncologic imaging: review of traditional and new criteria. Radiographics. 2013 Sep-Oct;33(5):1323–41. doi: 10.1148/rg.335125214. [DOI] [PubMed] [Google Scholar]
- 34.Barrett T, Gill AB, Kataoka MY, et al. DCE and DW MRI in monitoring response to androgen deprivation therapy in patients with prostate cancer: a feasibility study. Magn Reson Med. 2012 Mar;67(3):778–85. doi: 10.1002/mrm.23062. [DOI] [PubMed] [Google Scholar]
- 35.Gollub MJ, Gultekin DH, Akin O, et al. Dynamic contrast enhanced-MRI for the detection of pathological complete response to neoadjuvant chemotherapy for locally advanced rectal cancer. Eur Radiol. 2012 Apr;22(4):821–31. doi: 10.1007/s00330-011-2321-1. [DOI] [PubMed] [Google Scholar]
- 36.Jensen LR, Garzon B, Heldahl MG, Bathen TF, Lundgren S, Gribbestad IS. Diffusion-weighted and dynamic contrast-enhanced MRI in evaluation of early treatment effects during neoadjuvant chemotherapy in breast cancer patients. Journal of magnetic resonance imaging: JMRI. 2011 Nov;34(5):1099–109. doi: 10.1002/jmri.22726. [DOI] [PubMed] [Google Scholar]
- 37.Kim JH, Kim CK, Park BK, Park SY, Huh SJ, Kim B. Dynamic contrast-enhanced 3-T MR imaging in cervical cancer before and after concurrent chemoradiotherapy. Eur Radiol. 2012 Nov;22(11):2533–9. doi: 10.1007/s00330-012-2504-4. [DOI] [PubMed] [Google Scholar]
- 38.Padhani AR, Leach MO. Antivascular cancer treatments: functional assessments by dynamic contrast-enhanced magnetic resonance imaging. Abdom Imaging. 2005 May-Jun;30(3):324–41. doi: 10.1007/s00261-004-0265-5. [DOI] [PubMed] [Google Scholar]
- 39.https://www.rsna.org/QIBA.aspx.
- 40.Reimer P, Schneider G, Schima W. Hepatobiliary contrast agents for contrast-enhanced MRI of the liver: properties, clinical development and applications. Eur Radiol. 2004 Apr;14(4):559–78. doi: 10.1007/s00330-004-2236-1. [DOI] [PubMed] [Google Scholar]
- 41.Jhaveri K, Cleary S, Audet P, et al. Consensus statements from a multidisciplinary expert panel on the utilization and application of a liver-specific MRI contrast agent (gadoxetic acid) AJR American journal of roentgenology. 2015 Mar;204(3):498–509. doi: 10.2214/AJR.13.12399. [DOI] [PubMed] [Google Scholar]
- 42.Hammerstingl R, Huppertz A, Breuer J, et al. Diagnostic efficacy of gadoxetic acid (Primovist)-enhanced MRI and spiral CT for a therapeutic strategy: comparison with intraoperative and histopathologic findings in focal liver lesions. Eur Radiol. 2008 Mar;18(3):457–67. doi: 10.1007/s00330-007-0716-9. [DOI] [PubMed] [Google Scholar]
- 43.Zech CJ, Herrmann KA, Reiser MF, Schoenberg SO. MR imaging in patients with suspected liver metastases: value of liver-specific contrast agent Gd-EOB-DTPA. Magn Reson Med Sci. 2007;6(1):43–52. doi: 10.2463/mrms.6.43. [DOI] [PubMed] [Google Scholar]
- 44.Huppertz A, Haraida S, Kraus A, et al. Enhancement of focal liver lesions at gadoxetic acid-enhanced MR imaging: correlation with histopathologic findings and spiral CT–initial observations. Radiology. 2005 Feb;234(2):468–78. doi: 10.1148/radiol.2342040278. [DOI] [PubMed] [Google Scholar]
- 45.Kuwatsuru R, Kadoya M, Ohtomo K, et al. Comparison of gadobenate dimeglumine with gadopentetate dimeglumine for magnetic resonance imaging of liver tumors. Invest Radiol. 2001 Nov;36(11):632–41. doi: 10.1097/00004424-200111000-00002. [DOI] [PubMed] [Google Scholar]
- 46.Motosugi U, Ichikawa T, Sou H, et al. Dilution method of gadolinium ethoxybenzyl diethylenetriaminepentaacetic acid (Gd-EOB-DTPA)-enhanced magnetic resonance imaging (MRI) Journal of magnetic resonance imaging: JMRI. 2009 Oct;30(4):849–54. doi: 10.1002/jmri.21913. [DOI] [PubMed] [Google Scholar]
- 47.Schmid-Tannwald C, Herrmann K, Oto A, Panteleon A, Reiser M, Zech C. Optimization of the dynamic, Gd-EOB-DTPA-enhanced MRI of the liver: the effect of the injection rate. Acta radiologica. 2012 Nov 1;53(9):961–5. doi: 10.1258/ar.2012.120186. [DOI] [PubMed] [Google Scholar]
- 48.Davenport MS, Viglianti BL, Al-Hawary MM, et al. Comparison of acute transient dyspnea after intravenous administration of gadoxetate disodium and gadobenate dimeglumine: effect on arterial phase image quality. Radiology. 2013 Feb;266(2):452–61. doi: 10.1148/radiol.12120826. [DOI] [PubMed] [Google Scholar]
- 49.Ittrich H, Peldschus K, Raabe N, Kaul M, Adam G. Superparamagnetic iron oxide nanoparticles in biomedicine: applications and developments in diagnostics and therapy. Rofo. 2013 Dec;185(12):1149–66. doi: 10.1055/s-0033-1335438. [DOI] [PubMed] [Google Scholar]
- 50.Fretz CJ, Stark DD, Metz CE, et al. Detection of hepatic metastases: comparison of contrast-enhanced CT, unenhanced MR imaging, and iron oxide-enhanced MR imaging. AJR American journal of roentgenology. 1990 Oct;155(4):763–70. doi: 10.2214/ajr.155.4.2119106. [DOI] [PubMed] [Google Scholar]
- 51.Ferrucci JT, Stark DD. Iron oxide-enhanced MR imaging of the liver and spleen: review of the first 5 years. AJR American journal of roentgenology. 1990 Nov;155(5):943–50. doi: 10.2214/ajr.155.5.2120963. [DOI] [PubMed] [Google Scholar]
- 52.Weissleder R, Elizondo G, Wittenberg J, Lee AS, Josephson L, Brady TJ. Ultrasmall superparamagnetic iron oxide: an intravenous contrast agent for assessing lymph nodes with MR imaging. Radiology. 1990 May;175(2):494–8. doi: 10.1148/radiology.175.2.2326475. [DOI] [PubMed] [Google Scholar]
- 53.Kotoura N, Sakamoto K, Fukuda Y, et al. Evaluation of magnetic resonance signal intensity in bone marrow after administration of super paramagnetic iron oxide (SPIO) Nihon Hoshasen Gijutsu Gakkai Zasshi. 2011;67(3):212–20. doi: 10.6009/jjrt.67.212. [DOI] [PubMed] [Google Scholar]
- 54.Querol M, Bogdanov A., Jr Environment-sensitive and enzyme-sensitive MR contrast agents. Handb Exp Pharmacol. 2008;(185 Pt 2):37–57. doi: 10.1007/978-3-540-77496-9_3. [DOI] [PubMed] [Google Scholar]
- 55.Chauvin T, Durand P, Bernier M, et al. Detection of enzymatic activity by PARACEST MRI: a general approach to target a large variety of enzymes. Angew Chem Int Ed Engl. 2008;47(23):4370–2. doi: 10.1002/anie.200800809. [DOI] [PubMed] [Google Scholar]
- 56.Wolters M, Mohades SG, Hackeng TM, Post MJ, Kooi ME, Backes WH. Clinical perspectives of hybrid proton-fluorine magnetic resonance imaging and spectroscopy. Invest Radiol. 2013 May;48(5):341–50. doi: 10.1097/RLI.0b013e318277528c. [DOI] [PubMed] [Google Scholar]
- 57.Chen JJ, Lanza GM, Wickline SA. Quantitative magnetic resonance fluorine imaging: today and tomorrow. Wiley Interdisciplinary Reviews-Nanomedicine and Nanobiotechnology. 2010 Jul-Aug;2(4):431–40. doi: 10.1002/wnan.87. [DOI] [PMC free article] [PubMed] [Google Scholar]
- 58.Hancu I, Dixon WT, Woods M, Vinogradov E, Sherry AD, Lenkinski RE. CEST and PARACEST MR contrast agents. Acta radiologica. 2010 Oct;51(8):910–23. doi: 10.3109/02841851.2010.502126. [DOI] [PMC free article] [PubMed] [Google Scholar]
- 59.Negendank W. Studies of human tumors by MRS: a review. NMR Biomed. 1992 Sep-Oct;5(5):303–24. doi: 10.1002/nbm.1940050518. [DOI] [PubMed] [Google Scholar]
- 60.Winfield JM, Payne GS, deSouza NM. Functional MRI and CT biomarkers in oncology. Eur J Nucl Med Mol Imaging. 2015 Apr;42(4):562–78. doi: 10.1007/s00259-014-2979-0. [DOI] [PubMed] [Google Scholar]
- 61.Wang LL, Leach JL, Breneman JC, McPherson CM, Gaskill-Shipley MF. Critical role of imaging in the neurosurgical and radiotherapeutic management of brain tumors. Radiographics. 2014 May-Jun;34(3):702–21. doi: 10.1148/rg.343130156. [DOI] [PubMed] [Google Scholar]
- 62.Brandao LA, Shiroishi MS, Law M. Brain tumors: a multimodality approach with diffusion-weighted imaging, diffusion tensor imaging, magnetic resonance spectroscopy, dynamic susceptibility contrast and dynamic contrast-enhanced magnetic resonance imaging. Magn Reson Imaging Clin N Am. 2013 May;21(2):199–239. doi: 10.1016/j.mric.2013.02.003. [DOI] [PubMed] [Google Scholar]
- 63.Hollingworth W, Medina LS, Lenkinski RE, et al. A systematic literature review of magnetic resonance spectroscopy for the characterization of brain tumors. AJNR Am J Neuroradiol. 2006 Aug;27(7):1404–11. [PMC free article] [PubMed] [Google Scholar]
- 64.Kurhanewicz J, Vigneron D, Carroll P, Coakley F. Multiparametric magnetic resonance imaging in prostate cancer: present and future. Curr Opin Urol. 2008 Jan;18(1):71–7. doi: 10.1097/MOU.0b013e3282f19d01. [DOI] [PMC free article] [PubMed] [Google Scholar]
- 65.Begley JK, Redpath TW, Bolan PJ, Gilbert FJ. In vivo proton magnetic resonance spectroscopy of breast cancer: a review of the literature. Breast Cancer Res. 2012;14(2):207. doi: 10.1186/bcr3132. [DOI] [PMC free article] [PubMed] [Google Scholar]
- 66.Mueller-Lisse UG, Vigneron DB, Hricak H, et al. Localized prostate cancer: effect of hormone deprivation therapy measured by using combined three-dimensional 1H MR spectroscopy and MR imaging: clinicopathologic case-controlled study. Radiology. 2001 Nov;221(2):380–90. doi: 10.1148/radiol.2211001582. [DOI] [PubMed] [Google Scholar]
- 67.Parivar F, Hricak H, Shinohara K, et al. Detection of locally recurrent prostate cancer after cryosurgery: evaluation by transrectal ultrasound, magnetic resonance imaging, and three-dimensional proton magnetic resonance spectroscopy. Urology. 1996 Oct;48(4):594–9. doi: 10.1016/S0090-4295(96)00250-6. [DOI] [PubMed] [Google Scholar]
- 68.Pickett B, Kurhanewicz J, Coakley F, Shinohara K, Fein B, Roach M., 3rd Use of MRI and spectroscopy in evaluation of external beam radiotherapy for prostate cancer. Int J Radiat Oncol Biol Phys. 2004 Nov 15;60(4):1047–55. doi: 10.1016/j.ijrobp.2004.05.015. [DOI] [PubMed] [Google Scholar]
- 69.Weinreb JC, Blume JD, Coakley FV, et al. Prostate cancer: sextant localization at MR imaging and MR spectroscopic imaging before prostatectomy–results of ACRIN prospective multi-institutional clinicopathologic study. Radiology. 2009 Apr;251(1):122–33. doi: 10.1148/radiol.2511080409. [DOI] [PMC free article] [PubMed] [Google Scholar]
- 70.Pinker K, Bogner W, Baltzer P, et al. Improved diagnostic accuracy with multiparametric magnetic resonance imaging of the breast using dynamic contrast-enhanced magnetic resonance imaging, diffusion-weighted imaging, and 3-dimensional proton magnetic resonance spectroscopic imaging. Invest Radiol. 2014 Jun;49(6):421–30. doi: 10.1097/RLI.0000000000000029. [DOI] [PubMed] [Google Scholar]
- 71.Kurhanewicz J, Vigneron DB, Brindle K, et al. Analysis of cancer metabolism by imaging hyperpolarized nuclei: prospects for translation to clinical research. Neoplasia. 2011 Feb;13(2):81–97. doi: 10.1593/neo.101102. [DOI] [PMC free article] [PubMed] [Google Scholar]
- 72.Day SE, Kettunen MI, Gallagher FA, et al. Detecting tumor response to treatment using hyperpolarized C-13 magnetic resonance imaging and spectroscopy. Nature Medicine. 2007 Nov;13(11):1382–7. doi: 10.1038/nm1650. [DOI] [PubMed] [Google Scholar]
- 73.Park I, Larson PEZ, Zierhut ML, et al. Hyperpolarized C-13 magnetic resonance metabolic imaging: application to brain tumors. Neuro-Oncology. 2010 Feb;12(2):133–44. doi: 10.1093/neuonc/nop043. [DOI] [PMC free article] [PubMed] [Google Scholar]
- 74.Albers MJ, Bok R, Chen AP, et al. Hyperpolarized C-13 Lactate, Pyruvate, and Alanine: Noninvasive Biomarkers for Prostate Cancer Detection and Grading. Cancer Research. 2008 Oct 15;68(20):8607–15. doi: 10.1158/0008-5472.CAN-08-0749. [DOI] [PMC free article] [PubMed] [Google Scholar]
- 75.Nelson SJ, Kurhanewicz J, Vigneron DB, et al. Metabolic imaging of patients with prostate cancer using hyperpolarized [1-(1)(3)C]pyruvate. Sci Transl Med. 2013 Aug 14;5(198):198ra08. doi: 10.1126/scitranslmed.3006070. [DOI] [PMC free article] [PubMed] [Google Scholar]