

Abstract
Specific alterations in hepatic lipid composition characterize the spectrum of nonalcoholic fatty liver disease (NAFLD), which extends from nonalcoholic fatty liver (NAFL) to nonalcoholic steatohepatitis (NASH). However, the plasma lipidome of NAFLD and whether NASH has a distinct plasma lipidomic signature are unknown. A comprehensive analysis of plasma lipids and eicosanoid metabolites quantified by mass spectrometry was performed in NAFL (n = 25) and NASH (n = 50) subjects and compared with lean normal controls (n = 50). The key findings include significantly increased total plasma monounsaturated fatty acids driven by palmitoleic (16:1 n7) and oleic (18:1 n9) acids content (P < 0.01 for both acids in both NAFL and NASH). The levels of palmitoleic acid, oleic acid, and palmitoleic acid to palmitic acid (16:0) ratio were significantly increased in NAFLD across multiple lipid classes. Linoleic acid (8:2n6) was decreased (P < 0.05), with a concomitant increase in γ-linolenic (18:3n6) and dihomo γ-linolenic (20:3n6) acids in both NAFL and NASH (P < 0.001 for most lipid classes). The docosahexanoic acid (22:6 n3) to docosapentenoic acid (22:5n3) ratio was significantly decreased within phosphatidylcholine (PC), and phosphatidylethanolamine (PE) pools, which was most marked in NASH subjects (P < 0.01 for PC and P < 0.001 for PE). The total plasmalogen levels were significantly decreased in NASH compared with controls (P < 0.05). A stepwise increase in lipoxygenase (LOX) metabolites 5(S)-hydroxyeicosatetraenoic acid (5-HETE), 8-HETE, and 15-HETE characterized progression from normal to NAFL to NASH. The level of 11-HETE, a nonenzymatic oxidation product of arachidonic (20:4) acid, was significantly increased in NASH only. Conclusions: Although increased lipogenesis, desaturases, and LOX activities characterize NAFL and NASH, impaired peroxisomal polyunsaturated fatty acid (PUFA) metabolism and nonenzymatic oxidation is associated with progression to NASH.
Nonalcoholic fatty liver disease (NAFLD) affects a third of the American population.1 The clinical-histological spectrum of NAFLD includes nonalcoholic fatty liver (NAFL) and nonalcoholic steatohepatitis (NASH).2 NASH can progress to cirrhosis in up to 15% of patients.3 Although NASH is distinguished from NAFL by the presence of cytological ballooning and inflammation on histology, both are characterized by hepatic steatosis.2,4 Hepatic fat accumulation is thus the hallmark of NAFLD.
The principal risk factor for the development of NAFLD is insulin resistance.5,6 The insulin-resistant state is associated with increased lipolysis and release of free fatty acids (FFA), which are available for hepatic uptake and re-esterification to triacylglycerols (TAGs).5,7 Although the focus of studies of the metabolic disturbances in NAFLD has centered on FFAs and their role in causing liver injury,8–11 it is now appreciated that the lipid metabolic perturbations in NAFLD are more complex. Using a metabolomic approach, it has recently been shown that NAFLD is also characterized by increased diacylglycerol (DAG), free cholesterol, decreased phosphatidylcholine (PC), and altered n3 and n6 polyunsaturated fatty acid (PUFA) metabolism.12,13 Importantly, the levels of arachidonic acid (20:4 n6), the precursor of many biologically active eicosanoids, are depleted.12 It is not known, however, whether these changes are reflected in the circulating lipidome and whether NASH is associated with a distinct lipidomic signature. For that matter, even the plasma lipidome of healthy adults is not well characterized.
In this study, a lipidomic approach was taken to characterize the state of lipid metabolism as reflected in the circulation in healthy individuals and to compare this with that of subjects with either NAFL or NASH. This was accomplished by (1) quantification of the absolute and relative amounts of different lipid classes, including FFA, TAG, and phospholipids; (2) comparison of the distribution of fatty acids within each of these lipid classes in the study groups; and (3) quantification of inflammatory eicosanoids in plasma. The objectives were to both characterize the normal circulating lipid metabolome and determine the changes that occurred in subjects with NAFLD.
Patients and Methods
Study Cohort
Consecutive subjects with suspected or a recently established (within 3 months) diagnosis of NAFLD and lean healthy volunteers who agreed to participate were screened after providing informed consent. NAFLD was suspected by the presence of abnormal liver enzymes without evidence of other liver diseases, radiological evidence of a fatty liver, or in obese subjects with components of the metabolic syndrome using the Adult Treatment Panel III criteria.14 All subjects underwent routine clinical, hematological, biochemical, serological, and radiological evaluation. Subjects with suspected NAFLD then underwent a percutaneous liver biopsy.
A total of three groups were studied: (1) lean normal controls; (2) NAFL; and (3) NASH. Fatty liver was diagnosed by the presence of hepatic steatosis of at least grade 1 severity according to the NASH Clinical Research Network criteria without any accompanying inflammation or ballooning.15 Steatohepatitis was defined by the presence of steatosis, inflammation, and cytological ballooning of at least grade 1 severity each.15 The nonalcoholic nature of the disease was established by clinical assessment that the alcohol consumption was less than 20 g/day for women and 30 g/day for men. Lean normal controls were identified by a body mass index between 18 and 25 kg/m2, absence of symptoms or signs of disease, normal liver enzymes, and hepatic sonogram.
The subjects with a history of excessive alcohol use above the threshold values set or evidence of other causes of liver disease (viral hepatitis B and C, primary biliary cirrhosis, sclerosing cholangitis, autoimmune hepatitis, hemochromatosis, Wilson’s disease, alpha-1-antitrypsin deficiency, and drug-induced liver disease) were excluded. Subjects with bridging fibrosis or cirrhosis were excluded.
For subjects with suspected NAFLD, blood was drawn on the morning of the biopsy under fasting conditions. In the rest, blood was drawn during a clinic visit under fasting conditions. Plasma was separated and stored at −80°C for future studies. The study was performed according to the Virginia Commonwealth University regulations for the protection of human research subjects after the protocol was reviewed and approved by the institutional review board.
Reagents
All chromatography solvents were obtained from Fisher Scientific (Pittsburgh, PA). Silica Gel 60 thin-layer chromatography (TLC) plates (10 × 20 cm) were obtained from E. Merck (Darmstadt, Germany). Ethylenediaminetetra-acetic acid (EDTA) and butylated hydroxytoluene were obtained from Sigma Chemical Co. (St. Louis, MO). Fatty acid methyl ester and internal phospholipid standards were obtained from Nu-Chek-Prep (Elysian, MN) and Avanti Polar Lipids (Alabaster, AL), respectively.
Lipid and Eicosanoid Profiling
Plasma lipid profiles were analyzed as previously described16 and are noted later.:
Extraction and TLC
Lipids were extracted from 200 μL of plasma in the presence of internal standards by Folch’s method using chloroform:methanol (2:1 vol/vol).17 Individual lipid classes from each extract were separated by preparative chromatography, as described previously.18 Briefly, TLC plates were impregnated with 1 mM EDTA, pH 5.5, and washed by ascending development.19 Sample extracts were dried under nitrogen and spotted onto EDTA-impregnated TLC plates. For the separation of neutral lipid classes (FFA, TAG, DAG, free cholesterol, cholesterol ester), a solvent system consisting of petroleum ether/diethyl ether/acetic acid (80:20:1, by volume) was employed.20 Individual phospholipid classes (LYPC, lysophoshatidylcholine; PC, sphingomyelin) were separated by high-performance liquid chromatography (Agilent Technologies model 1100 Series). These methods were initially validated in plasma samples of varying amounts against internal standards, and accurate data could be obtained from 200 μL plasma.
Isolation and Methylation of Lipid Classes
Lipid classes and individual phospholipid classes were identified by comparison with the authentic standards chromatographed in the reference lanes. Lipid fractions were transesterified in 1% sulfuric acid in methanol, under an N2 atmosphere at 100°C for 60 minutes, in a sealed vial. The resulting fatty acid methyl esters were extracted with hexane containing 0.05% butylated hydroxytoulene and prepared for gas chromatography by sealing the hexane extracts under nitrogen.
Fatty Acid Analysis
Fatty acid methyl esters were separated and quantified by capillary gas chromatography using a Hewlett-Packard (Wilmington, DE) gas chromatograph (model 6890) equipped with a 30-m HP-88 capillary column (Agilent Technologies, Folsom, CA), a flame-ionization detector, and Thermo Fisher Scientific Atlas software.
Eicosanoid Analysis
The eicosanoids from 250 μL plasma were extracted using protein precipitation and filtering. Twenty microliters of a mixture of deuterated surrogates for quantitation was added to each sample and thoroughly vortexed. To each plasma sample, 10 μL antioxidant solution (0.2 mg/mL butylated hydroxytoulene EDTA in 50:50 MeOH:H2O) was added and thoroughly vortexed. Proteins precipitation was carried out by adding 1 mL methanol to each sample followed by vortexing. The samples were centrifuged at −4°C and 17,000g for 10 minutes. The supernatants were dried under nitrogen for 2 hours at 10 psi. Dried samples were reconstituted with 60 μL methanol:deionized water (50:50). After vortexing, samples were transferred to sialinized autosampler inserts for liquid chromatography tandem mass spectrometry analysis. The samples were injected onto an Agilent Stable Bond C18 reverse-phase column (150 × 2.1 mm, 1.8 μm) connected to an Agilent Technologies 1200 Series HPLC and an Applied Biosystems 4000 QTRAP. The analytes were ionized via negative electrospray, and the mass spectrometer was operated in the tandem MS mode.
Data Analysis
Summary data for fatty acid classes and mole percent (percentage of each fatty acid of the total fatty acids within each lipid class) data were calculated. Fatty acid methyl ester compositions also were used for studying compound structure. Results were expressed as means ± standard error of the mean (SEM). Kruskal-Wallis analysis of variance with Dunn’s post hoc multiple comparison procedure was used for across-group comparisons, whereas for two-group comparison, a nonparametric Wilcoxon signed-rank test was used. A P-value of 0.05 or less was considered significant.
Results
Consecutive subjects who met inclusion criteria were enrolled in each of the three study groups: (1) lean normal controls (n = 50), (2) NAFL (n = 25), and (3) NASH (n = 50). The baseline characteristics of the study population are shown in Table 1. Compared with lean normal controls, subjects with NAFL and NASH had higher aspartate aminotransferase and alanine aminotransferase levels, lower high-density lipoprotein, higher low-density lipoprotein, and higher triglycerides. As expected, a significant proportion of NAFL and NASH subjects had features of metabolic syndrome.
Table 1.
Baseline Characteristics of the Study Population
| Parameters | Control (n = 50) | NAFL (n = 25) | NASH (n = 50) |
|---|---|---|---|
| Sex (F/M) | 40/10 | 10/15 | 35/15 |
| White/African American/others | 30/4/16 | 19/3/3 | 39/4/3 |
| Mean age (years) | 36.82 ± 0.45 | 48.2 ± 2.1* | 52.52 ± 0.35* |
| BMI (kg/m2) | 21.22 ± 0.09 | 35.2 ± 0.89* | 32.12 ± 0.31* |
| Fasting glucose (mg/dL) | 81.3 ± 3.1 | 107.6 ± 11.4* | 101.2 ± 4.6* |
| AST (normal range, 0–50 U/L) | 27.4 ± 0.25 | 46.7 ± 6.3* | 52.85 ± 1.42* |
| ALT (normal range, 0–50 U/L) | 24.86 ± 0.35 | 83.7 ± 15.2* | 76.04 ± 2.9* |
| Alkaline phosphatase (U/L) | 54.76 ± 0.8 | 87.3 ± 5.2* | 95.39 ± 1.86* |
| Total bilirubin (mg/dL) | 0.4 | 0.6 | 0.7 |
| Albumin (g/dL) | 4.2 | 4.3 | 4.2 |
| Total cholesterol (mg/dL) | 178.18 ± 1.52 | 213.7 ± 10.2 | 189.85 ± 1.86 |
| HDL-cholesterol (mg/dL) | 55.4 ± 0.54 | 55.5 ± 2.4 | 46.8 ± 0.71* |
| LDL-cholesterol (mg/dL) | 99.84 ± 1.33 | 121.1 ± 6.8 | 117.44 ± 1.51* |
| Triglycerides (mg/dL) | 85.88 ± 1.62 | 183.6 ± 11.9* | 143.15 ± 2.2* |
| Diabetes (%) | 0 | 28* | 31* |
| Hypertension (%) | 0 | 52* | 63* |
| Dyslipidemia (%) | 0 | 56* | 56* |
BMI, body mass index; NAFL, nonalcoholic fatty liver; NASH, nonalcoholic steatohepatitis.
Data are expressed as mean ± SEM.
P < 0.05 versus control (ANOVA).
Changes in Total Plasma Lipid Content
The total plasma fatty acids were also increased in these groups compared with lean normal controls but reached significance only for NAFL (normal versus NAFL versus NASH [mean ± SEM]: 1396 ± 41 versus 1784 ± 139 versus 1520 ± 42 nmol/g, P < 0.001 NAFL versus normal) (Table 2). Compared with normal controls, the total saturated fatty acids were increased in both NAFL and NASH (479 ± 14 versus 631 ± 52 versus 536 ± 17 nmol/g) but reached significance for NAFL only (P < 0.001 for NAFL versus control). Interestingly, monounsaturated fatty acids were increased significantly in both NAFL and NASH. This was attributable to increased levels of palmitoleic (16:1 n7) and oleic (18:1 n9) acids in NAFL and NASH (P < 0.01 for both acids in both NAFL and NASH versus normal). The total PUFA levels were not significantly different across the three groups.
Table 2.
Total Plasma Lipid Composition (nmol/g Plasma) in the Study Population
| Lipids | Control (n = 50) | NAFL (n = 25) | NASH (n = 50) |
|---|---|---|---|
| Total fatty acids | 1396.2 ± 41.3 | 1784.3 ± 139.7** | 1520.1 ± 42.6 |
| Saturated fatty acid (SFA) | 479.2 ± 14.1 | 631.4 ± 52.3** | 536.3 ± 17.5 |
| Myristic acid (14:0) | 26 ± 1.2 | 36.6 ± 3.5* | 31 ± 1.7 |
| Pentadecanoic acid (15:0) | 5.1 ± 0.3 | 5.6 ± 0.5 | 5.5 ± 0.3 |
| Palmitic acid (16:0) | 326.8 ± 10.4 | 449.3 ± 40.5*** | 366.1 ± 12.3 |
| Stearic acid (18:0) | 113.9 ± 3.5 | 132.9 ± 9.2 | 126.6 ± 4.1 |
| Arachidic acid (20:0) | 2.3 ± 0.1 | 2.3 ± 0.1 | 2.3 ± 0.1 |
| Behenic acid (22:0) | 3.7 ± 0.2 | 3.6 ± 0.2 | 3.6 ± 0.1 |
| Lignoceric acid (24:0) | 2.8 ± 0.1 | 2.7 ± 0.2 | 2.7 ± 0.1 |
| Monounsaurated fatty acid (MUFA) | 294.8 ± 11 | 461.4 ± 44.9*** | 366.3 ± 12*** |
| Total n7 fattty acids | 42.5 ± 2.2 | 72.3 ± 7.3*** | 58.4 ± 2.7*** |
| Total n9 fatty acids | 252.2 ± 9.2 | 388.4 ± 37.9*** | 307.6 ± 9.7*** |
| Myristoleic acid (14:1n5) | 1.7 ± 0.1 | 2.7 ± 0.3** | 2.2 ± 0.1* |
| Palmitoleic acid (16:1n7) | 25.4 ± 1.7 | 49.4 ± 4.9*** | 38.8 ± 2.2*** |
| Vaccenic acid (18:1n7) | 19.7 ± 0.8 | 26.4 ± 2.5** | 23.8 ± 1** |
| Oleic acid (18:1n9) | 243.2 ± 9 | 380.3 ± 37.5*** | 297.5 ± 9.4*** |
| Eicosenoic acid (20:1n9) | 3.5 ± 0.1 | 5.2 ± 0.5 | 4.8 ± 0.2 |
| Mead acid (20:3n9) | 1.7 ± 0.1 | 2.1 ± 0.2 | 2 ± 0.2 |
| Erucic acid (22:1n9) | 1.3 ± 0.1 | 1.3 ± 0.2 | 1.5 ± 0.3 |
| Nervonic acid (24:1n9) | 4.8 ± 0.2 | 4 ± 0.3 | 4.5 ± 0.2 |
| Polyunsaturated fatty acid (PUFA) | 612.1 ± 19.6 | 683 ± 45.7 | 609 ± 16.4 |
| Total n6 fatty acids | 556.1 ± 18.3 | 622 ± 42.9 | 557.8 ± 14.8 |
| Total n3 fatty acids | 54.6 ± 3.8 | 59.4 ± 4.1 | 49.9 ± 2.8 |
| Linoleic acid (18:2n6) | 420.3 ± 14.9 | 467.5 ± 36.6 | 412 ± 11.2 |
| γ-linolenic acid (18:3n6) | 7 ± 0.5 | 11.2 ± 1.1*** | 9.2 ± 0.4** |
| Eicosadienoic acid (20:2n6) | 4 ± 0.2 | 4.4 ± 0.4 | 4 ± 0.2 |
| Homo-γ-linolenic acid (20:3n6) | 19.2 ± 0.8 | 27.6 ± 2.3*** | 25.5 ± 1.4** |
| Arachidonic acid (20:4n6) | 101.7 ± 4.3 | 105.8 ± 5.4 | 102.7 ± 4.4 |
| Docosadienoic acid (22:2n6) | 0.3 ± 0 | 0.3 ± 0 | 0.3 ± 0 |
| Adrenic acid (22:4n6) | 4.1 ± 0.2 | 5.9 ± 0.7 | 5.1 ± 0.2 |
| Docosapentaenoic acid (22:5n6) | 3 ± 0.2 | 3.5 ± 0.3 | 3.4 ± 0.2 |
| α-linolenic acid (18:3n3) | 10.2 ± 0.7 | 13.7 ± 1.5 | 10 ± 0.5 |
| Stearidonic acid (18:4n3) | 0.8 ± 0.1 | 1.2 ± 0.1** | 0.9 ± 0.1 |
| Eicsoatetraenoic acid (20:4n3) | 1.3 ± 0.1 | 2 ± 0.2 | 1.6 ± 0.1 |
| Eicosapentaenoic acid (20:5n3) | 10.2 ± 1.9 | 10.8 ± 1.3 | 8.5 ± 0.9 |
| Docosapentaenoic acid (22:5n3) | 7.5 ± 0.4 | 9.9 ± 0.9** | 8.4 ± 0.4 |
| Docosahexaenoic acid (22:6n3) | 29.1 ± 1.9 | 25.6 ± 1.8 | 24.1 ± 1.6* |
| Total plasmalogens (dm) | 27.3 ± 1.6 | 23.7 ± 1.4 | 22.5 ± 1.1* |
| Dimethyl 16:0 (dm16:0) | 13.8 ± 0.6 | 11.6 ± 0.7 | 11.4 ± 0.5** |
| Dimethyl 18:0 (dm18:0) | 12 ± 0.8 | 12.3 ± 1 | 9.8 ± 0.6 |
| Dimethyl 18:1n7 (dm18:1n7) | 1.5 ± 0.1 | 1.1 ± 0.1 | 1.5 ± 0.2 |
| Dimethyl 18:1n9 (dm18:1n9) | 5.4 ± 0.4 | 4.3 ± 0.3 | 4.2 ± 0.2** |
Data are shown in nmol/g, mean ± SEM.
P < 0.05.
P < 0.01.
P < 0.001 versus control.
Among the lipid classes measured, DAG (normal versus NAFL versus NASH, nmol/g of sample: 50.5 ± 3.4 versus 75 ± 8.3 versus 70.2 ± 6.3,) and TAG (862.8 ± 53.5 versus 1868.6 ± 291.3 versus 1203.4 ± 62) were significantly increased in subjects with NAFL and NASH compared with normals (P < 0.01 for both), similar to the hepatic lipidomic profile as noted previously.12 The levels of FFA, lysophosphatidylcholine (LyPC), PC, PE, sphingomyelin, and cholesterol ester were not significantly different between the three study groups.
Changes in Circulating FFAs
As expected, palmitic (16:0), stearic (18:0), and oleic (18:1 n9) acids were the major constituents of the circulating FFA pool. The levels of these were not significantly different across the three groups (Supporting Table 1). However, there was a progressive increase in palmitoleic (16:1 n7) and vaccenic (18:1 n7) acids from normal to NAFL to NASH, which reached significance for vaccenic (18:1 n7) acid, the elongation product of palmitoleic (16:1 n7) acid, in both NAFL and NASH (Fig. 1). Palmitoleic acid (16:1 n7) was significantly increased in NASH alone (Fig. 1B).
Fig. 1.
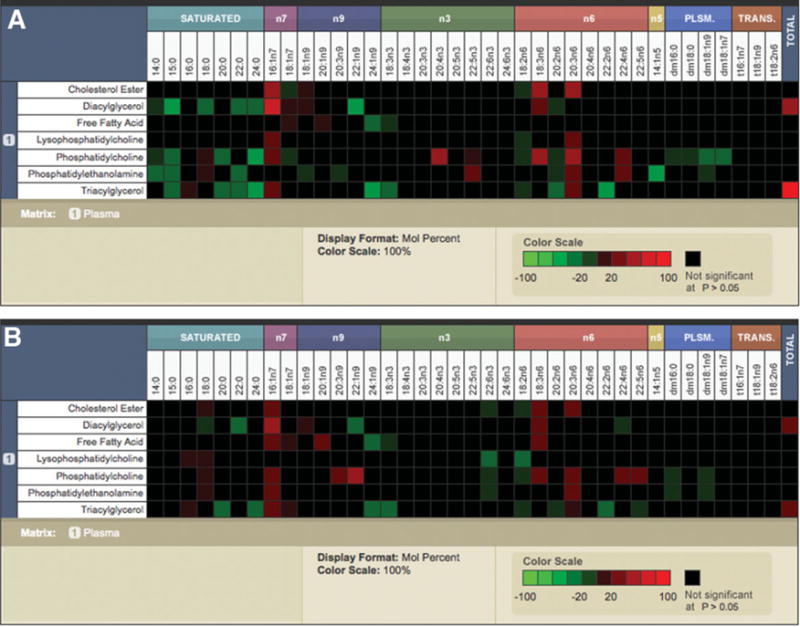
The surveyor heat maps demonstrate the distribution of different fatty acids (shown in columns) within individual lipid classes (shown in rows) displayed as mole percent data. The significant increases are displayed in red, and significant decreases are shown in green. The fatty acid composition without a significant change is indicated in black. Comparisons of NAFL versus normal (A) and NASH versus normal (B) are shown. Trans-fatty acids were not measured. The key to fatty acids: myristic acid (14:0), pentadecanoic acid (15:0), palmitic acid (16:0), stearic acid (18:0), arachidic acid (20:0), behenic acid (22:0), lignoceric acid (24:0), myristoleic acid (14:1n5), palmitoleic acid (16:1n7), vaccenic acid (18:1n7), oleic acid (18:1n9), eicosanoic acid (20:1n9), mead acid (20:3n9), erucic acid (22:1n9), nervonic acid (24:1n9), linoleic acid (18:2n6), γ-linolenic acid (18:3n6), eicosadienoic acid (20:2n6), Homo-γ-linolenic acid (20:3n6), arachidonic acid (20:4n6), docosadienoic acid (22:2n6), adrenic acid (22:4n6), docosapentaenoic acid (22:5n6), α-linolenic acid (18:3n3), stearidonic acid (18:4n3), eicosatrienoic acid (20:3n3), eicosatetraenoic acid (20:4n3), eicosapentaenoic acid (20:5n3), docosapentaenoic acid (22:5n3), docosahexaenoic acid (22:6n3), tetracosahexaenoic acid (24:6n3), dimethyl 16:0 (dm16:0), dimethyl 18:0 (dm18:0), dimethyl 18:1n7 (dm18:1n7), dimethyl 18:1n9 (dm18:1n9).
Changes in Fatty Acid Composition of DAG and TAG
The principal fatty acids that constituted the DAG and TAG pools in all three groups were palmitic (16:0), stearic (18:0), and oleic (18:1 n9) acids. As noted for the FFA pool, the palmitoleic (16:1 n7) levels were increased significantly in both NAFL and NASH in DAG without a significant change in the level of its precursor palmitic acid (16:0) (Fig. 1). There was also a significant decrease in stearic acid (18:0) levels and a concomitant increase in its downstream product oleic (18:1 n9) in the Δ9 steroyl CoA desaturase (SCD) pathway, within DAG in both NAFL and NASH. Simultaneously, the elongation products of stearic (18:0) acid such as arachidonic (20:0), behenic (22:0), and lignoceric (24:0) acids were decreased but reached statistical significance only for lignoceric acid (24:0) for NAFL and behenic acid (22:0) for both NAFL and NASH. Qualitatively similar patterns were also seen within the TAG pool (Fig. 1).
Changes in Fatty Acid Composition of Circulating Phospholipids
The major fatty acid constituents within PC, PE, and LyPC were also palmitic (16:0), stearic (18:0), and oleic (18:1n9) acids. The general increase in monounsaturated fatty acids seen in the FFA, TAG, and DAG pools were also seen within phospholipids. Once again, the palmitoleic acid (16:1 n7) levels were increased in PC in both NAFL and NASH, whereas palmitic acid (16:0) levels did not differ significantly compared with normals (Fig. 1). However, in contrast to DAG, the stearic acid (18:0) content of PC was significantly increased in both NAFL and NASH. A qualitatively similar trend was seen in PE and LyPC as well. Within phospholipid classes, especially PC, the stearic (18:0) acid to palmitic (16:0) acid ratio was significantly increased in NASH (0.45 ± 0.008 versus 0.49 ± 0.01 versus 0.51 ± 0.01, P = 0.0008 NASH versus normal).
Changes in Monounsaturated Fatty Acids Across Lipid Classes
The palmitoleic acid (16:1 n7) to palmitic acid (16:0) ratio, reflective of Δ 9 SCD activity,21 was increased in NAFL and NASH across multiple lipid classes (Fig. 2A). Delta 9 SCD also catalyzes the conversion of stearic acid (18:0) to oleic acid (18:1 n9). When the data were integrated across all lipid classes (Fig. 2B, C), there was also a significant increase in oleic acid (18:1 n9) levels, further supporting increased Δ 9 SCD activity. Simultaneously, the downstream products of stearic acid (18:0) along the long chain elongase pathway were decreased (NAFL) or unchanged (NASH), suggesting greater movement of stearate along the Δ 9 SCD rather than the elongase pathway.
Fig. 2.
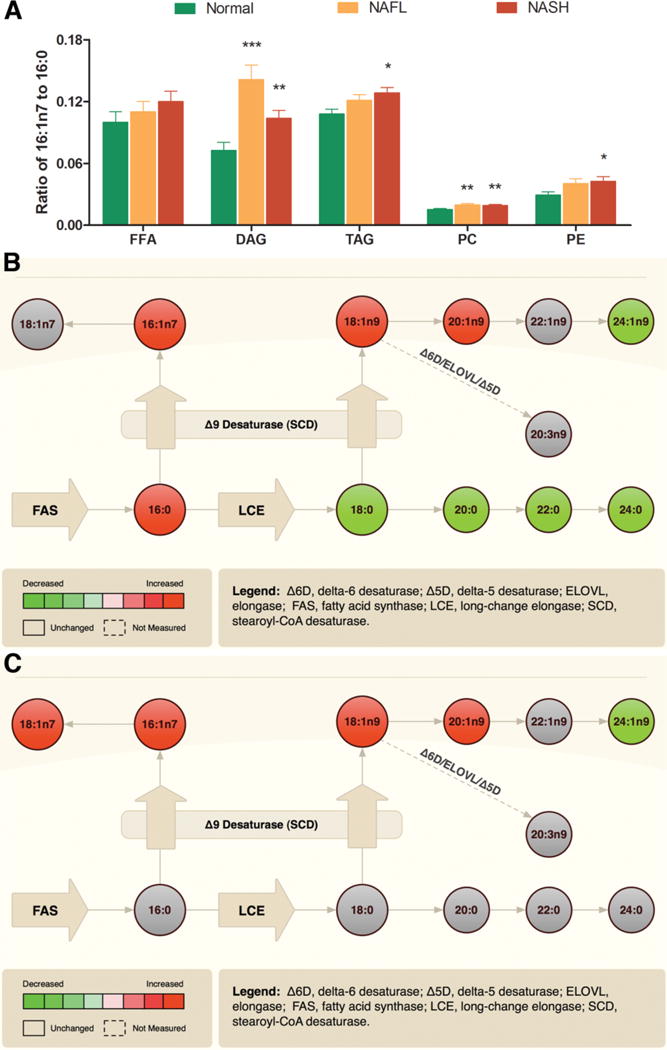
NAFLD is associated with increased de novo lipogenesis. (A) Significantly increased palmitoleic acid (16:1n7) to palmitic acid (16:0) ratio in several lipid classes among subjects with NAFLD. A composite fatty acid methyl ester data from all lipid classes reflective of monounsaturated fatty acids metabolism is displayed as pathway maps. The activity of stearoyl CoA desaturase (Δ9 SCD) and other enzymes are displayed showing comparisons of NAFL versus normal (B) and NASH versus normal (C), respectively. The significant increases are displayed in red, and significant decreases are shown in green. The nonsignificant changes are shown in gray. The key to individual acids is as described in Fig. 1. Data in bar graph expressed as means ± SEM. *P < 0.05; **P < 0.01; ***P < 0.001 versus normal.
Changes in Circulating Polyunsaturated Fatty Acids
There was a progressive stepwise decrease in total n3 and n6 PUFA content (mol%) across most lipid classes (FFA, TAG, PC, LyPC). However, the total n6:n3 ratio was not significantly changed in either NAFL or NASH (11.25 ± 0.44 versus 10.92 ± 0.51 versus 12.19 ± 0.47, P = 0.15). The n6:n3 ratio was increased in FFA, TAG, PC, and PE in NASH compared with normal controls, which reached significance only in PE (4 ± 0.18 versus 4.14 ± 0.23 versus 4.94 ± 0.24, P = 0.01 NASH versus normals).
Linoleic (18:2n6) and α-linolenic (18:3n3) acids are essential PUFA and the starting substrates of n6 and n3 PUFA metabolism, respectively.22 The linoleic acid (18: 2n6) content was markedly decreased (P < 0.05) in several lipid classes, which was most noticeable in NASH (Figs. 1 and 3A, B). Gamma-linolenic (18:3n6) and dihomo γ-linolenic (20:3n6) acids, the downstream metabolites of linoleic acid (18:2n6), were considerably increased (P < 0.001 for most lipid classes) in subjects with both NAFL and NASH, suggestive of increased Δ 6 desaturase (Δ6DS) activity (Fig. 3A, B). This resulted in an increase in γ-linolenic acid (18:3 n6) to linoleic acid (18:2 n6) ratio across several lipid classes, reaching statistical significance in the FFA and PC pools in NASH (Fig. 3C). These changes were even more prominent with dihomo γ-linolenic acid (20:3n6). Although these metabolites were significantly increased, its downstream product arachidonic acid (AA, 20:4n6) remained largely unchanged or decreased (Figs. 1 and 3A, B).
Fig. 3.
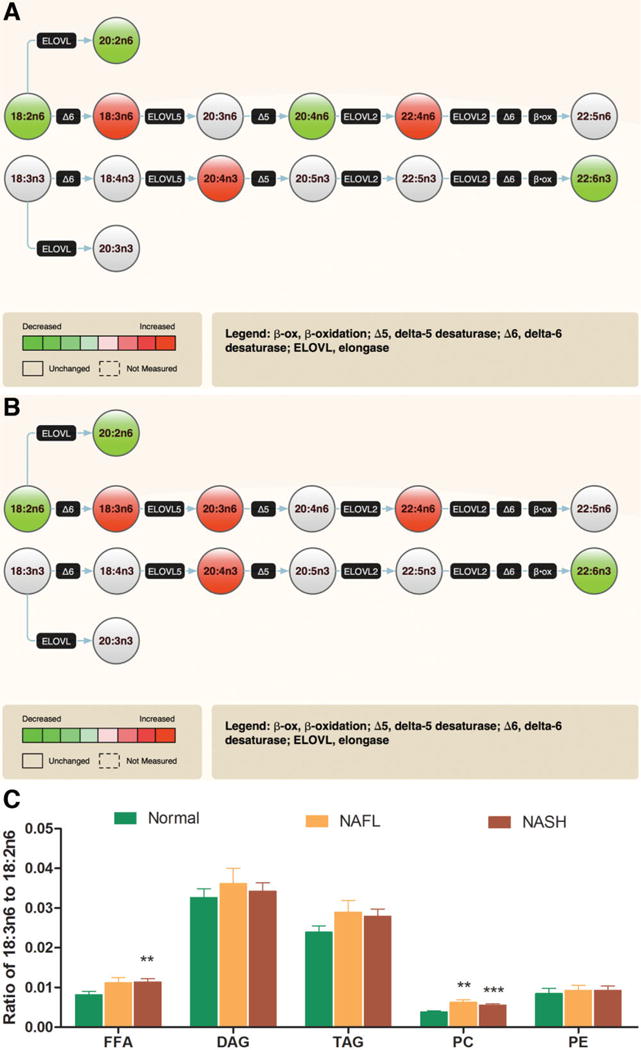
NAFLD is associated with increased Δ 6 desaturase activity. The composite fatty acid methyl esters data from all lipid classes reflective of polyunsaturated fatty acid (PUFA) metabolism is displayed as pathway maps (A: NAFL versus Normal, and B: NASH versus normal). Significant changes are shown as red for increase or green for decrease; gray color reflects no significant change. (C) A generalized trend is seen for an increase in γ-linolenic acid (GLA, 18:3n6) to linoleic acid (18:2n6) ratios with significant changes in free fatty acid (FFA) and phosphatidylcholine (PC) pools. This is indicative of increased Δ 6 desaturase (Δ6DS) activity, which is also reflected in (A) and (B),1 with increased product (GLA) shown as red and decreased precursor (linoleic acid) shown as green. In addition to changes in other fatty acids, the concentration of docosahexaenoic acid (DHA, 22:6n3) is also decreased in both NAFL (A) and NASH (B). Data in bar graph expressed as means ± SEM. *P < 0.05; **P < 0.01; ***P < 0.001 versus normal.
The amount of α-linolenic acid (18:3n3), an essential n3 PUFA, within some lipid classes was significantly decreased (Fig. 1). Docosapentaenoic acid (DPA, 22:5n3), which is further downstream in the n3 pathway, was significantly increased in NAFL within PC and PE lipid classes (P < 0.05 versus normal) (Fig. 1) and approached significance in subjects with NASH. DPA (22:5 n3) is largely metabolized to docosahexanoic acid (DHA, 22:6 n3) by oxidation and chain reduction in peroxisomes.23,24 Although there was a trend for increased DPA content in several lipid classes in both NAFL and NASH, the levels of its downstream product DHA were decreased, resulting in a decreased DHA:DPA ratio suggestive of peroxisomal dysfunction most marked in NASH (Fig. 4A).
Fig. 4.
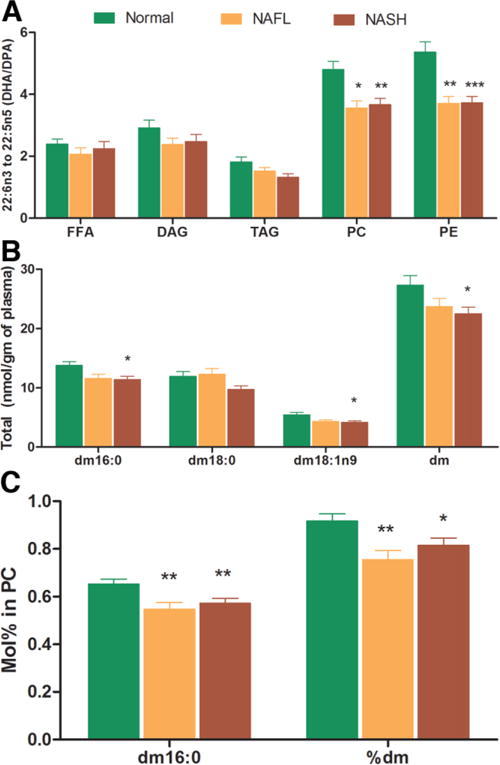
NAFLD is associated with peroxisomal dysfunction. The docosahexaenoic acid (DHA, 22:6n3) to docosapentaenoic acid (DPA, 22: 5n3) ratio among different lipid classes and changes in plasmalogen levels are represented graphically. There is a generalized trend for decrease in DHA:DPA ratio, which was significant for phosphatidylcholine (PC) and phosphatidylethanolamine (PE) pools (A). Similarly, there was a stepwise decrease in plasmalogen levels (nmol/g of sample) from normal to NAFL to NASH that was statistically significant for total plasmalogen (dm), dm 16:0, and dm 18:1n9 content in NASH only (B). The plasmalogen concentration within lipid classes (mol%) was significantly decreased for dm and dm16:0 within PC pool in NAFLD (C). These figures suggest that NAFLD is associated with peroxisomal dysfunction, which is most marked in NASH. Data expressed as means ± SEM. *P < 0.05; **P < 0.01; ***P < 0.001 versus normal.
Changes in Circulating Plasmalogens
The total plasmalogen (dm) and dm16:0 levels (nmol/g sample) decreased in a stepwise manner from normal to NAFL to NASH, which was most pronounced for NASH (P < 0.05 for dm and dm16:0 versus normal) (Fig. 4b). Whereas the plasmalogen dm16:0 was significantly decreased within the PC pool in both NAFL and NASH (P < 0.01 versus normal) (Fig. 4C), there was a trend for a decrease for other plasmalogens (dm 18:0, dm 18:1 n9) in both PC and PE. These data further suggest the presence of peroxisomal dysfunction, particularly in NASH.
Changes in Plasma Inflammatory Metabolites of Arachidonic Acid (AA, 20:4n6)
The levels of cycloxygenase (COX) and lipoxygenase (LOX) products of AA (20:4 n6) in circulation were measured next. The plasma levels of COX products of AA (prostaglandin [PG]-M, PGB2, PGD2, PGE2, PGF2α, and thromboxane A2) were not significantly different across the three study groups. In sharp contrast, many of the products of the LOX pathway were significantly higher in NASH patients in comparison with the NAFL or normal group (Fig. 5A–C). Specifically, the levels of 5-HETE, 8-HETE, and 15-HETE were markedly elevated in those with NASH relative to the lean normal control subjects. Of note, although 15-HETE, a pro-inflammatory product of 15-LOX, was significantly increased in NASH, the levels of lipoxin A4, an anti-inflammatory product of 15-LOX, were not increased in NASH. Also, the levels of 11-HETE, a nonenzymatic oxidation product of arachidonic acid (20:4 n6), were significantly increased in NASH only (Fig. 5D).
Fig. 5.
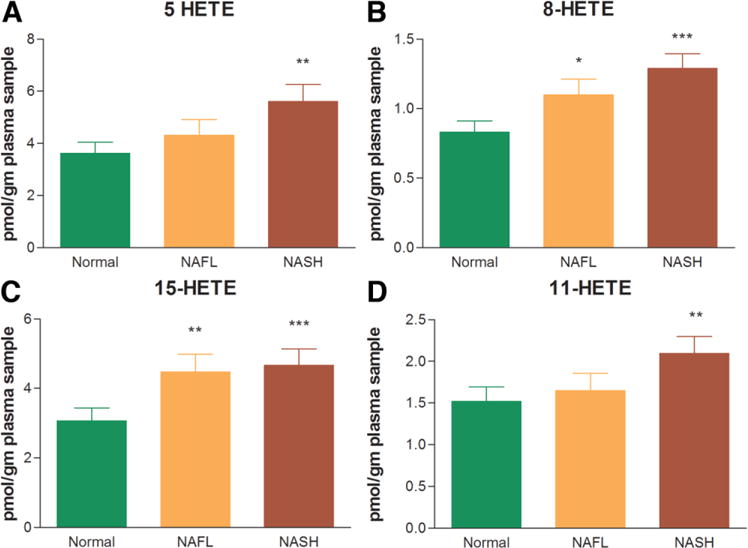
The eicosanoid metabolites of the lipoxygenase pathway. The levels of 5(S)-hydroxyeicosatetraenoic acid (5-HETE), 8-HETE, and 15-HETE (A-C) increased in a stepwise manner from normal to NAFL to NASH. These were markedly elevated in those with NASH relative to the lean normal control subjects. The levels of 11-HETE, a non-enzymatic oxidation product of arachidonic (20:4 n6) acid, was also significantly increased in NASH only (D). Data expressed as means ± SEM. *P < 0.05; **P < 0.01; ***P < 0.001 versus normal.
Discussion
Metabolomics represent a powerful approach to obtain a comprehensive picture of the state of metabolic pathways in specific disease states. It is important to note, however, that metabolomic studies, by their nature, provide only a snapshot of the changes in the metabolic state. Also, studies of the circulating lipid metabolome do not provide direct information about changes in the liver. However, these caveats notwithstanding, this analysis of the circulating lipidome provides several novel and valuable insights into the state of whole-body lipid metabolism, as seen in this study for subjects with NAFL and NASH.
Not surprisingly, as noted previously in the lipidomic profile of the liver,12 there was evidence of increased lipogenesis in NAFL and NASH, such as the increase in monounsaturated fatty acid:saturated fatty acids ratio across multiple lipid classes. Specifically, the increments in palmitoleic acid (16:1 n7) and its downstream product vaccenic acid (18:1 n7) suggest increased activity of the Δ 9 SCD (Figs. 1 and 2C), a sterol regulatory element binding protein-1c target.25–27 This is further corroborated by the significant increase in palmitoleic acid (16:1n7): palmitic acid (16:0), and oleic acid (18:1n9):stearic acid (18:0) ratios in NAFL and NASH along with unchanged or decreased levels of downstream metabolites (arichidenic [20:0], behenic [22:0], and lignoceric [24:0] acids) along the long chain fatty acid elongase pathway (Fig. 2C).
Most of the literature has focused on the lipotoxic properties of FFAs8–10; however, recent studies indicate that FFAs can have varied cellular and metabolic effects. For example, although stearic (18:0) acid is more cytotoxic than palmitic (16:0) acid, palmitoleic (16:1 n7) acid reverses the insulin resistance promoted by palmitic (16:0) acid.9,28 If so, the lower stearic (18:0) acid and higher palmitoleic (16:1 n7) acid in NAFL and NASH may represent an adaptive response to fatty acid overload. Increased lipogenesis and TAG synthesis also have been shown to protect hepatocytes from injury in the db/db mouse model.29 Cumulatively, these data indicate that the body adapts to systemic lipid overload by increased lipogenesis and altered FFA metabolism, which have a relative but insufficiently protective effect against lipotoxicity.
The significant decrease in the circulating levels of the essential fatty acids linoleic acid (18:2 n6) and ALA (18:3 n3) is noteworthy. This is unlikely to represent a dietary essential fatty acid deficiency because mead acid (20:3 n9) levels were largely unchanged. Mead acid (20:3 n9) is derived from oleic acid (18:1n9) by the actions of Δ6 desaturase, which usually uses linoleic acid (18:2 n6) or α-linolenic acid (18:3 n3) as its natural substrate.30 Moreover, dietary essential fatty acid deficiency is rare in the Western world. We therefore interpret these data to indicate increased utilization of the essential fatty acids by Δ6 desaturase as evidenced by increased levels of its downstream metabolites (Fig. 3A, B).
Interestingly, although the levels of precursor PUFAs were increased, the arachidonic acid (20:4 n6) levels were unchanged or decreased (Fig. 3A, B). This probably reflects utilization of arachidonic acid (20:4 n6) as indicated by increased levels of adrenic acid (22:4n6) and eicosanoid metabolites. This is in contrast to changes previously noted in the liver of subjects with NASH, where there was a general depletion of arachidonic (20:4 n6) acid across several lipid classes.12 The potential implications of these findings remain to be defined.
Another novel finding of potential pathophysiological importance is evidence of systemic LOX rather than COX activation in this study. Although the products of COX activation were not significantly altered, there was an increase in products of 5-LOX, 8-LOX, and 15-LOX that were maximal in subjects with NASH. Importantly, the antiinflammatory lipoxin product of 15-LOX was not increased, although the pro-inflammatory product 15-HETE was significantly increased. NASH also was associated with an increase in levels of 11-HETE, a nonenzymatic oxidation product of arachidonic acid (20:4 n6). These findings may have major implications in understanding the pro-inflammatory state associated with NAFLD and the increased vascular disease associated with NASH.31–33 In the absence of an obese, insulin-resistant group without NAFLD, it is, however, not possible to determine whether these changes reflect the underlying insulin-resistant state or the liver disease.
The decline in DHA (22:6 n3) acid is also of potential importance. DHA (22:6 n3) is formed in peroxisomes from DPA (22:5 n3).23,24 The increase in DPA with decreases in DHA suggest impaired peroxisomal PUFA metabolism, which is maximal in subjects with NASH. In a small pilot study of the hepatic lipidomic profile in subjects with NASH, a similar trend was also present.12 The concept of a impaired peroxisomal PUFA metabolism in humans with NASH is further corroborated by the decreased plasmalogen levels noted in this study.34 These findings provide impetus to future studies of the role of peroxisomal dysfunction in the pathogenesis of NASH.
Taken together, these data indicate that the development of NAFL is accompanied by increased lipogenesis, Δ9 desaturase, and LOX activity (Fig. 6). With progression to NASH, the lipogenic activity levels off or declines modestly, whereas the LOX activity increases. Simultaneously, there is impaired peroxisomal PUFA metabolism and an increase in levels of products of nonenzymatic oxidation of arachidonic acid (20:4).
Fig. 6.
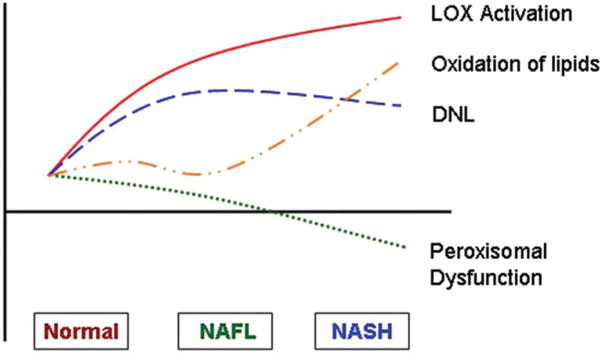
The proposed model of “circulating lipidome” in human NAFL and NASH. The development of NAFL is accompanied by increased de novo lipogenesis (DNL), Δ6 desaturase, and lipoxygenase (LOX) activity. With progression to NASH, the lipogenic activity levels off or declines modestly while the LOX activity increases. Simultaneously, there is a decrease in peroxisomal function and increase in levels of products of nonenzymatic oxidation of arachidonic (20:4n6) acid.
In this particular study, the control group was younger than subjects with NAFL or NASH. Also, the male-to-female ratios varied from the NAFL group to the NASH group. These, along with BMI, ethnicity, and diet, could potentially influence the findings of this study. It is worth noting, however, that there are no published data indicating that age alone affects the specific lipid metabolic pathways found to have been altered in NAFL and NASH. Moreover, there are no known sex-based differences in routinely used clinical lipid profiles or in pathways of lipogenesis. Also, we did not find any sex-based differences within the study groups with respect to the major findings of this study (data not shown). The potential role of these factors, including dietary intake, now need to be elucidated in adequately powered and specifically designed studies.
In summary, NAFLD is associated with several changes in the circulating lipidome. Although the current study and our model of “whole body” changes in lipid metabolism in NAFL and NASH (Fig. 6) do not provide direct information on what is happening in the liver, they do provide the most comprehensive picture of the state of lipid metabolism at a “whole body” level in NAFLD. They also provide information that can serve as the basis for future hypothesis-driven studies of the role of specific metabolic pathways in the genesis and progression of NASH.
Supplementary Material
Acknowledgments
Supported by the following grants from the National Institutes of Health to A.J.S.: K24 DK 02755-06, T32 DK 07150-31, and RO1 56331-05.
Abbreviations
- AA
arachidonic acid
- COX
cyclooxygenase
- DAG
diacylglycerol
- DPA
docosapentaenoic acid
- EDTA
ethylenediaminetetra-acetic acid
- FFA
free fatty acid
- HETE
hydroxyeicosatetraenoic acid
- LOX
lipoxygenase
- LyPC
lysophosphatidylcholine
- NAFL
nonalcoholic fatty liver
- NAFLD
nonalcoholic fatty liver disease
- NASH
nonalcoholic steatohepatitis
- PC
phosphatidylcholine
- PE
phosphatidylethanolamine
- PG
prostaglandin
- PUFA
polyunsaturated fatty acid
- SCD
stearoyl-CoA desaturase
- SEM
standard error of the mean
- TAG
triacylglycerol
- TLC
thin-layer chromatography
Footnotes
Additional Supporting Information may be found in the online version of this article.
Presented in part at the annual meeting of the American Association for Study of Liver Diseases (AASLD) in Boston, 2007.
Potential conflict of interest: Dr. Wiest is a consultant for and Dr. Watkins owns stock in Lipomics.
References
- 1.Browning JD, Szczepaniak LS, Dobbins R, Nuremberg P, Horton JD, Cohen JC, et al. Prevalence of hepatic steatosis in an urban population in the United States: impact of ethnicity. Hepatology. 2004;40:1387–1395. doi: 10.1002/hep.20466. [DOI] [PubMed] [Google Scholar]
- 2.Contos MJ, Sanyal AJ. The clinicopathologic spectrum and management of nonalcoholic fatty liver disease. Adv Anat Pathol. 2002;9:37–51. doi: 10.1097/00125480-200201000-00005. [DOI] [PubMed] [Google Scholar]
- 3.Ekstedt M, Franzen LE, Mathiesen UL, Thorelius L, Holmqvist M, Bodemar G, et al. Long-term follow-up of patients with NAFLD and elevated liver enzymes. Hepatology. 2006;44:865–873. doi: 10.1002/hep.21327. [DOI] [PubMed] [Google Scholar]
- 4.Ludwig J, Viggiano TR, McGill DB, Oh BJ. Nonalcoholic steatohepatitis: Mayo Clinic experiences with a hitherto unnamed disease. Mayo Clin Proc. 1980;55:434–438. [PubMed] [Google Scholar]
- 5.Sanyal AJ, Campbell-Sargent C, Mirshahi F, Rizzo WB, Contos MJ, Sterling RK, et al. Nonalcoholic steatohepatitis: association of insulin resistance and mitochondrial abnormalities. Gastroenterology. 2001;120:1183–1192. doi: 10.1053/gast.2001.23256. [DOI] [PubMed] [Google Scholar]
- 6.Chitturi S, Abeygunasekera S, Farrell GC, Holmes-Walker J, Hui JM, Fung C, et al. NASH and insulin resistance: Insulin hypersecretion and specific association with the insulin resistance syndrome. Hepatology. 2002;35:373–379. doi: 10.1053/jhep.2002.30692. [DOI] [PubMed] [Google Scholar]
- 7.Saltiel AR, Kahn CR. Insulin signalling and the regulation of glucose and lipid metabolism. Nature. 2001;414:799–806. doi: 10.1038/414799a. [DOI] [PubMed] [Google Scholar]
- 8.Feldstein AE, Werneburg NW, Canbay A, Guicciardi ME, Bronk SF, Rydzewski R, et al. Free fatty acids promote hepatic lipotoxicity by stimulating TNF-alpha expression via a lysosomal pathway. Hepatology. 2004;40:185–194. doi: 10.1002/hep.20283. [DOI] [PubMed] [Google Scholar]
- 9.Malhi H, Bronk SF, Werneburg NW, Gores GJ. Free fatty acids induce JNK-dependent hepatocyte lipoapoptosis. J Biol Chem. 2006;281:12093–12101. doi: 10.1074/jbc.M510660200. [DOI] [PubMed] [Google Scholar]
- 10.Li Z, Berk M, McIntyre TM, Gores GJ, Feldstein AE. The lysosomal-mitochondrial axis in free fatty acid-induced hepatic lipotoxicity. Hepatology. 2008;47:1495–1503. doi: 10.1002/hep.22183. [DOI] [PMC free article] [PubMed] [Google Scholar]
- 11.Neuschwander-Tetri BA, Caldwell SH. Nonalcoholic steatohepatitis: summary of an AASLD Single Topic Conference. Hepatology. 2003;37:1202–1219. doi: 10.1053/jhep.2003.50193. [DOI] [PubMed] [Google Scholar]
- 12.Puri P, Baillie RA, Wiest MM, Mirshahi F, Choudhury J, Cheung O, et al. A lipidomic analysis of nonalcoholic fatty liver disease. Hepatology. 2007;46:1081–1090. doi: 10.1002/hep.21763. [DOI] [PubMed] [Google Scholar]
- 13.Araya J, Rodrigo R, Videla LA, Thielemann L, Orellana M, Pettinelli P, et al. Increase in long-chain polyunsaturated fatty acid n-6/n-3 ratio in relation to hepatic steatosis in patients with non-alcoholic fatty liver disease. Clin Sci (Lond) 2004;106:635–643. doi: 10.1042/CS20030326. [DOI] [PubMed] [Google Scholar]
- 14.Executive summary of the third report of the National Cholesterol Education Program (NCEP) Expert Panel on Detection, Evaluation, and Treatment of High Blood Cholesterol in Adults (Adult Treatment Panel III) JAMA. 2001;285:2486–2497. doi: 10.1001/jama.285.19.2486. [DOI] [PubMed] [Google Scholar]
- 15.Kleiner DE, Brunt EM, Van Natta M, Behling C, Contos MJ, Cummings OW, et al. Design and validation of a histological scoring system for nonalcoholic fatty liver disease. Hepatology. 2005;41:1313–1321. doi: 10.1002/hep.20701. [DOI] [PubMed] [Google Scholar]
- 16.Watkins SM, Reifsnyder PR, Pan HJ, German JB, Leiter EH. Lipid metabolome-wide effects of the PPARgamma agonist rosiglitazone. J Lipid Res. 2002;43:1809–1817. doi: 10.1194/jlr.m200169-jlr200. [DOI] [PubMed] [Google Scholar]
- 17.Folch J, Lees M, Sloane Stanley GH. A simple method for the isolation and purification of total lipides from animal tissues. J Biol Chem. 1957;226:497–509. [PubMed] [Google Scholar]
- 18.Watkins SM, Lin TY, Davis RM, Ching JR, DePeters EJ, Halpern GM, et al. Unique phospholipid metabolism in mouse heart in response to dietary docosahexaenoic or alpha-linolenic acids. Lipids. 2001;36:247–254. doi: 10.1007/s11745-001-0714-8. [DOI] [PubMed] [Google Scholar]
- 19.Ruiz JI, Ochoa B. Quantification in the subnanomolar range of phospholipids and neutral lipids by monodimensional thin-layer chromatography and image analysis. J Lipid Res. 1997;38:1482–1489. [PubMed] [Google Scholar]
- 20.Mangold H. Thin-Layer Chromatography: A Laboratory Handbook. New York, NY: Springer-Verlag; 1969. pp. 11–25. [Google Scholar]
- 21.Ntambi JM, Miyazaki M. Regulation of stearoyl-CoA desaturases and role in metabolism. Prog Lipid Res. 2004;43:91–104. doi: 10.1016/s0163-7827(03)00039-0. [DOI] [PubMed] [Google Scholar]
- 22.Lee S, Gura KM, Kim S, Arsenault DA, Bistrian BR, Puder M. Current clinical applications of omega-6 and omega-3 fatty acids. Nutr Clin Pract. 2006;21:323–341. doi: 10.1177/0115426506021004323. [DOI] [PubMed] [Google Scholar]
- 23.Luthria DL, Mohammed BS, Sprecher H. Regulation of the biosynthesis of 4,7,10,13,16,19-docosahexaenoic acid. J Biol Chem. 1996;271:16020–16025. doi: 10.1074/jbc.271.27.16020. [DOI] [PubMed] [Google Scholar]
- 24.Ferdinandusse S, Denis S, Mooijer PA, Zhang Z, Reddy JK, Spector AA, et al. Identification of the peroxisomal beta-oxidation enzymes involved in the biosynthesis of docosahexaenoic acid. J Lipid Res. 2001;42:1987–1995. [PubMed] [Google Scholar]
- 25.Bene H, Lasky D, Ntambi JM. Cloning and characterization of the human stearoyl-CoA desaturase gene promoter: transcriptional activation by sterol regulatory element binding protein and repression by polyunsaturated fatty acids and cholesterol. Biochem Biophys Res Commun. 2001;284:1194–1198. doi: 10.1006/bbrc.2001.5102. [DOI] [PubMed] [Google Scholar]
- 26.Moon YA, Shah NA, Mohapatra S, Warrington JA, Horton JD. Identification of a mammalian long chain fatty acyl elongase regulated by sterol regulatory element-binding proteins. J Biol Chem. 2001;276:45358–45366. doi: 10.1074/jbc.M108413200. [DOI] [PubMed] [Google Scholar]
- 27.Horton JD, Goldstein JL, Brown MS. SREBPs: activators of the complete program of cholesterol and fatty acid synthesis in the liver. J Clin Invest. 2002;109:1125–1131. doi: 10.1172/JCI15593. [DOI] [PMC free article] [PubMed] [Google Scholar]
- 28.Cao H, Gerhold K, Mayers JR, Wiest MM, Watkins SM, Hotamisligil GS. Identification of a lipokine, a lipid hormone linking adipose tissue to systemic metabolism. Cell. 2008;134:933–944. doi: 10.1016/j.cell.2008.07.048. [DOI] [PMC free article] [PubMed] [Google Scholar]
- 29.Yamaguchi K, Yang L, McCall S, Huang J, Yu XX, Pandey SK, et al. Inhibiting triglyceride synthesis improves hepatic steatosis but exacerbates liver damage and fibrosis in obese mice with nonalcoholic steatohepatitis. Hepatology. 2007;45:1366–1374. doi: 10.1002/hep.21655. [DOI] [PubMed] [Google Scholar]
- 30.Holman RT. The ratio of trienoic: tetraenoic acids in tissue lipids as a measure of essential fatty acid requirement. J Nutr. 1960;70:405–410. doi: 10.1093/jn/70.3.405. [DOI] [PubMed] [Google Scholar]
- 31.Targher G, Bertolini L, Padovani R, Zenari L, Zoppini G, Falezza G. Relation of nonalcoholic hepatic steatosis to early carotid atherosclerosis in healthy men: role of visceral fat accumulation. Diabetes Care. 2004;27:2498–2500. doi: 10.2337/diacare.27.10.2498. [DOI] [PubMed] [Google Scholar]
- 32.Villanova N, Moscatiello S, Ramilli S, Bugianesi E, Magalotti D, Vanni E, et al. Endothelial dysfunction and cardiovascular risk profile in nonalcoholic fatty liver disease. Hepatology. 2005;42:473–480. doi: 10.1002/hep.20781. [DOI] [PubMed] [Google Scholar]
- 33.Schwimmer JB, Pardee PE, Lavine JE, Blumkin AK, Cook S. Cardiovascular risk factors and the metabolic syndrome in pediatric nonalcoholic fatty liver disease. Circulation. 2008;118:277–283. doi: 10.1161/CIRCULATIONAHA.107.739920. [DOI] [PMC free article] [PubMed] [Google Scholar]
- 34.Nagura M, Saito M, Iwamori M, Sakakihara Y, Igarashi T. Alterations of fatty acid metabolism and membrane fluidity in peroxisome-defective mutant ZP102 cells. Lipids. 2004;39:43–50. doi: 10.1007/s11745-004-1200-z. [DOI] [PubMed] [Google Scholar]
Associated Data
This section collects any data citations, data availability statements, or supplementary materials included in this article.