Abstract
Purpose
To assess inter-platform reproducibility of liver stiffness (LS) and spleen stiffness (SS) measured with MR elastography (MRE) based on a 2D GRE sequence.
Materials and Methods
This prospective HIPAA-compliant and IRB-approved study involved 12 subjects (5 healthy volunteers and 7 patients with liver disease). A multi-slice 2D-GRE-based MRE sequence was performed using two systems from different vendors (3.0T GE and 1.5T Siemens) on the same day. Two independent observers measured LS and SS on confidence maps. Bland-Altman analysis (with coefficient of reproducibility, CR), coefficient of variability (CV) and intraclass correlation (ICC) were used to analyze inter-platform, intra- and inter-observer variability. Human data was validated using a gelatin-based phantom.
Results
There was excellent reproducibility of phantom stiffness measurement (CV 4.4%). Mean LS values were 3.44–3.48 kPa and 3.62–3.63 kPa, and mean SS values were 7.54–7.91 kPa and 8.40–8.85 kPa at 3.0T and 1.5T for observers 1 and 2, respectively. The mean CVs between platforms were 9.2%–11.5% and 13.1%–14.4% for LS and SS, respectively for observers 1 and 2. There was excellent inter-platform reproducibility (ICC >0.88 and CR <36.2%) for both LS and SS, and excellent intra- and inter-observer reproducibility (intra-observer: ICC >0.99, CV <2.1%, CR <6.6%; inter-observer: ICC >0.97, CV and CR <16%).
Conclusion
This study demonstrates that 2D-GRE MRE provides platform- and observer-independent LS and SS measurements.
Keywords: Magnetic Resonance Elastography, liver stiffness, spleen stiffness, inter-platform MRE
INTRODUCTION
Over the past years, elastography techniques have had an increasing and important role in liver fibrosis assessment. Ultrasound (US) elastography, particularly transient elastography, has been validated in large series for the diagnosis of advanced fibrosis and cirrhosis (1–5). MR elastography (MRE), an MRI-based quantitative shear wave elastography method, has also been shown to be an accurate method to stage liver fibrosis (6). Its additional benefit is that it allows a larger sampling compared to US techniques and liver biopsy. It has been suggested in few prior studies that MRE outperforms transient elastography and serum markers for liver fibrosis staging, with area under the ROC curve higher than 0.9 (7–9). Recent data also showed that elastography of liver and spleen could represent an accurate method for noninvasive detection of portal hypertension with both US and MRI techniques (10–15). The high accuracy of MRE for liver fibrosis staging and for evaluation of portal hypertension suggests that MRE could potentially replace or decrease the need for invasive tests such as liver biopsy for fibrosis staging and hepatic vein pressure gradient for portal hypertension assessment in the near future.
Measurement accuracy, reproducibility, and repeatability are important criteria in assessing the performance of quantitative imaging technologies. The accuracy of MRE-based stiffness measurements has been assessed in phantom studies using mechanical testing as a reference (16). Two recent studies have established that MRE has high test-retest repeatability (17,18) and high intra- and inter-observer reproducibility using the same system (18,19). Another aspect that would be desirable from a clinical standpoint would be the capability to obtain reproducible measurements across different MRI platforms as it is the case with most quantitative imaging technologies (www.rsna.org/QIBA.aspx).
MRI systems may be equipped for MRE by installing special driver hardware to generate low-frequency mechanical waves in the abdomen during imaging, a pulse sequence with cyclic motion encoding gradients to image the propagating waves, and software to automatically process the data to generate stiffness maps. Currently, the FDA-approved implementations of MRE available from MRI manufacturers use very similar driver hardware and pulse sequences and the same processing algorithm. Nevertheless, given the varying details of implementation, together with differences in MRI hardware, field strength, and acquisition parameters across different vendor platforms, it is important to define the extent of cross-platform reproducibility. A recent study by Serai et al. (20) examined the variability of liver stiffness (LS) estimations generated by two 1.5T systems from different vendors and showed that LS measurements obtained from the two systems gave consistent and reproducible results, with a difference in absolute value lower than 0.36 kPa. These results are expected because mechanical properties are supposed to be scanner independent. However, no published study has compared LS measurement between different field strengths or assessed the reproducibility of spleen stiffness (SS) measurements.
The objective of our study was to further contribute to our understanding of cross-platform reproducibility by comparing LS measurements obtained in a series of patients and volunteers using two different MRI systems from different manufacturers and with different field strengths. In addition, we wanted to assess the cross-platform reproducibility of SS measurements in the same cohort, given the potential value of this metric in the assessment of portal hypertension.
MATERIALS AND METHODS
MR Systems
For both phantom and human studies, MRE acquisitions were performed on a 3.0T system (called here system #1, GE Discovery MR750, GE Healthcare, Wausheeka, WI) and a 1.5T system (called here system #2, Magnetom Aera, Siemens Healthcare, Erlangen, Germany). System#1 used a phased array 32-channel body coil with 50 mT/m maximum gradient strength, while system#2 was equipped with a 32-channel spine and an 18-channel body coil with 45 mT/m maximum gradient strength.
Phantom Study
A phantom study was performed using a previously described setup (21). An analytical inversion model was used to independently calculate the shear stiffness of the phantom, for comparison with the stiffness maps provided by the imagers, which are also based on direct inversion of the wave equation.
✓ Phantom Setup
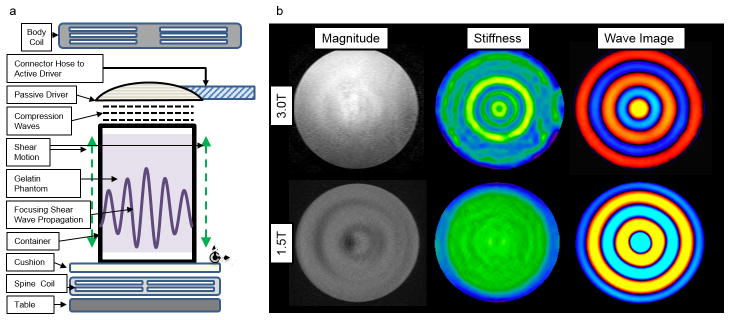
Phantom setup design was based on the study of Yasar et al. (22). Two thousand grams of 2% weight-in-weight gelatin sample was prepared by the procedure described in Clayton et al. (23) with water, and 200 grams of glycerol added to the mixture (in order to reduce the water loss from the gel). The clinical MRE hardware (Resoundant, Rochester, MN, USA) was used for mechanical actuation (Fig. 1). The passive driver was secured on top of the sample and it caused vertical motion on the container. Since the bottom and top surfaces of the gel were not in contact with the container, the only force inflicted on the gel was the shear force inflicted by the motion of the walls. These shear forces generate shear waves, which propagate concentrically and focus in the middle. This focusing shear wave pattern counteracts the damping and provides wave propagation with a closed form solution of 0th-order Bessel function of 1st kind (22).
Fig. 1.
a) Phantom setup for MRE shear wave analysis. b) Example of magnitude images, stiffness maps and wave images obtained from both scanners on gelatin phantom. The shear stiffness value of the phantom was 3.25 ± 0.61 kPa and 3.45 ± 0.47 kPa at 3.0T and 1.5T, respectively.
✓ In Vitro MRE Acquisition
The phantom was scanned on both scanners within a few hours interval, using similar MRE sequences and sequence parameters as those used for the in vivo setup (Table 1).
Table 1.
2D GRE sequence parameters used for MRE acquisition for both platforms.
| System # | 1 | 2 |
|---|---|---|
| TR (ms) | 50 | 50 |
| TE (ms) | 20 | 25 |
| Matrix | 256×80 | 256×90 |
| Number of slices | 4 | 4 |
| Slice thickness (mm) | 10 | 7 |
| MEG frequency (Hz) | 60 | 60 |
| Acceleration factor | ASSET 2 | GRAPPA 3 |
System #1: 3.0T GE Discovery MR750, system #2: 1.5T Siemens MAGNETOM Aera
MEG = motion-encoding gradient
ASSET = array spatial sensitivity encoding technique
GRAPPA = generalized autocalibrating partially parallel acquisition
Subjects
This prospective single-center study was HIPAA compliant, IRB approved, and funded by ------. Written informed consent was obtained from all subjects prior to the examination. Between June 2014 and March 2015, 12 subjects (M/F 8/4, mean age 35 y, range 22–61 y), including 5 healthy volunteers (M/F 3/2, mean age 30 y, range 26–37 y) and 7 patients with chronic liver disease (M/F 5/2, mean age 42 y, range 22–61 y) were enrolled. The etiologies of liver disease were chronic hepatitis C (n=2), primary sclerosing cholangitis (n=2), NASH (n=2), and alcohol abuse (n=1). All subjects underwent MRE on both scanners to assess liver and spleen stiffness (LS and SS) in fasting conditions to avoid postprandial biological changes (24).
MRI Acquisition
First, the subjects were examined on system#1. The second examination was performed on the same day on system #2 (mean delay between the 2 MRE examinations 90 ± 38 min). For all subjects, on system #1, only axial and coronal single-shot FSE T2-weighted images (T2WI) were acquired in addition to MRE. For patients, on system #2, the liver imaging protocol included single-shot FSE T2WI, FSE T2WI with fat suppression, dual-echo chemical-shift T1WI, multi-GRE T2* sequence, diffusion-weighted imaging, and DCE-MRI acquisition. For volunteers, the liver imaging protocol only included single-shot FSE T2WI and multi-GRE T2* sequence. All images were acquired in axial plane.
✓ MRE Acquisition
For both MRE acquisitions, a 2D-GRE sequence with parameters as similar as possible was used (Table 1). Two 19 cm-diameter passive acoustic drivers were placed both at the level of the xiphoid, one on the right side of the abdomen to measure LS (25) and the other one posteriorly to the left to measure SS. Four axial slices were centered over the portal vein for the liver acquisition and the splenic hilum for the spleen acquisition. Wave imaging was performed using a modified phase contrast gradient echo sequence with motion-encoding gradients along z-axis. The frequency of acoustic excitation was set to 60 Hz for both systems. For each scanner, all 4 slices were acquired in 4 consecutive breath holds at end expiration, with separate acquisitions for the liver and spleen, and with only the corresponding passive driver attached to the active driver. In patients, MRE was performed before intravenous contrast administration.
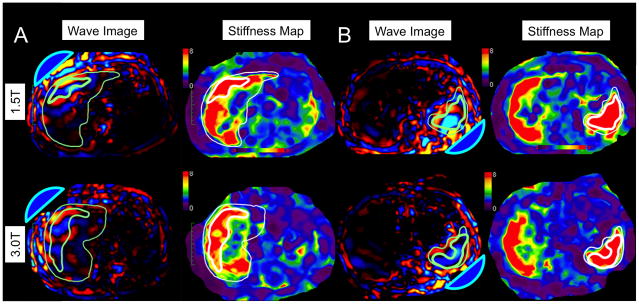
For processing the wave images, both systems used a scanner-hosted implementation of the multimodel direct inversion (MMDI) algorithm, a statistically-based direct inversion algorithm to automatically generate stiffness maps from wave images (Fig. 2) (26).
Fig. 2.
61-year-old male with chronic hepatitis C virus cirrhosis. Examples of wave patterns (with acoustic drivers represented as blue domes) and stiffness maps in a single-driver excitation: anteriorly for the liver (A) and posteriorly for the spleen (B). Thick contour borders the ROI and thin contour borders the organ. Liver stiffness was 6.85 kPa with system #1 and 7.69 kPa with system #2; spleen stiffness was 10.25 kPa with system #1 and 10.83 kPa with system #2. Note elevated liver and spleen stiffness consistent with cirrhosis and portal hypertension.
Image Analysis
✓ Phantom MRE Analysis
Out of each imaging slice, 18 linear profiles crossing the same center point were taken. Each profile was fitted into the analytical solution (0th-order Bessel function of 1st kind) by optimizing real part μR and imaginary part μI of the shear modulus (27) using Matlab software (Matlab, version 8.4.0, The Mathworks Inc, MA, USA). The values of the real part μR and imaginary part μI of the shear modulus in the phantom within each system were therefore computed. Amplitude, time offset, center offset and a wave propagation pattern with second-order polynomial form, which compensates for unwanted compression waves, are optimized to reduce the root mean square error calculated between linear profile and closed-form wave equation.
In addition to the analysis described above, a stiffness map, calculated using the inversion algorithm provided with the scanner software, was generated as in clinical cases (Fig. 1). A region of interest (ROI) was drawn by a single observer (observer 1, -- a physicist with 1 year of postdoctoral experience in MRE) in the middle slice, where the wave propagation pattern converges to a circular wave front. A circular wave front indicates that most of the mechanical motion aligns with the motion-encoding direction, which yields the most homogeneous stiffness map in return.
✓ In Vivo Data
MRE analysis was performed by two independent observers using Osirix software (v 5.5.2, Geneva, Switzerland): observer 1 and observer 2 (--, a radiologist with 3 years of postdoctoral body MRI experience). Observer 2 performed the analysis of all subjects twice, with 4 weeks interval between the 2 sessions.
For each MRE stiffness map, a corresponding confidence map ranging from 0 to 100% was generated by the inline calculation. Free-hand ROIs were as large as possible (Table 2), avoiding voxels with confidence index less than 95% and large vessels, liver/spleen edge, fissures and regions of ambiguous wave propagation (6). Voxel-wise stiffness values were extracted for the liver and spleen, and an average organ stiffness value was computed from all 4 slices.
Table 2.
Mean and standard deviation values of liver stiffness (LS) and spleen stiffness (SS) for both platforms and both observers (including 2nd readings of the 2nd observer).
| System # | Obs. 1 | Obs. 2 1st reading |
Obs. 2 2nd reading |
|
|---|---|---|---|---|
| LS (kPa) | 1 | 3.48 ± 2.07 | 3.44 ± 2.01 | 3.45 ± 2.03 |
| 2 | 3.62 ± 2.13 | 3.63 ± 2.14 | 3.65 ± 2.12 | |
| SS (kPa) | 1 | 7.91 ± 3.08 | 7.54 ± 3.15 | 7.68 ± 3.17 |
| 2 | 8.85 ± 3.93 | 8.40 ± 3.66 | 8.53 ± 3.80 |
System #1: 3.0T GE Discovery MR750, system #2: 1.5T Siemens MAGNETOM Aera The mean calculation omitted data for subjects providing results for only one platform.
Statistical Analysis
For the phantom data, the coefficient of variation (CV) of the estimated values of the stiffness (magnitude of the complex shear modulus), the real part μR and imaginary part μI of the shear modulus between the two platforms was calculated. For in vivo data, restricted maximum likelihood estimation of variance components in a mixed model analysis of variance was used to estimate the intra-observer, inter-observer and inter-platform components of within-subject variance and the inter-subject variance of the measured value of the magnitude of the complex shear modulus. The estimated components were used to estimate the within-subject CV and intra-class correlation coefficient (ICC) to assess the intra-observer, inter-observer and inter-platform reproducibility of LS and SS measurements. Initially, the analysis was stratified by organ and platform. Subsequently, data from all combinations of organ and platform were pooled into a single overall analysis to produce overall estimates of the reproducibility measures. In the pooled analysis, organ and scanner were added as fixed effects to adjust for systematic differences across the levels of these factors and a likelihood ratio test was used to compare the inter-observer and inter-platform components of intra-subject variance. For each combination of organ and reader, paired-sample t tests were used to compare scanners in terms of mean stiffness in order to test whether one scanner tended to produce systematically higher values than the other scanner for the same patient. Finally, a Bland-Altman analysis was performed. The percent of bias, the 95% limits of agreement as well as the coefficient of reproducibility (CR = 1.96 × SD of bias) were determined for inter- and intra-observer variability and inter-platform variability for both liver and spleen. All analyses were performed using SAS version 9.3 (SAS Institute, Cary, NC) and GraphPad Prism 5.0 software (GraphPad Software, Inc., California, USA).
RESULTS
Phantom Data
There was excellent inter-platform reproducibility with mean stiffness values of 3.25 ± 0.61 kPa and 3.45 ± 0.47 kPa for systems #1 and #2, respectively (Fig. 1). The mean μR and μI were 3.48 ± 0.05 kPa and 0.15 ± 0.04 kPa (system #1) and 3.74 ± 0.07 kPa and 0.16 ± 0.07 kPa (system #2). The CVs of stiffness, μR and μI between the two systems were 4.4%, 5.1% and 5.6%, respectively.
In Vivo Data
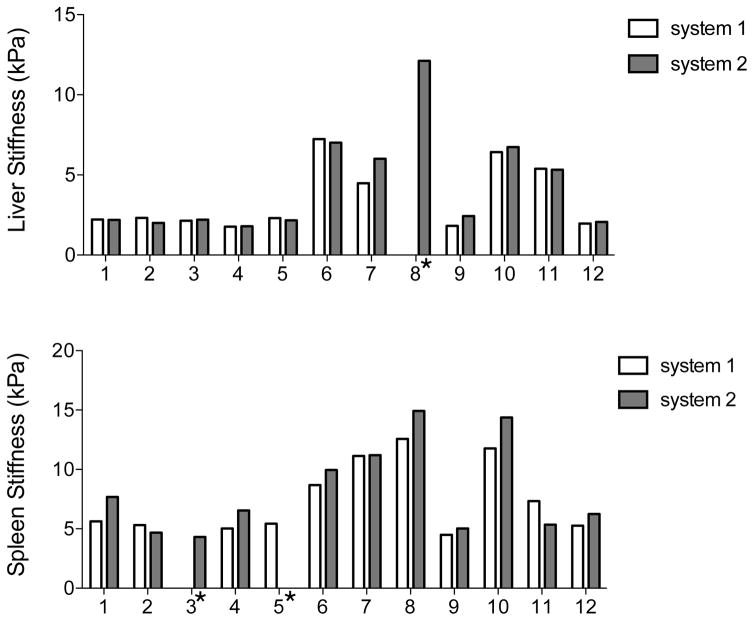
There was one case (one patient) of MRE failure for the liver on system #1 and two cases (2 volunteers) for the spleen (one volunteer on each system), with no voxel with more than 95% confidence level on the confidence map. Hence, the following data was analyzed: LS (n=11 for system #1, n=12 for system #2) and SS (n=11 for both systems). Mean stiffness values for each observer are presented in Table 2 (Fig. 3).
Fig. 3.
Histogram distribution plot showing LS and SS values in each subject measured by 2 observers with 2 MR platforms (average of 2 observers). There were one case of MRE failure for the liver and 2 cases for the spleen. In 8/10 subjects, spleen stiffness was lower with system #1; while liver stiffness was lower with system #1 in 6/11 subjects.
✓ Inter-Platform Reproducibility (Table 3)
Table 3.
Inter-platform reproducibility of liver stiffness (LS) and spleen stiffness (SS) measurements between the two platforms and for each observer (Obs. 1 and Obs. 2).
| p* | ICC | CV (%) | CR (%) | Mean bias (%) | BALA | ||
|---|---|---|---|---|---|---|---|
| LS | Obs. 1 | 0.363 | 0.976 | 9.2 | 25.4 | −3.3 | [−28.7, 22.0] |
| Obs. 2 | 0.326 | 0.979 | 11.5 | 29.7 | −4.2 | [−33.9, 25.4] | |
| SS | Obs. 1 | 0.079 | 0.884 | 14.4 | 36.2 | −9.2 | [−45.4, 26.9] |
| Obs. 2 | 0.061 | 0.912 | 13.1 | 35.6 | −10.4 | [−46.0, 25.1] |
Paired t-test to compare scanners in terms of mean stiffness.
ICC: intra-class correlation
CV: coefficient of variation (%)
CR: coefficient of reproducibility (%)
BALA: Bland-Altman limits of agreement (%)
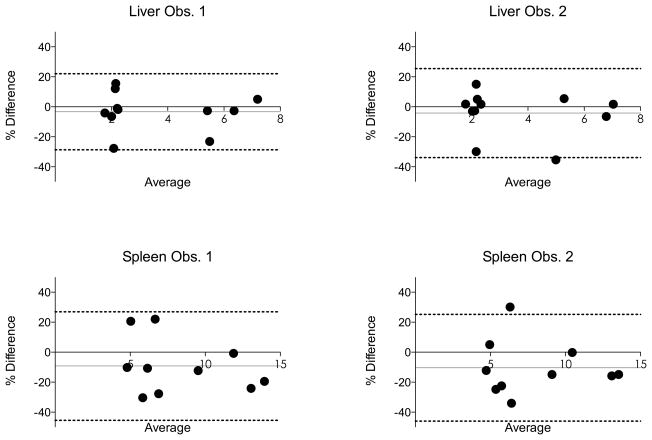
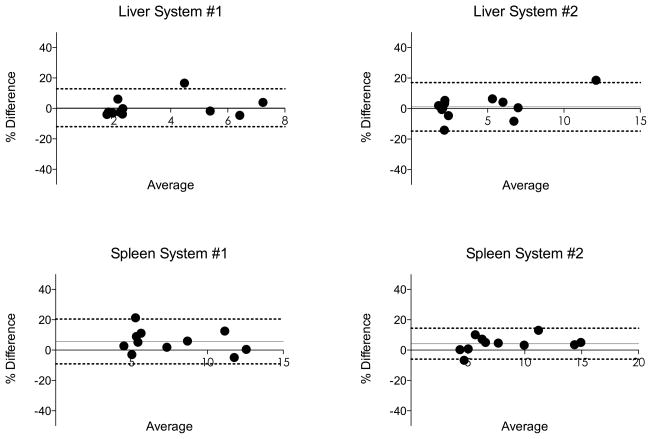
ICC between scanners for both LS and SS was higher than 0.8, indicating excellent agreement (28). CVs for both observers were lower than 15%. Bland-Altman analysis found a CR between 25.4% and 36.2%, depending on the organ or observer (Fig. 4). Pooled over organs and readers, the inter-system CV was estimated as 12.1%, and the ICC was 0.938.
Fig. 4.
Bland-Altman analysis comparing liver and spleen stiffness values obtained from two different platforms (system #1: 3.0T GE Discovery MR750, system #2: 1.5T Siemens MAGNETOM Aera, data is pooled). Dashed lines represent Bland-Altman limits of agreement (1.96 SD). Grey line represents bias (see also Table 3). In 8/10 subjects, the spleen stiffness was lower with system #1, explaining the negative bias.
In absolute values, the mean difference of stiffness measurement was 0.13 ± 0.46 kPa and 0.19 ± 0.60 kPa in the liver for observer 1 and 2, respectively, and 0.94 ± 1.51 kPa and 0.87 ± 1.28 kPa in the spleen for observer 1 and 2, respectively. In 8/10 subjects, SS was lower with system #1, explaining the negative bias (Fig. 4).
✓ Inter-Observer Reproducibility (Table 4)
Table 4.
Inter- and intra-observer reproducibility of liver stiffness (LS) and spleen stiffness (SS) measurements for each platform.
| System # | ICC | CV (%) | CR (%) | Mean Bias (%) | BALA | |
|---|---|---|---|---|---|---|
| Inter-observer | ||||||
| LS | 1 | 0.992 | 5.4 | 12.4 | 0.4 | [−12.0, 12.8] |
| 2 | 0.979 | 11.2 | 15.9 | 1.1 | [−14.8, 16.9] | |
| SS | 1 | 0.980 | 10.0 | 14.8 | 5.6 | [−9.1, 20.4] |
| 2 | 0.989 | 15.7 | 10.2 | 4.2 | [−5.9, 14.4] | |
| Intra-observer | ||||||
| LS | 1 | 0.999 | 1.2 | 2.9 | −0.1 | [−3.0, 2.7] |
| 2 | 0.999 | 1.5 | 4.2 | −0.8 | [−5.0, 3.3] | |
| SS | 1 | 0.998 | 2.1 | 6.6 | −2.0 | [−8.6, 4.5] |
| 2 | 0.998 | 1.9 | 3.5 | −1.2 | [−4.7, 2.2] | |
System #1: 3.0T GE Discovery MR750, system #2: 1.5T Siemens MAGNETOM Aera
CV: coefficient of variation (%)
CR: coefficient of reproducibility (%)
BALA: Bland-Altman limits of agreement (%)
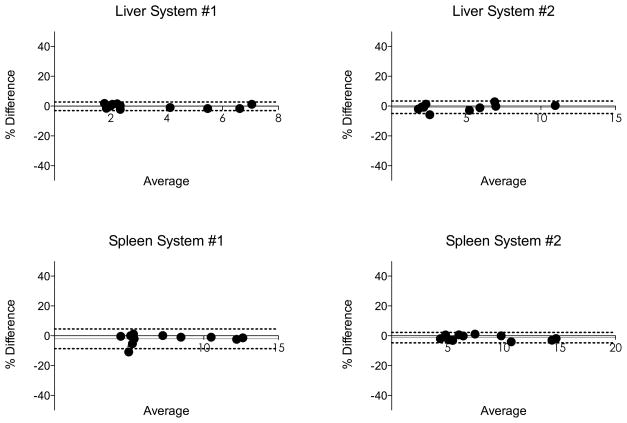
For both systems and organs, there was an excellent inter-observer agreement, with ICC > 0.97, CV lower than 16% and Bland-Altman CR lower than 16% (Fig. 5). Pooled over organs and scanners, the inter-observer CV was estimated as 6.9% and the ICC as 0.985.
Fig. 5.
Bland-Altman analysis for inter-observer reproducibility of liver and spleen stiffness obtained with two different platforms (System #1: 3.0T GE Discovery MR750, System #2: 1.5T Siemens MAGNETOM Aera). Dashed lines represent Bland-Altman limits of agreement (1.96 SD). Grey line represents bias (see also Table 4). The inter-observer reproducibility was excellent with low bias (<6%) and low CR (<16%).
✓ Intra-Observer Reproducibility (Table 5)
The results were almost identical for both LS and SS for repeat readings of observer 2 for both systems, with high ICC (≥0.99) indicating perfect agreement, very low CV (≤2.1%) and Bland-Altman CR (≤6.6%) (Fig. 6). Pooled over organs and scanners, the intra-observer CV was estimated as 1.9% and the ICC as 0.997.
Fig. 6.
Bland-Altman analysis for intra-observer reproducibility (for observer 2) of liver and spleen stiffness values obtained from 2 different platforms (System #1: 3.0T GE Discovery MR750, System #2: 1.5T Siemens MAGNETOM Aera). Dashed lines represent Bland-Altman limits of agreement (1.96 SD). Grey line represents bias (see also Table 4). The intra-observer reproducibility was excellent with low bias (<2%) and low CR (<6%).
DISCUSSION
In this study, we have compared the shear modulus in a gelatin phantom and the shear stiffness estimation in the liver and spleen of healthy volunteers and patients with liver disease between two systems from different manufacturers and field strengths (1.5T vs. 3.0T). We showed that agreement between MRI platforms was excellent, however slightly better for LS than for SS; while inter-observer and intra-observer readings were almost perfect. In the liver, the agreement of MRE between platforms of same magnetic field has been recently reported for LS, showing a high reproducibility (95% limits of agreement [−0.16; 0.34] in absolute values) (20), in agreement with our results. It is expected to have similar stiffness estimation regardless of MR platforms when using equivalent pulse sequences and sequence parameters, as MRE is based on mechanical properties of the target tissue rather than its chemical properties. However, several factors can potentially influence MRE measurement, these include image quality, mismatch of slice location, setup variations, and biological changes in subjects. First, the image quality, SNR or Phase-to-Noise Ratio (PNR) [ratio of signal angle to phase noise (29)] are bounded by the performance of the scanner (30,31) and the MRE pulse sequence based on techniques such as gradient echo and EPI. It is not expected to have the same SNR/PNR, nor same distortion between any two systems. Like all estimation methods, stiffness and shear modulus estimation accuracies are also limited by the input image quality. Also, distortion of the image plays a significant factor, because it affects the wavelength measurement needed to estimate the stiffness. Second, the selected slices between scanners may not share the same spatial position or resolution. Since actual mechanical waves are travelling inside the phantom or inside the body in a three-dimensional manner, slightly different slice locations may capture a different wave propagation pattern. However, the current study, as well as the published test-retest studies, showed that the minor variation in slice positioning does not affect the results (18,24,32). Third, the real actuation in the studied organ cannot be exactly the same between two MRE measurements. Indeed, even if the actuation setup and the actuation power are similar, the patient is not exactly positioned identically in the MRI system, and the paddle is placed approximately in the same location and with the same orientation. Those differences may lead to variation of the actuation of the studied organ and therefore of the tissue response. Last, it is expected to have various changes in the biologic characteristics of subjects such as change in breath-hold state as well as patient position and passive-driver placement. In spite of all these factors that would cause variance in stiffness estimations, the current study showed excellent reproducibility between systems when using a 2D-GRE MRE sequence. Of note, the LS variability was slightly higher to that reported for test-retest variability (CV between 2.7% and 10.8% in test-retest studies) (18,24,32). LS reproducibility was better than SS reproducibility mostly because current stiffness estimation algorithms are optimized for liver. Higher SS values were observed with system #2 while similar LS values were observed between systems. The higher difference in SS between the two systems is very likely due to a wave direction difference between the two acquisitions, resulting in a difference in apparent wavelength. The driver is designed to create a very reproducible wave pattern in the liver, but it cannot do this in other structures, due to their different anatomy and geometry. The way to address this for spleen imaging is to use 3D MRE, which will not be sensitive to wave direction and should decrease the variability between acquisitions (12,33). Finally, we found a very high reproducibility for inter- and intra-observer analysis, with lower variability than that reported in Lee et al. (19). In the study by Lee et al., ROIs included the greatest part of the liver parenchyma and were not based on confidence maps. With precise guidelines and using the confidence map, stiffness measurements in liver and spleen are reproducible with CR lower than 18% for inter-observer analysis and lower than 5% for intra-observer analysis.
Multiple studies have established the diagnostic performance of MRE as a clinical tool for non-invasively assessing liver fibrosis and cirrhosis (7–9). However, most of these studies have been conducted on single MRI systems. If the MRE measurements can be shown to be suitably reproducible across different vendor platforms, this would have obvious practical advantages in using the modality to evaluate individual patients longitudinally when different scanners are used and to establish diagnostic criteria for measurements in multiple patients across different platforms.
Our study had several limitations. First, the number of subjects was small, however, this scale of sampling is often used in reproducibility analysis (18). Second, we did not perform test-retest data on the same imaging platform, as in the work of Shire et al. (18). However, test-retest MRE examination has been reported recently (18,24,32). Third, the MRE technique used on both systems in this study is a 2D method, which has been shown in multiple studies to be satisfactory for evaluating liver stiffness, but in general has limited performance compared with a full 3D implementation for assessing other structures, such as the spleen (34). Further studies are required to assess how to improve SS estimation.
In conclusion, we found excellent reproducibility for LS and SS measured with MRE between 1.5T and 3.0T MR systems, within the limits of test-retest data for LS obtained in other studies (18,24,32), with better reproducibility for LS compared to SS. This provides strong support to the theoretical expectation of inter-platform independence of MRE. It is also demonstrated that inter-observer reproducibility is very high and intra-observer variability is almost non-existent. These findings may have implications for future multicenter prospective studies assessing the role of MRE in liver fibrosis treatment response. Bias observed in SS measurement should be further investigated by tuning the MRE parameters in accordance with mechanical properties of spleen and/or by acquiring more advanced MRE pulse sequences suitable for the spleen.
Acknowledgments
Funding: NIH Grant 1R01DK087877, NIH Grant EB001981, General Electric Healthcare grant, Société Française de Radiologie
References
- 1.Ichikawa S, Motosugi U, Morisaka H, et al. Comparison of the diagnostic accuracies of magnetic resonance elastography and transient elastography for hepatic fibrosis. Magn Reson Imaging. 2015;33(1):26–30. doi: 10.1016/j.mri.2014.10.003. [DOI] [PubMed] [Google Scholar]
- 2.Castera L, Sebastiani G, Le Bail B, de Ledinghen V, Couzigou P, Alberti A. Prospective comparison of two algorithms combining non-invasive methods for staging liver fibrosis in chronic hepatitis C. J Hepatol. 2010;52(2):191–198. doi: 10.1016/j.jhep.2009.11.008. [DOI] [PubMed] [Google Scholar]
- 3.Castera L, Vergniol J, Foucher J, et al. Prospective comparison of transient elastography, Fibrotest, APRI, and liver biopsy for the assessment of fibrosis in chronic hepatitis C. Gastroenterology. 2005;128(2):343–350. doi: 10.1053/j.gastro.2004.11.018. [DOI] [PubMed] [Google Scholar]
- 4.Friedrich-Rust M, Ong MF, Herrmann E, et al. Real-time elastography for noninvasive assessment of liver fibrosis in chronic viral hepatitis. AJR Am J Roentgenol. 2007;188(3):758–764. doi: 10.2214/AJR.06.0322. [DOI] [PubMed] [Google Scholar]
- 5.Friedrich-Rust M, Wunder K, Kriener S, et al. Liver fibrosis in viral hepatitis: noninvasive assessment with acoustic radiation force impulse imaging versus transient elastography. Radiology. 2009;252(2):595–604. doi: 10.1148/radiol.2523081928. [DOI] [PubMed] [Google Scholar]
- 6.Venkatesh SK, Ehman RL. Magnetic resonance elastography of liver. Magn Reson Imaging Clin N Am. 2014;22(3):433–446. doi: 10.1016/j.mric.2014.05.001. [DOI] [PMC free article] [PubMed] [Google Scholar]
- 7.Huwart L, Sempoux C, Salameh N, et al. Liver fibrosis: noninvasive assessment with MR elastography versus aspartate aminotransferase-to-platelet ratio index. Radiology. 2007;245(2):458–466. doi: 10.1148/radiol.2452061673. [DOI] [PubMed] [Google Scholar]
- 8.Shi Y, Guo Q, Xia F, et al. MR Elastography for the Assessment of Hepatic Fibrosis in Patients with Chronic Hepatitis B Infection: Does Histologic Necroinflammation Influence the Measurement of Hepatic Stiffness? Radiology. 2014;273(1):88–98. doi: 10.1148/radiol.14132592. [DOI] [PMC free article] [PubMed] [Google Scholar]
- 9.Venkatesh SK, Wang G, Lim SG, Wee A. Magnetic resonance elastography for the detection and staging of liver fibrosis in chronic hepatitis B. Eur Radiol. 2014;24(1):70–78. doi: 10.1007/s00330-013-2978-8. [DOI] [PubMed] [Google Scholar]
- 10.Berzigotti A, Seijo S, Arena U, et al. Elastography, spleen size, and platelet count identify portal hypertension in patients with compensated cirrhosis. Gastroenterology. 2013;144(1):102–111. e101. doi: 10.1053/j.gastro.2012.10.001. [DOI] [PubMed] [Google Scholar]
- 11.Takuma Y, Nouso K, Morimoto Y, et al. Measurement of spleen stiffness by acoustic radiation force impulse imaging identifies cirrhotic patients with esophageal varices. Gastroenterology. 2013;144(1):92–101. e102. doi: 10.1053/j.gastro.2012.09.049. [DOI] [PubMed] [Google Scholar]
- 12.Ronot M, Lambert S, Elkrief L, et al. Assessment of portal hypertension and high-risk oesophageal varices with liver and spleen three-dimensional multifrequency MR elastography in liver cirrhosis. Eur Radiol. 2014;24(6):1394–1402. doi: 10.1007/s00330-014-3124-y. [DOI] [PubMed] [Google Scholar]
- 13.Yin M, Kolipaka A, Woodrum DA, et al. Hepatic and splenic stiffness augmentation assessed with MR elastography in an in vivo porcine portal hypertension model. J Magn Reson Imaging. 2013;38(4):809–815. doi: 10.1002/jmri.24049. [DOI] [PMC free article] [PubMed] [Google Scholar]
- 14.Morisaka H, Motosugi U, Ichikawa S, Sano K, Ichikawa T, Enomoto N. Association of splenic MR elastographic findings with gastroesophageal varices in patients with chronic liver disease. J Magn Reson Imaging. 2015;41(1):117–124. doi: 10.1002/jmri.24505. [DOI] [PubMed] [Google Scholar]
- 15.Elkrief L, Rautou PE, Ronot M, et al. Prospective comparison of spleen and liver stiffness by using shear-wave and transient elastography for detection of portal hypertension in cirrhosis. Radiology. 2015;275(2):589–598. doi: 10.1148/radiol.14141210. [DOI] [PubMed] [Google Scholar]
- 16.Ringleb SI, Chen Q, Lake DS, Manduca A, Ehman RL, An KN. Quantitative shear wave magnetic resonance elastography: comparison to a dynamic shear material test. Magn Reson Med. 2005;53(5):1197–1201. doi: 10.1002/mrm.20449. [DOI] [PubMed] [Google Scholar]
- 17.Hines CD, Bley TA, Lindstrom MJ, Reeder SB. Repeatability of magnetic resonance elastography for quantification of hepatic stiffness. J Magn Reson Imaging. 2010;31(3):725–731. doi: 10.1002/jmri.22066. [DOI] [PMC free article] [PubMed] [Google Scholar]
- 18.Shire NJ, Yin M, Chen J, et al. Test-retest repeatability of MR elastography for noninvasive liver fibrosis assessment in hepatitis C. J Magn Reson Imaging. 2011;34(4):947–955. doi: 10.1002/jmri.22716. [DOI] [PMC free article] [PubMed] [Google Scholar]
- 19.Lee DH, Lee JM, Han JK, Choi BI. MR elastography of healthy liver parenchyma: Normal value and reliability of the liver stiffness value measurement. J Magn Reson Imaging. 2013;38(5):1215–1223. doi: 10.1002/jmri.23958. [DOI] [PubMed] [Google Scholar]
- 20.Serai SD, Yin M, Wang H, Ehman RL, Podberesky DJ. Cross-vendor validation of liver magnetic resonance elastography. Abdom Imaging. 2015;40(4):789–794. doi: 10.1007/s00261-014-0282-y. [DOI] [PMC free article] [PubMed] [Google Scholar]
- 21.Royston T, Yasar T, Magin R. Geometric focusing of high frequency shear waves for noninvasive high resolution MR elastography. Proceedings of the 19th Annual Meeting of ISMRM; Montreal. 2011. [Google Scholar]
- 22.Yasar TK, Royston TJ, Magin RL. Wideband MR elastography for viscoelasticity model identification. Magn Reson Med. 2013;70(2):479–489. doi: 10.1002/mrm.24495. [DOI] [PMC free article] [PubMed] [Google Scholar]
- 23.Clayton EH, Okamoto RJ, Bayly PV. Mechanical properties of viscoelastic media by local frequency estimation of divergence-free wave fields. J Biomech Eng. 2013;135(2):021025. doi: 10.1115/1.4023433. [DOI] [PMC free article] [PubMed] [Google Scholar]
- 24.Jajamovich GH, Dyvorne H, Donnerhack C, Taouli B. Quantitative Liver MRI Combining Phase Contrast Imaging, Elastography, and DWI: Assessment of Reproducibility and Postprandial Effect at 3. 0 T. PLoS One. 2014;9(5):e97355. doi: 10.1371/journal.pone.0097355. [DOI] [PMC free article] [PubMed] [Google Scholar]
- 25.Yin M, Talwalkar JA, Glaser KJ, et al. Assessment of hepatic fibrosis with magnetic resonance elastography. Clin Gastroenterol Hepatol. 2007;5(10):1207–1213. e1202. doi: 10.1016/j.cgh.2007.06.012. [DOI] [PMC free article] [PubMed] [Google Scholar]
- 26.Silva AM, Grimm RC, Glaser KJ, et al. Magnetic resonance elastography: evaluation of new inversion algorithm and quantitative analysis method. Abdom Imaging. 2015;40(4):810–817. doi: 10.1007/s00261-015-0372-5. [DOI] [PubMed] [Google Scholar]
- 27.Liu Y, Yasar TK, Royston TJ. Ultra wideband (0. 5–16 kHz) MR elastography for robust shear viscoelasticity model identification. Phys Med Biol. 2014;59(24):7717–7734. doi: 10.1088/0031-9155/59/24/7717. [DOI] [PMC free article] [PubMed] [Google Scholar]
- 28.Landis JR, Koch GG. The measurement of observer agreement for categorical data. Biometrics. 1977;33(1):159–174. [PubMed] [Google Scholar]
- 29.Rump J, Klatt D, Braun J, Warmuth C, Sack I. Fractional encoding of harmonic motions in MR elastography. Magn Reson Med. 2007;57(2):388–395. doi: 10.1002/mrm.21152. [DOI] [PubMed] [Google Scholar]
- 30.Schindera ST, Merkle EM, Dale BM, Delong DM, Nelson RC. Abdominal magnetic resonance imaging at 3.0 T what is the ultimate gain in signal-to-noise ratio? Acad Radiol. 2006;13(10):1236–1243. doi: 10.1016/j.acra.2006.06.018. [DOI] [PubMed] [Google Scholar]
- 31.Willinek WA, Schild HH. Clinical advantages of 3.0 T MRI over 1. 5 T. Eur J Radiol. 2008;65(1):2–14. doi: 10.1016/j.ejrad.2007.11.006. [DOI] [PubMed] [Google Scholar]
- 32.Shi Y, Guo Q, Xia F, Sun J, Gao Y. Short- and midterm repeatability of magnetic resonance elastography in healthy volunteers at 3. 0 T. Magn Reson Imaging. 2014;32(6):665–670. doi: 10.1016/j.mri.2014.02.018. [DOI] [PubMed] [Google Scholar]
- 33.Shin SU, Lee JM, Yu MH, et al. Prediction of esophageal varices in patients with cirrhosis: usefulness of three-dimensional MR elastography with echo-planar imaging technique. Radiology. 2014;272(1):143–153. doi: 10.1148/radiol.14130916. [DOI] [PMC free article] [PubMed] [Google Scholar]
- 34.Yin M, Manduca A, Romano A, et al. 3-D local frequency estimation inversion for abdominal MR elastography. Proceedings of the 15th Annual Meeting of ISMRM; Berlin. 2007. [Google Scholar]


