Abstract
Hepatic encephalopathy (HE) is a serious neurological complication of acute and chronic liver failure. Expression of the neurosteroid/bile acid receptor TGR5 has been demonstrated in the brain and is thought to be neuroprotective. However, it is unknown how TGR5 signaling can influence the progression and associated neuroinflammation of HE. HE was induced in C57Bl/6 mice via intraperitoneal injection of azoxymethane (AOM) and tissue was collected throughout disease progression. TGR5 expression was elevated in the frontal cortex following AOM injection in mice. The cellular localization of TGR5 was found in both neurons and microglia in the cortex of C57Bl/6 mice. Central infusion of the TGR5 agonist, betulinic acid, prior to AOM injection delayed neurological decline, increased cortical cyclic adenosine monophosphate concentrations, reduced microglia activation and proliferation, and reduced proinflammatory cytokine production. Betulinic acid treatment in vitro reduced the neuronal expression of CCL2, a chemokine previously demonstrated to contribute to HE pathogenesis. Lastly, treatment of the microglia cell line EOC-20 with conditioned media from betulinic acid-treated primary neurons decreased phagocytic activity and cytokine production. Together, these data identify that activation of TGR5, which is upregulated during HE, alleviates neuroinflammation and improves outcomes of AOM-treated mice through neuron and microglia paracrine signaling.
Keywords: GPBAR-1, microglia, azoxymethane, acute liver failure, betulinic acid, IBA1
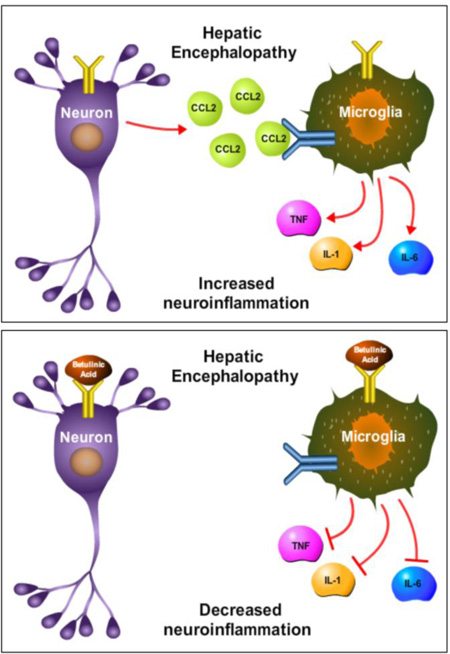
Graphical Abstract
This study supports that betulinic acid infusion into the brain during hepatic encephalopathy reduces the release of the neuronal cytokine CCL2 and subsequently inhibits proinflammatory cytokine release from microglia. This improves neurological outcomes in a mouse model of hepatic encephalopathy and identifies a potential therapeutic target for its management.
Introduction
Hepatic encephalopathy (HE) is a serious neuropathological state that arises as a part of a multi-organ manifestation of liver failure. HE has a wide variety of neuropsychiatric presentations, from asymptomatic to severe cognitive decline, and even neurologic death, with features impacting clinical management and liver transplant priority, as well as a decline in patient quality of life and overall survival (Butterworth 2011, Ferenci et al. 2002).
Liver injury can lead to inflammation through a number of proposed mechanisms, including infective processes such as bacterial and fungal infections following immunosuppression (Rolando et al. 1990, Rolando et al. 2000), or as a result of the organ damage itself and resultant increase in released proinflammatory cytokines such as tumor necrosis factor alpha (TNFα) (Ksontini et al. 1998). Increased inflammation has been demonstrated to lead to increased progression of HE and worse outcomes for patients with liver failure (Rolando et al. 2000, Vaquero et al. 2003). Interestingly, patients with acetaminophen overdose were assessed for central nervous system cytokine production using a reverse jugular catheter, and it was found that proinflammatory cytokines were elevated and derived from increased production in the brain (Wright et al. 2007). These clinical findings support what has been demonstrated in experimental rodent models of HE, such as rat hepatic devascularization or the mouse azoxymethane (AOM) model, where microglia activation with subsequent elevations of neural TNFα and interleukin (IL)-1β, have been observed (Jiang et al. 2009b, Bemeur et al. 2010). We have recently identified that neuron-derived chemokine ligand 2 (CCL2) drives microglia activation and subsequent neuroinflammation, as well as the progression of neurological decline, in the AOM model of HE (McMillin et al. 2014a). Together, these reports indicate a prominent role for neuroinflammation in the pathological processes associated with HE.
Neurosteroids have been implicated in the pathogenesis of HE through a variety of effects, but their exact roles in the progression of HE have not been fully elucidated. Neurosteroids have the capability to bind and activate a variety of receptors, including gamma-aminobutyric acid A, hydroxytryptamine 3, N-methyl-D-aspartate, glycine, and opioid receptors which give neurosteroids the ability to generate a variety of effects in the brain (Ahboucha 2011). In regards to HE, increased concentrations of the neurosteroid allopregnanolone have been found in frontal cortical tissue of cirrhotic patients with HE who died from hepatic coma (Ahboucha et al. 2005). In a variety of experimental models of acute liver failure (ALF), including the mouse thioacetamide model, rats with ischemia-induced ALF, rat portacaval anastomosis, and models of hyperammonemia in mice and rats, allopregnanolone and pregnanolone have been found to be significantly elevated in the brain (Itzhak et al. 1995, Belanger et al. 2005, Norenberg et al. 1997, Ahboucha et al. 2008, Cauli et al. 2009a). In other neurological disease states, such as traumatic brain injury, allopregnanolone and progesterone have been shown to reduce expression of inflammatory cytokines such as IL-1β and TNFα, suggesting neurosteroids are modulators of neuroinflammation (He et al. 2004).
Interestingly, neurosteroids have recently been shown to be agonists that bind to and induce signaling of the plasma membrane G protein-coupled bile acid receptor 1 (Gpbar-1), also known as Takeda G-protein coupled receptor 5 (TGR5) (Keitel et al. 2010). TGR5 has been found in a number of tissues, with highest levels of expression in liver, lung and spleen, with high cellular expression in monocyte/macrophage cell populations (Kawamata et al. 2003). In the liver, treatment with the TGR5 agonist betulinic acid has been shown to reduce the elevation of liver enzymes aspartate aminotransferase (AST) and alanine aminotransferase (ALT) observed following alcohol-induced liver injury (Wan et al. 2013). In the brain, TGR5 mRNA has been detected in both neurons and astrocytes, with downregulation of TGR5 mRNA in the presence of increasing ammonia concentrations in cultured astrocytes (Keitel et al. 2010). TGR5 has also been shown to reduce production of proinflammatory cytokines in macrophages through activation of cyclic adenosine monophosphate (cAMP) signaling (Yoneno et al. 2013).
Currently, little is known concerning the role of TGR5 in the neuroinflammatory cascade that contributes to HE development. Therefore, the hypothesis of this study is that TGR5 signaling is increased during HE and activation of this receptor may reduce neuroinflammation and improve neurological deficits during HE.
Methods
Materials
Antibodies against ionized calcium-binding adapter molecule 1 (IBA1) were purchased from Wako Chemicals USA (Richmond, VA). Antibodies against TGR5 were purchased from Abcam (Cambridge, MA). Antibodies against CD11b, glutamate aspartate transporter (GLAST), CD11b-phycoerythrin (PE), CD90-PE, and GLAST-PE were purchased from Miltenyi Biotec (San Diego, CA). NeuN antibodies were ordered from Millipore (Billerica, MA). All real-time PCR (RT-PCR) primers were purchased from SABiosciences (Frederick, MD). Betulinic acid was purchased from Tocris Bioscience (Minneapolis, MN). All other chemicals were purchased from Sigma-Aldrich (St. Louis, MO) unless otherwise noted, and were of the highest grade available.
Mouse model of hepatic encephalopathy
Male C57Bl/6 mice (20–25g; Charles River Laboratories, Wilmington, MA) were used in all in vivo experiments as previously described (McMillin et al. 2014a, McMillin et al. 2014b). All animal experiments were approved by the Baylor Scott & White IACUC (protocol no 2011-052R) and comply with ARRIVE guidelines. Mice were given free access to water and rodent chow and were housed in constant temperature, humidity, and 12 hour light-dark cycling. ALF was induced via a single intraperitoneal (ip) injection of 100 mg/kg of AOM. In parallel, TGR5 activity was increased via intracerebroventricular (ICV) infusion of the TGR5 agonist betulinic acid (10 pmol/day) 3 days prior to injection of AOM. Following injection, mice were placed on heating pads adjusted to 37°C and monitored frequently for signs of neurological decline. To reduce the impacts of hypoglycemia and dehydration, cage floors were supplied with hydrogel and rodent chow and after 12 hours and every subsequent 4 hours mice were injected subcutaneously with 5% dextrose in 250µl of saline. If mice underwent a 20% weight loss or greater they were removed from the study.
At twelve hours following injection (and every two hours thereafter), body temperature, weight, and neurological assessments were measured. Neurological function was assessed by measuring the pinna reflex, corneal reflex, tail flexion reflex, escape response reflex, righting reflex and ataxia, with each criteria scored on a scale of 0 (no reflex) to 2 (intact reflex). The neurological score at each time point was defined as the summation of these reflex scores. In addition, time to coma (defined as a loss of all reflexes) was recorded. Prior to coma, three neurological stages are defined based upon reflex measures. A pre-neurological decline stage is characterized by reduced activity but no deficits in reflexes or ataxia. The mice reach minor neurological decline once they develop delays in any measured reflex and the presence of mild ataxia such as having difficulty walking across a metal cage lid. Major neurological decline occurs when there are severe deficits in all reflexes with the presence of significant ataxia.
Tissue was flash frozen and collected at the identified stages of neurological decline and coma (loss of corneal and righting reflexes) for further analysis. Mice used for histochemical studies were transcardially perfused with PBS followed by 4% paraformaldehyde (PFA). Whole brains were removed and placed into PFA for 24 hours, after which they were moved to a 30% sucrose solution for cryoprotection. Brains were frozen and sectioned using a cryostat for immunofluorescence imaging.
Primary neuron isolation and cell culture
Primary neurons were isolated from mouse pups using methods adapted from primary rat neuron isolations in previous studies (McMillin et al. 2014b). P1 mouse pups were decapitated and whole brains were removed. Cortex was surgically isolated and dura and meninges were removed and mechanically homogenized and filtered through a 100 µm filter. Cells were pelleted via centrifugation at 1400 g and plated onto 12-well plates at 750,000 cells per ml. After 24 h, cells were supplemented with 2% B27 growth supplement and after 12–14 days, neurons were treated with betulinic acid for 24 hours. Cells were lysed, supernatants collected and RNA was isolated for further analyses.
Commercially available mouse microglia cell lines, EOC-20 cells, were purchased and cultured according to ATCC guidelines (Manassas, VA). Cells were plated onto 12-well plates for RNA isolation and subsequent RT-PCR experiments. Phagocytosis assays were performed by initially plating cells into black 96 well cell culture plates at 50,000 cells per well. Following adherence the Vybrant™ Phagocytosis Assay Kit (Molecular Probes, Eugene, OR) was utilized to measure phagocytosis according to manufacturer’s protocols.
Liver histology and biochemistry
Paraffin-embedded livers from vehicle and AOM-treated mice were sectioned into 3 µm sections and mounted onto positively charged slides (VWR, Radnor, PA). Slides were deparaffinized and stained with Hematoxylin QS (Vector Laboratories, Burlingame, CA) for one minute followed by staining for one minute with eosin Y (Amresco, Solon, OH) and rinsed in 95% ethanol. The slides were then dipped into 100% ethanol and subsequently through 2 xylene washes. Coverslips were mounted onto the slides using Vectamount mounting media (Vector Laboratories). The slides were viewed and imaged using an Olympus BX40 microscope with an Olympus DP25 imaging system (Olympus, Center Valley, PA).
Serum ALT and bilirubin were assessed using commercially available kits. Alanine aminotransferase measurement was performed using a fluorometric activity assay (Sigma-Aldrich, St. Louis, MO). Total bilirubin was assayed using a total bilirubin ELISA (CusaBio, Wuha, China). All assays and subsequent analyses were performed according to the manufacturer’s instructions.
Real-time PCR
RNA was extracted from flash frozen tissue and RT-PCR was performed as previously described (Frampton et al. 2012), using commercially available primers designed against TGR5, IL-1β, IL-6, TNFα and glyceraldehyde 3-phosphate dehydrogenase (GAPDH). A ΔΔCT analysis was performed using vehicle-treated tissue or untreated primary neurons as controls for subsequent experiments (DeMorrow et al. 2008, Livak & Schmittgen 2001). Data for all experiments are expressed as mean relative mRNA levels ± SEM.
Immunoblotting
Immunoblots were performed as previously described (DeMorrow et al. 2007) with minor modifications. For western blots, 10% SDS-PAGE gels were loaded with 10–20 µg of protein diluted in Laemmli buffer. Specific primary antibodies against TGR5 and β-actin were used along with appropriate fluorescent secondary antibodies (LI-COR, Lincoln, NE). All imaging was performed on an Odyssey 9120 Infrared Imaging System (LI-COR). Data are expressed as fold change in fluorescent band intensity of target antibody divided by β-actin, which was used as a loading control. The values of vehicle or control groups were used as a baseline and set to a relative protein expression value of 1. All treatment groups were expressed as changes of fluorescent band intensity of target antibody to β-actin relative to vehicle or control groups. All band intensity quantifications were performed using ImageJ software (National Institutes of Health, Bethesda, MD). Data for all experiments were expressed as mean relative protein expression ± SEM.
Quantitative cAMP measurement
Quantification of cAMP in tissue homogenates was performed using a commercially available kit (Enzo Life Sciences, Farmingdale, NY). Cortex tissue was weighed and homogenized in 10 volumes of a 0.1M HCl solution. Following homogenization, tissue samples were further diluted into 50 mg of tissue per 1ml of 0.1M HCl. The assay was then performed according to the manufacturer’s protocol for non-acetylated samples. Analysis of the resulting data was performed according to the recommendations of the manufacturer.
Immunofluorescence and microglia field quantitation
Free-floating immunostaining was performed on brain sections using IBA1 immunoreactivity to detect morphology and relative staining of microglia. Microglia quantitation was accomplished by manually counting IBA1 positive cells in field images (area of images was approximately 137mm2) with a minimum of 6 fields quantified per group. In addition, TGR5 and NeuN immunostaining was performed. Primary neuron immunofluorescence for TGR5 and NeuN was performed by immunostaining primary neuron coverslips in 6-well plates. Immunoreactivity was visualized using fluorescent secondary antibodies labeled with Dylight 488 or Cy3 and counterstained with ProLong© Gold Antifade Reagent containing 4’,6-diamidino-2-phenylindole (DAPI). Slides were viewed and imaged using a Leica TCS SP5-X inverted confocal microscope (Leica Microsystems, Buffalo Grove, IL). Quantification of IBA1 staining intensity was performed by converting images to grayscale, inverting their color and quantifying field staining intensity with ImageJ software.
Cell isolation and flow cytometry
Whole brains from adult C57Bl/6 mice were homogenized using an automated homogenizer from Miltenyi Biotec. Solutions used to ensure viability of cells were part of the Neural Tissue Dissociation Kit supplied from Miltenyi Biotec. Following dissociation into a single cell suspension, cells were passed through LS columns (Miltenyi Biotec) containing beads coated with CD11b antibodies (to isolate microglia) or GLAST antibodies (to isolate astrocytes) localized to the columns. The remaining cells not bound to the columns were kept as the neuron enriched fraction. LS columns were washed to remove the CD11b-bound cells or the GLAST-bound cells. The neuronal fraction was stained with CD90-PE antibodies while the microglia fraction was stained with CD11b-PE antibodies. Following staining, cells were analyzed on a BD FACS Canto II flow cytometer (Franklin Lakes, NJ). Data were analyzed using FlowJo Software (Tree Star Incorporated, Ashland, OR).
Statistical analyses
All statistical analyses were performed using Graphpad Prism software (Graphpad Software, La Jolla, CA). Results were expressed as mean ± SEM. For data that passed normality tests, significance was established using the Student’s t-test when differences between two groups were analyzed, and analysis of variance when differences between three or more groups were compared followed by the appropriate post hoc test. If tests for normality failed, two groups were compared with a Mann-Whitney U test or a Kruskal-Wallis ranked analysis when more than two groups were analyzed. Differences were considered significant for p values less than 0.05.
Results
TGR5 is upregulated in the cortex of AOM-treated mice
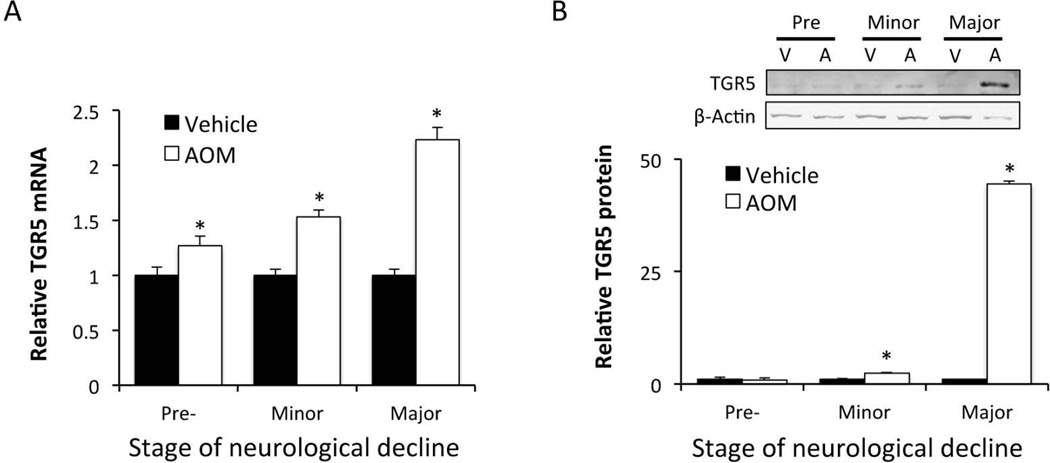
In order to examine the regulation of TGR5 during HE, mice were injected with AOM and assessed at the following stages of neurological impairment: prior to neurological decline (Pre), when minor neurological symptoms were present (Minor) and when major neurological deficits were present (Major). Pre neurological decline began at 8.91±1.22 hours, minor neurological decline occurred at 12.92±0.54 hours and major neurological decline began at 16.46±1.29 hours. TGR5 mRNA expression in the cortex was found to be significantly elevated following ALF prior to the development of overt neurological dysfunction and increased throughout the time course of this experiment (figure 1A). Cortical TGR5 protein expression demonstrated a similar trend with significant increases of protein at minor and major stages of neurological decline (figure 1B).
Figure 1. TGR5 is upregulated in the cortex of AOM-treated mice.
(A) Cortical TGR5 mRNA expression during the timecourse of AOM-induced HE. (B) TGR5 protein immunoblots and quantification in the cortex during the timecourse of AOM-treated mice neurological decline. * = p<0.05 compared to vehicle or age-matched controls.
Central betulinic acid infusion is protective during HE
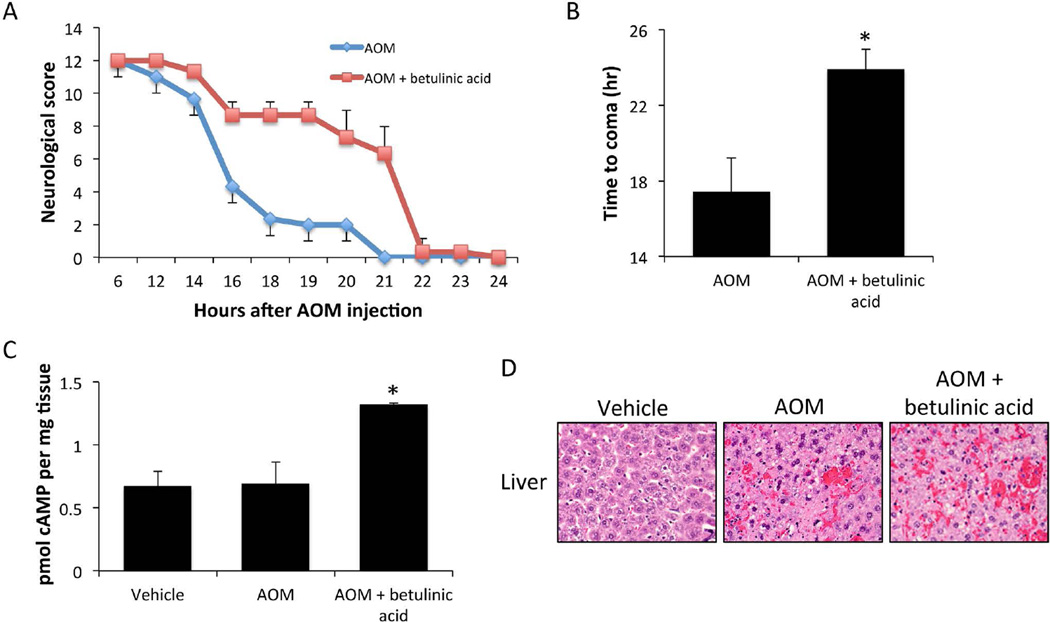
Due to the upregulation of TGR5 in the cortex of AOM-treated mice, treatment with betulinic acid, a TGR5 agonist, could identify the role of this receptor in HE pathology. C57Bl/6 mice were implanted with osmotic minipumps and infused ICV with betulinic acid for 3 days prior to AOM injection. AOM-treated mice that were infused with betulinic acid had a delayed neurological decline compared to mice infused with vehicle (figure 2A). Betulinic acid infusion into control-treated mice did not result in any observable changes in neurological measures (data not shown). The time taken to reach coma for the AOM-treated betulinic acid-infused mice was significantly longer than AOM-treated mice infused with vehicle (figure 2B). As a measurement of TGR5 downstream activity, cAMP was assessed in the cortex of mice infused with betulinic acid. These data demonstrate that there is little change in cAMP concentrations between vehicle and AOM-treated mice infused with vehicle. However, AOM-treated mice infused with betulinic acid saw a significant increase of cortical cAMP levels compared to vehicle-treated mice indicating that betulinic acid infusion is generating signaling-mediated effects (figure 2C). H&E stains of liver sections from AOM-treated mice infused with betulinic acid or vehicle demonstrated no significant differences in liver damage between groups, though both groups display increased necrosis compared to vehicle-treated mice (figure 2D). Liver function analyses, as assessed by ALT and bilirubin (table 1), demonstrate that treatment with betulinic acid confers a significant worsening of hepatic function compared to mice treated with AOM-alone. These results indicate that the increased time taken to reach coma in mice infused with betulinic acid is primarily due to neuroprotective mechanisms.
Figure 2. Central TGR5 agonism with betulinic acid in neuroprotective in AOM-treated mice.
(A) Neurological decline graph of mice treated with AOM and those treated with AOM + betulinic acid. Neurological score is a summation of 5 reflex scores and ataxia assessment as outlined in the methods with 12 having normal reflex scores and 0 having no reflex response. (B) Time to coma in hours following AOM administration in mice treated with AOM and those treated with AOM + betulinic acid. (C) cAMP concentrations in cortex homogenates from vehicle, AOM and AOM + betulinic acid-treated mice at coma. (D) H&E stained liver sections from vehicle, AOM and AOM + betulinic acid-treated mice at coma. * = p<0.05 compared to AOM.
Table 1.
Serum liver enzymes for treated mice
| Bilirubin (nmol/ml) | ALT (U/L) | |
|---|---|---|
| Vehicle | 1.252 ± 0.352 | 37.613 ± 3.382 |
| AOM | 121.123 ± 6.516 * | 346.078 ± 2.246 * |
| AOM + betulinic acid | 193.855 ± 14.691 * # | 517.761 ± 8.272 * # |
= p<0.05 compared to vehicle,
= p<0.05 compared to AOM
n = 4 mice per group with all mice used for serum liver enzyme analyses
Betulinic acid treatment reduces neuroinflammation
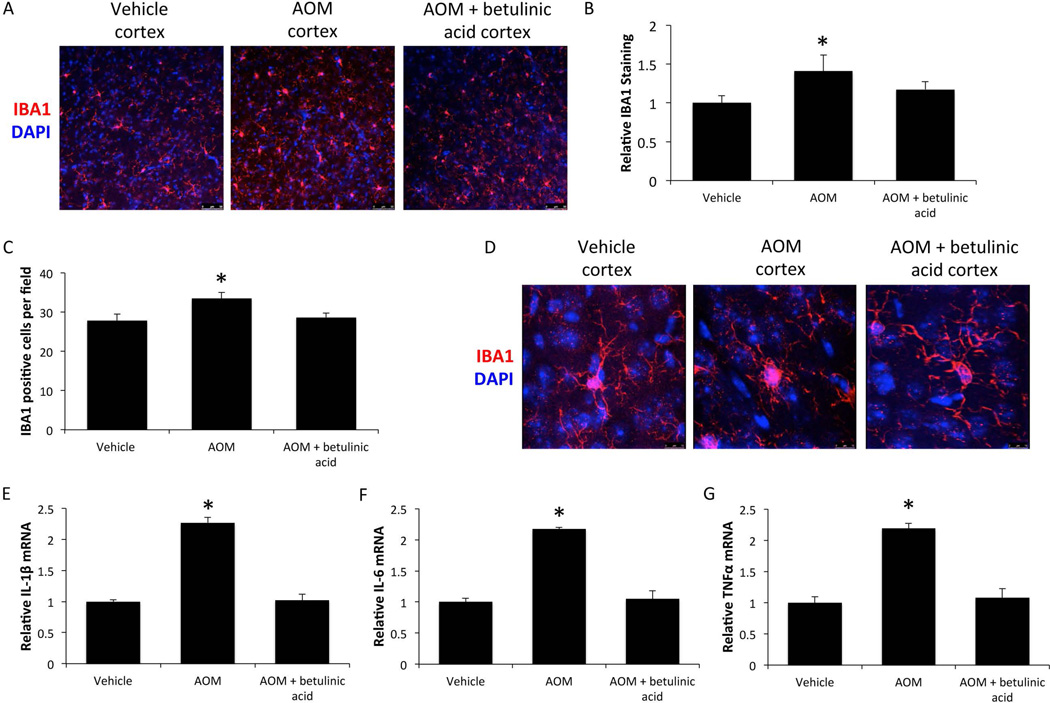
Field fluorescence images in the frontal cortex for the microglia marker IBA1 demonstrated that AOM-treated mice had a significant elevation of IBA1 immunoreactivity compared to vehicle, indicative of microgliosis, which was reduced in AOM-treated mice infused with betulinic acid (figures 3A and 3B). In addition, IBA1 positive cells per field were significantly increased in AOM-treated mice and this proliferation of microglia was attenuated in AOM-treated mice infused with betulinic acid (figure 3C). Individual microglia were also imaged and showed that microglia from vehicle-treated mice have ramified processes and a small cell body. However, in AOM-treated mice the processes are retracted and the cell body is enlarged, indicating that the microglia are in an activated state. Interestingly, in AOM-treated mice infused with betulinic acid, microglia have morphology that more closely resembles those in vehicle-treated mice, indicating that their microglia are more quiescent (figure 3D). In order to see if these changes in IBA1 staining and microglia activation led to functional changes in proinflammatory cytokines, IL-1β, IL-6 and TNFα mRNA expression was assessed. Mice treated with AOM had significant elevations of all 3 proinflammatory cytokines compared to vehicle, and the elevations observed in AOM was attenuated by pretreatment with betulinic acid (figures 3E, 3F, and 3G).
Figure 3. Microglia activation is reduced by betulinic acid treatment in AOM mice.
(A) Representative cortical IBA1 immunofluorescence images in mice treated with vehicle, AOM and AOM + betulinic acid at the coma timepoint. (B) Quantification of IBA1 immunofluorescence in the cortex of vehicle, AOM and AOM + betulinic acid-treated mice at coma. (C) Average counts of IBA1 positive cells per field in the cortex of vehicle, AOM and AOM + betulinic acid-treated mice at coma. (D) Z-stack merged immunofluorescence images of IBA1-stained cells to demonstrate microglia morphology in mice at the coma timepoint. (E) IL-1β mRNA expression in cortex of vehicle, AOM and AOM + betulinic acid-treated mice at coma. (F) Cortical IL-6 mRNA expression in vehicle, AOM and AOM + betulinic acid-treated mice at coma. (G) TNFα mRNA expression in the cortex of mice treated with vehicle, AOM and AOM + ICV betulinic acid at coma. * = p<0.05 compared to vehicle.
TGR5 expression is found in neurons and microglia
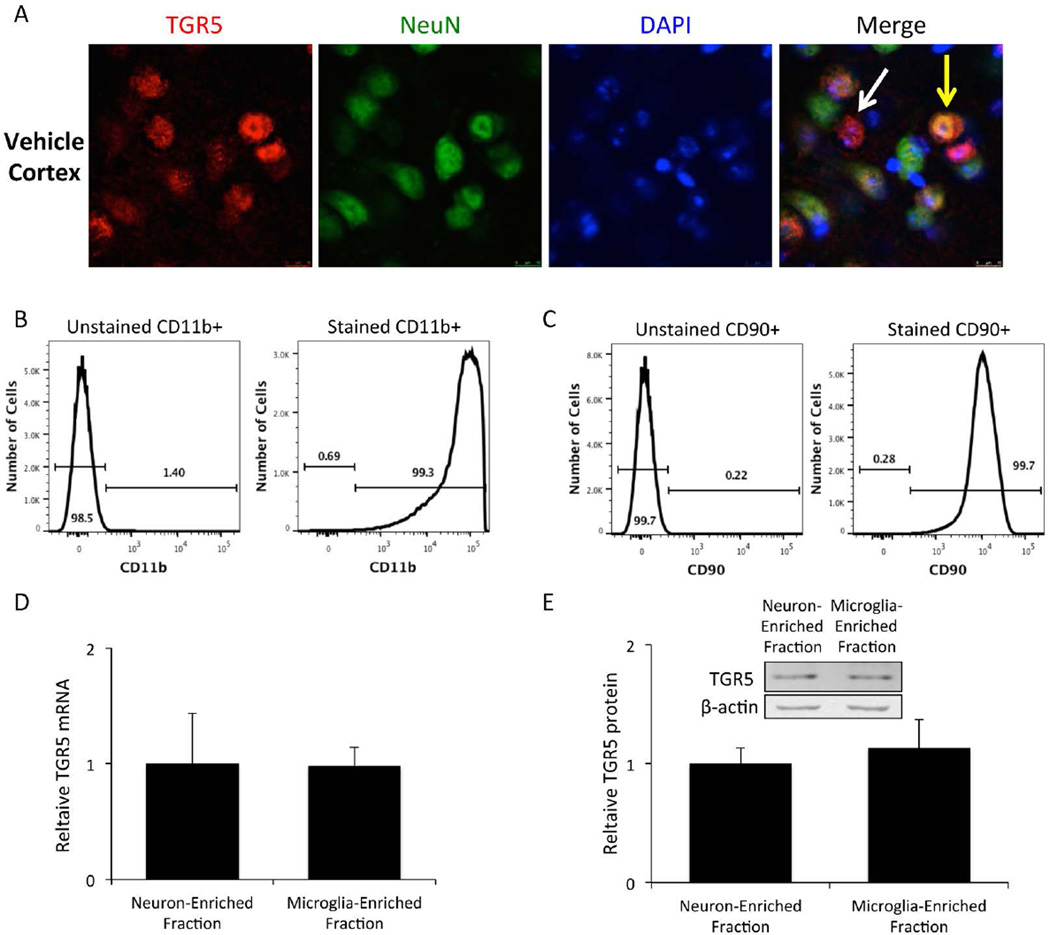
TGR5 cellular localization was assessed in the cortex of C57Bl/6 mice and was found to be expressed in neurons (yellow arrow) as well as other non-neuronal cell types (white arrow) (figure 4A). In order to determine the relative TGR5 protein and mRNA expression in neurons and microglia, mouse brains were homogenized and cell fractions enriched in neurons or microglia were isolated using CD11b and GLAST immunoprecipitation. The CD11b fraction was the microglia-enriched fraction, while cells not pulled down by either CD11b or GLAST immunoprecipitation were used for the neuron-enriched fraction. Purity of the microglia-enriched fraction as assessed by CD11b immunoreactivity was found to be around 99.3% (figure 4B) while the purity of the neuron-enriched fraction as measured by CD90 immunoreactivity was determined to be 99.7% (figure 4C). These two cellular fractions were homogenized and assayed to determine that they have comparable TGR5 mRNA expression (figure 4D) and TGR5 protein expression (figure 4E).
Figure 4. Isolated microglia and neurons have similar expression of TGR5.
(A) C57Bl/6 mice express TGR5 (red) in the cortex. Merged images have a yellow arrow pointing to a TGR5 positive cell that expresses NeuN (green) and a white arrow pointing to a TGR5 positive cell without NeuN expression. (B) Flow cytometry measurement of CD11b-PE fluorescence in unstained and stained cells isolated from whole brain homogenates via CD11b immunoprecipitation. (C) CD90-PE fluorescence measurement via flow cytometry in unstained and stained cells isolated from whole brain homogenates. (D) TGR5 mRNA expression in the neuron-enriched fraction and the microglia enriched fraction. (E) TGR5 protein expression and representative immunoblots in the neuron-enriched fraction and the microglia enriched fraction.
TGR5 activation reduces CCL2 release form primary neurons
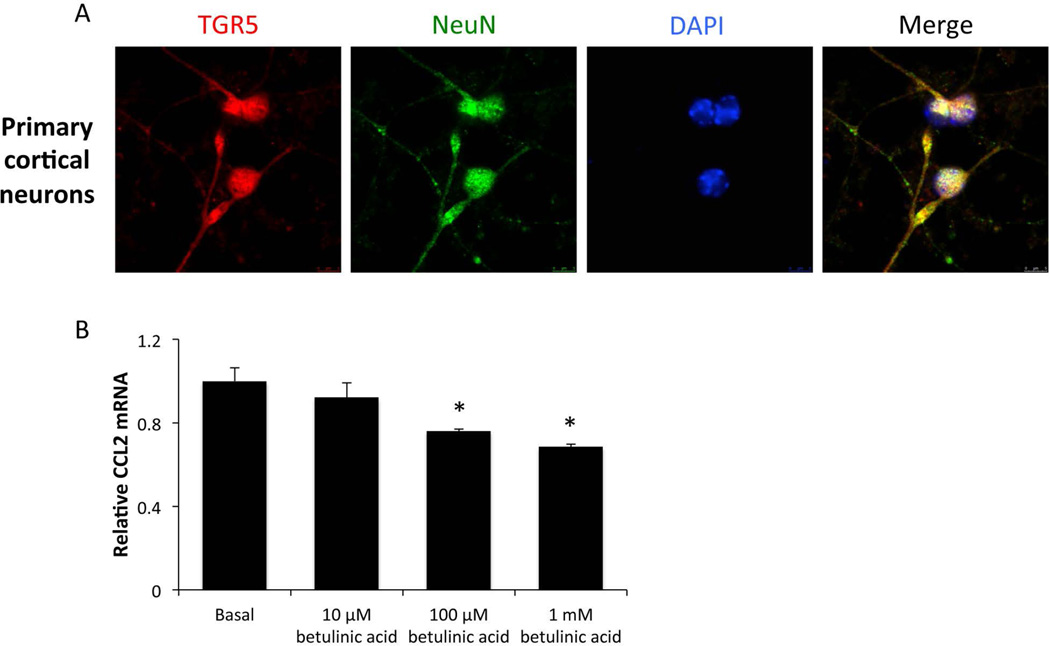
As TGR5 was expressed at high levels in neurons isolated from live C57Bl/6 mice, we assessed the role that neurons from the cerebral cortex may play in mitigating the neuroinflammatory response that contributes to the development of HE. Isolated primary neurons from C57Bl/6 pups were plated on coverslips and immunofluorescence staining for TGR5 and the neuron cell marker NeuN was performed. NeuN was expressed in almost all cells and TGR5 was found in all cells that expressed this cell marker (figure 5A). Next, neurons were plated in 12-well plates and treated with increasing concentrations of betulinic acid. When neurons were treated with 100 µM and 1 mM of betulinic acid, mRNA expression of CCL2, a chemokine previously shown to promote HE pathology (McMillin et al. 2014a), was significantly suppressed (figure 5B). This downregulation of CCL2 mRNA led to a suppression of CCL2 in the supernatants of these treated neurons (data not shown).
Figure 5. TGR5 agonism reduces chemokine expression in primary neurons.
(A) Immunofluorescence for TGR5 (red) and NeuN (green) in isolated primary neurons with DAPI (blue) used as a nuclear counterstain. (B) Isolated primary neurons were treated with indicated concentrations of betulinic acid for 24 hours and mRNA expression of CCL2 was assessed. * = p<0.05 compared to basal neurons.
Microglia cell lines have reduced inflammation following TGR5 activation
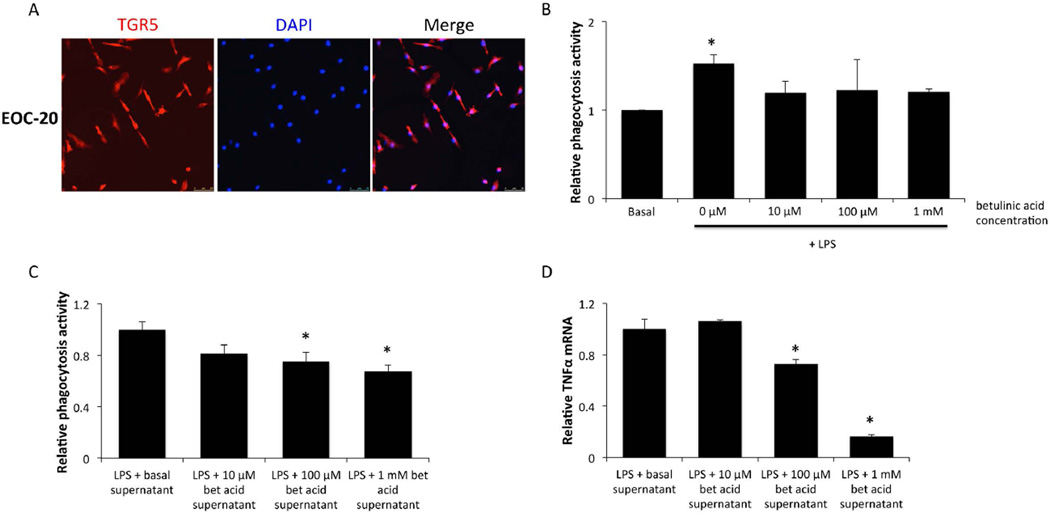
EOC-20 cells are primary microglia that underwent a spontaneous mutation following prolonged culture in the quiescent state to become immortalized (Walker et al. 1995). EOC-20 cells express TGR5 protein along their cell membranes (figure 6A). Interestingly, treating EOC-20 cells primed with a lipopolysaccharide (LPS) stimulation of 200ng/ml with betulinic acid significantly reduces the phagocytosis activity of these cells (figure 6B). However, treatment with betulinic acid had little effect on the LPS-induced cytokine production from EOC-20 cells (data not shown), indicating that paracrine signaling may be involved to mimic the strong effects of betulinic acid treatment observed in vivo. To investigate this, supernatants from primary neurons treated with betulinic acid for 24 hours were added onto EOC-20 cells primed with LPS for 24 hours and this treatment was found to reduce phagocytosis with increasing doses of betulinic acid (figure 6C). Interestingly, treatment of EOC-20 cells with the supernatants from betulinic acid-treated neurons was also able to reduce TNFα mRNA expression in a dose-dependent manner (figure 6D).
Figure 6. TGR5 is expressed in EOC-20 cells and have reduced phagocytic activity following betulinic acid treatment.
(A) TGR5 (red) immunofluorescence images in EOC-20 cells with DAPI (blue) used as a nuclear counterstain. (B) Relative phagocytosis as measured by fluorescence of engulfed fluorescent E.coli bioparticles in EOC-20 cells treated with 200ng/ml LPS and indicated doses of betulinic acid for 24 hours. (C) Relative phagocytosis measured by fluorescence of engulfed fluorescent E.coli bioparticles in EOC-20 cells that were treated for 24 hours with LPS and supplemented with supernatants from primary neurons treated with betulinic acid. (D) TNFα mRNA expression in EOC-20 cells that were treated for 24 hours with LPS and supernatants from betulinic acid-treated primary neurons. * = p<0.05 compared to basal EOC-20 cells.
Discussion
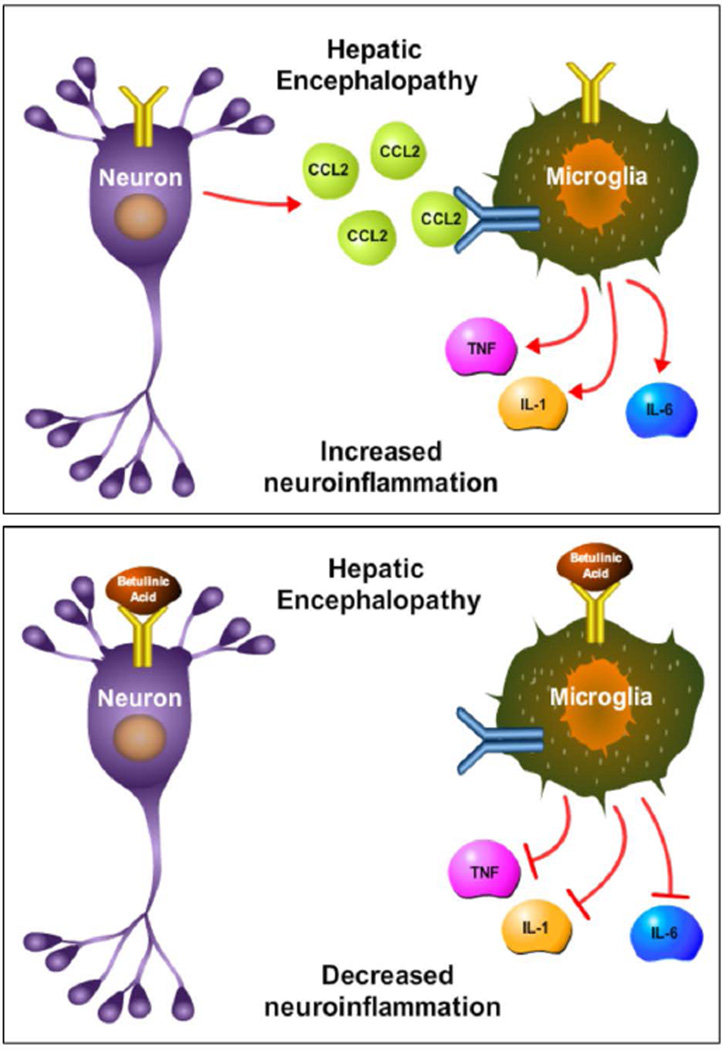
The consequences of TGR5 signaling during HE had previously not been investigated. The current study identified that TGR5 is present in the cortex of C57Bl/6 mice and is upregulated in the brain following AOM-induced ALF. This upregulation appears to be protective, as treatment of AOM mice with the TGR5 agonist betulinic acid reduces neurological decline, lengthens the time taken to reach coma, and reduces neuroinflammation compared to AOM-treated mice infused with vehicle. TGR5 is expressed to a similar degree in microglia and neurons and betulinic acid treatment reduces phagocytosis of the EOC-20 microglia cell line and also reduces neuronal CCL2 expression while implicating neuron-microglia signaling crosstalk that has been shown in other studies (McMillin et al. 2014a). Taken together, this study found that TGR5 signaling is protective against the neurological decline associated with AOM-induced HE by reducing neuroinflammation. A working model of these findings is presented in figure 7.
Figure 7. Working model of TGR5 signaling during HE.
Top figure: In the neuroinflammatory state associated with HE, CCL2 is upregulated in neurons and released binding chemokine receptors on microglia. This leads to chemokine receptor-mediated signaling, which results in the release of proinflammatory cytokines and subsequent neuroinflammation. Bottom figure: TGR5 is activated by betulinic acid on neurons and microglia. In neurons, this leads to a reduction of neuronal CCL2 expression, while in microglia this leads to reduced phagocytosis activity. Together, betulinic acid treatment reduces microglia activation and suppresses the production of the proinflammatory cytokines IL-1β, IL-6, and TNFα. Together, this indicates that TGR5 may be a target to reduce neuroinflammation during HE. In this figure IL-1 is used to represent IL-1β and TNF is used to represent TNFα.
Investigations into TGR5 mRNA expression have identified that this receptor is expressed in both mouse and human brain (Maruyama et al. 2006, Vassileva et al. 2006, Kawamata et al. 2003). The current study found that TGR5 was present and elevated in the cortex of AOM-treated mice compared to vehicle. Other researchers have studied TGR5 expression in isolated primary astrocytes and have found a downregulation of TGR5 due to the actions of ammonia on this receptor (Keitel et al. 2010). The current study does not investigate the interaction of ammonia with inflammation in the context of TGR5 signaling. As ammonia has been demonstrated to be elevated during HE (Bernal et al. 2007) and ammonia contributes to neuroinflammation and the pathology of HE (Jover et al. 2006) this is an area that warrants further investigation. That being said, in the AOM model of ALF, ammonia levels are significantly elevated in the brain only at the advanced stages of HE progression (after loss of righting reflex) (Matkowskyj et al. 1999), whereas the TGR5 data presented here are the observations taken at time points prior to the onset of hyperammonemia, indicating that factors outside of ammonia may be the primary factors leading to TGR5 upregulation. Indeed, when assessing cortical TGR5 expression at coma in our model, we also observe decreased TGR5 expression in the cortex compared to earlier time points (data not shown), however our studies are more focused on the early changes in the brain that begin prior to the onset of overt neurological symptoms of HE.
To date, few studies have investigated the cellular localization of TGR5 in the brain, however one report investigating TGR5 identified that this receptor is expressed in neurons and in astrocytes in the rat brain (Keitel et al. 2010). To our knowledge, the current study represents the first assessment of TGR5 expression in microglia in the brain, however monocyte populations from other tissue have been demonstrated to have relatively high expression of this receptor (Kawamata et al. 2003). In this study, pull down of microglia using immunoprecipitation with CD11b antibodies in brain homogenates demonstrated that microglia do express TGR5 at levels similar to neurons in the brain. Immunofluorescence supports these findings as control C57Bl/6 mice express TGR5 in cortical neurons as well as in some glial cell populations. This supports the findings of others and elucidates the importance of understanding TGR5 signaling in the brain as this receptor is expressed in a majority of neural cell populations.
The current study identified that increasing TGR5 activity in the brain by central administration of betulinic acid was protective against the neurological decline associated with HE and prolonged the time taken for AOM-treated mice to reach coma. Betulinic acid was chosen as the TGR5 agonist for this study as it exhibits less interaction with other receptors unlike bile acids and neurosteroids (Genet et al. 2010, Schaap et al. 2014). Interestingly, the mice administered betulinic acid had increased liver damage, indicating that this treatment conferred no hepatic protection to the mice. This worsening of liver function is likely due to the mice taking a greater period of time to reach coma from neurological dysfunction and therefore the hepatotoxic effects of AOM, and subsequent liver pathology, had greater time to develop. This conclusion is supported due to the low concentration of drug administered directly into the brain when compared to the concentration of betulinic acid that is necessary when administered systemically to generate hepatoprotective effects (Wan et al. 2013). That being said, it may be interesting to investigate how betulinic acid could affect liver function if administered systemically in the AOM model of ALF and this is a topic of ongoing investigation. Other researchers have assessed the role of betulinic acid in non-alcoholic fatty liver disease and found that betulinic acid treatment in isolated hepatocytes from rats fed high fat diets reduces lipogenesis via inhibition of sterol regulatory element-binding transcription factor 1 activity (Quan et al. 2013). Also, in a model of ALF in mice employing an injection of LPS and D-galactosamine, betulinic acid was found to reduce the elevations of ALT and AST, and activate BCL-2 leading to reduced apoptosis of hepatocytes (Zheng et al. 2011). In addition to this, betulinic acid has been demonstrated to prevent alcohol-induced liver injury by increasing levels of superoxide dismutase and catalase, potent antioxidant enzymes (Yi et al. 2014). As betulinic acid has the capability to reduce oxidative and nitrosative stress (Steinkamp-Fenske et al. 2007, Heiss et al. 2014) that is present in patients with HE (Gorg et al. 2010), investigating the exact effects of betulinic acid on this pathological process in the brain during HE is an area needing further investigation.
TGR5 activation has previously been shown to modulate inflammatory processes from other monocyte cell types. Treatment of Kupffer cells with TGR5 agonists was found to reduce IL-1α, IL-1β, IL-6, and TNFα elevations that occurred following LPS treatment (Keitel et al. 2008). Also, treatment of in vitro differentiated macrophages with TGR5 agonists was found to reduce their production of TNFα (Yoneno et al. 2013). Additionally, treatment with a dual TGR5/farsenoid X receptor agonist for 6 weeks in mice with non-alcoholic fatty liver disease led to increased Ly6Clow intrahepatic monocytes populations, which are an anti-inflammatory phenotype (McMahan et al. 2013). In fact, this anti-inflammatory effect was observed in our study as increased TGR5 activity via betulinic acid was found to reduce microglia activation and proliferation, as well as reducing proinflammatory cytokine production. Activation of microglia and subsequent inflammation has been implicated in HE due to both acute and chronic liver injury models (McMillin et al. 2014a, Jiang et al. 2009c, D’Mello et al. 2009, Jiang et al. 2009b). Interestingly, treatments that are aimed at reducing neuroinflammation and microglia activity, such as the use of therapeutic hypothermia or the use of minocycline, have been shown to be protective in HE from ALF (Jiang et al. 2009b, Jiang et al. 2009a). These previous studies and the current work demonstrate that reducing microglia activation is an important therapeutic target for the development of novel HE treatment strategies
TGR5 in the brain is currently viewed as a neurosteroid receptor responding to allopregnanolone and other neurosteroids (Keitel et al. 2010). Allopregnanolone is synthesized in both neuronal and glial cells and its production is upregulated in the setting of hyperammonemia (Cauli et al. 2009b). The upregulation of allopregnanolone is thought to be derived from increased activity of the mitochondrial peripheral type benzodiazepine receptor (also known as translocator protein), which facilitates cholesterol entry into the mitochondria and promotes steroidogenesis (Ahboucha & Butterworth 2007). This protein has been shown to be upregulated in the frontal cortex and caudate nucleus of patients with HE, and increased expression correlated with the presence of HE and Alzheimer’s type II astrocytes (Lavoie et al. 1990, Ahboucha & Butterworth 2007). In general, it is thought that neurosteroids contribute to HE pathology due to their allosteric modulation of GABAA receptors and subsequent increased inhibitory tone (Cauli et al. 2009b). As we observe an upregulation of TGR5 expression in our model, it would be possible that neurosteroids can then activate and bind TGR5 and could contribute to the effects observed in this study. However, based upon on the observation that cAMP concentrations are only elevated following betulinic acid infusion, there is not strong support for increased TGR5 activation by allopregnanolone or other neurosteroids during HE induced by AOM injection. However, this is still a relatively preliminary examination into the crosstalk of neurosteroids and other TGR5 agonists during HE and other neuroinflammatory states. Therefore, increased understanding and further studies are necessary to better identify the full effects of neurosteroids and TGR5 signaling during HE.
The current study demonstrated that TGR5 was upregulated in a murine model of HE caused by ALF. Interestingly, treatment with the TGR5 agonist betulinic acid was neuroprotective and reduced neuroinflammation identified to be present with HE in AOM-treated mice. Our in vitro data support that TGR5 agonist activity leads to reduced chemokine secretion from primary neurons which leads to reduced phagocytic activity and reduced cytokine production in microglia. Together, the data support that treatments aimed at increasing TGR5 activity could be a beneficial therapeutic target for patients with HE by mediating the neuroinflammatory challenges that occur in this disorder.
Acknowledgments
Acknowledgements/Conflict of interest disclosure
This work was completed with support from the Veterans Health Administration and with resources and the use of facilities at the Central Texas Veterans Health Care System, Temple, Texas. The views are those of the authors and do not necessarily represent the views of the Department of Veterans Affairs. This study was funded by an NIH R01 award (DK082435), a VA Merit award (BX002638-01) and a Scott & White Intramural grant award (No: 050339) to Dr. DeMorrow. The authors would like to acknowledge Cheryl Galindo for technical assistance on this project.
Abbreviations
- ALF
acute liver failure
- ALT
alanine aminotransferase
- AOM
azoxymethane
- AST
aspartate aminotransferase
- cAMP
cyclic adenosine monophosphate
- CCL2
chemokine ligand 2
- DAPI
4’,6-diamidino-2-phenylindole
- GAPDH
glyceraldehyde 3-phosphate dehydrogenase
- GLAST
glutamate aspartate transporter
- Gpbar-1
G protein-coupled bile acid receptor 1
- HE
Hepatic encephalopathy
- IBA-1
ionized calcium-binding adapter molecule 1
- ICV
intracerebroventricular
- ip
intraperitoneal
- IL
interleukin
- LPS
lipopolysaccharide
- PE
phycoerythrin
- PFA
paraformaldehyde
- SEM
standard error of the mean
- TGR5
Takeda G-protein coupled receptor 5
- TNFα
tumor necrosis factor alpha
References
- Ahboucha S. Neurosteroids and hepatic encephalopathy: an update on possible pathophysiologic mechanisms. Current molecular pharmacology. 2011;4:1–13. doi: 10.2174/1874467211104010001. [DOI] [PubMed] [Google Scholar]
- Ahboucha S, Butterworth RF. The neurosteroid system: an emerging therapeutic target for hepatic encephalopathy. Metab Brain Dis. 2007;22:291–308. doi: 10.1007/s11011-007-9065-2. [DOI] [PubMed] [Google Scholar]
- Ahboucha S, Jiang W, Chatauret N, Mamer O, Baker GB, Butterworth RF. Indomethacin improves locomotor deficit and reduces brain concentrations of neuroinhibitory steroids in rats following portacaval anastomosis. Neurogastroenterology and motility : the official journal of the European Gastrointestinal Motility Society. 2008;20:949–957. doi: 10.1111/j.1365-2982.2008.01132.x. [DOI] [PubMed] [Google Scholar]
- Ahboucha S, Layrargues GP, Mamer O, Butterworth RF. Increased brain concentrations of a neuroinhibitory steroid in human hepatic encephalopathy. Annals of neurology. 2005;58:169–170. doi: 10.1002/ana.20534. [DOI] [PubMed] [Google Scholar]
- Belanger M, Desjardins P, Chatauret N, Rose C, Butterworth RF. Mild hypothermia prevents brain edema and attenuates up-regulation of the astrocytic benzodiazepine receptor in experimental acute liver failure. J Hepatol. 2005;42:694–699. doi: 10.1016/j.jhep.2004.12.029. [DOI] [PubMed] [Google Scholar]
- Bemeur C, Qu H, Desjardins P, Butterworth RF. IL-1 or TNF receptor gene deletion delays onset of encephalopathy and attenuates brain edema in experimental acute liver failure. Neurochem Int. 2010;56:213–215. doi: 10.1016/j.neuint.2009.11.010. [DOI] [PubMed] [Google Scholar]
- Bernal W, Hall C, Karvellas CJ, Auzinger G, Sizer E, Wendon J. Arterial ammonia and clinical risk factors for encephalopathy and intracranial hypertension in acute liver failure. Hepatology. 2007;46:1844–1852. doi: 10.1002/hep.21838. [DOI] [PubMed] [Google Scholar]
- Butterworth RF. Hepatic encephalopathy: a central neuroinflammatory disorder? Hepatology. 2011;53:1372–1376. doi: 10.1002/hep.24228. [DOI] [PubMed] [Google Scholar]
- Cauli O, Mansouri MT, Agusti A, Felipo V. Hyperammonemia increases GABAergic tone in the cerebellum but decreases it in the rat cortex. Gastroenterology. 2009a;136:1359–1367. doi: 10.1053/j.gastro.2008.12.057. e1351–1352. [DOI] [PubMed] [Google Scholar]
- Cauli O, Rodrigo R, Llansola M, et al. Glutamatergic and gabaergic neurotransmission and neuronal circuits in hepatic encephalopathy. Metab Brain Dis. 2009b;24:69–80. doi: 10.1007/s11011-008-9115-4. [DOI] [PubMed] [Google Scholar]
- D’Mello C, Le T, Swain MG. Cerebral microglia recruit monocytes into the brain in response to tumor necrosis factoralpha signaling during peripheral organ inflammation. J Neurosci. 2009;29:2089–2102. doi: 10.1523/JNEUROSCI.3567-08.2009. [DOI] [PMC free article] [PubMed] [Google Scholar]
- DeMorrow S, Francis H, Gaudio E, et al. The endocannabinoid anandamide inhibits cholangiocarcinoma growth via activation of the noncanonical Wnt signaling pathway. Am J Physiol Gastrointest Liver Physiol. 2008;295:G1150–G1158. doi: 10.1152/ajpgi.90455.2008. [DOI] [PMC free article] [PubMed] [Google Scholar]
- DeMorrow S, Glaser S, Francis H, Venter J, Vaculin B, Vaculin S, Alpini G. Opposing actions of endocannabinoids on cholangiocarcinoma growth: Recruitment of fas and fas ligand to lipid rafts. J Biol Chem. 2007;282:13098–13113. doi: 10.1074/jbc.M608238200. [DOI] [PubMed] [Google Scholar]
- Ferenci P, Lockwood A, Mullen K, Tarter R, Weissenborn K, Blei AT. Hepatic encephalopathy--definition, nomenclature, diagnosis, and quantification: final report of the working party at the 11th World Congresses of Gastroenterology, Vienna, 1998. Hepatology. 2002;35:716–721. doi: 10.1053/jhep.2002.31250. [DOI] [PubMed] [Google Scholar]
- Frampton G, Invernizzi P, Bernuzzi F, et al. Interleukin-6-driven progranulin expression increases cholangiocarcinoma growth by an Akt-dependent mechanism. Gut. 2012;61:268–277. doi: 10.1136/gutjnl-2011-300643. [DOI] [PMC free article] [PubMed] [Google Scholar]
- Genet C, Strehle A, Schmidt C, et al. Structure-activity relationship study of betulinic acid, a novel and selective TGR5 agonist, and its synthetic derivatives: potential impact in diabetes. J Med Chem. 2010;53:178–190. doi: 10.1021/jm900872z. [DOI] [PubMed] [Google Scholar]
- Gorg B, Qvartskhava N, Bidmon HJ, Palomero-Gallagher N, Kircheis G, Zilles K, Haussinger D. Oxidative stress markers in the brain of patients with cirrhosis and hepatic encephalopathy. Hepatology. 2010;52:256–265. doi: 10.1002/hep.23656. [DOI] [PMC free article] [PubMed] [Google Scholar]
- He J, Evans CO, Hoffman SW, Oyesiku NM, Stein DG. Progesterone and allopregnanolone reduce inflammatory cytokines after traumatic brain injury. Experimental neurology. 2004;189:404–412. doi: 10.1016/j.expneurol.2004.06.008. [DOI] [PubMed] [Google Scholar]
- Heiss EH, Kramer MP, Atanasov AG, Beres H, Schachner D, Dirsch VM. Glycolytic switch in response to betulinic acid in non-cancer cells. PLoS One. 2014;9:e115683. doi: 10.1371/journal.pone.0115683. [DOI] [PMC free article] [PubMed] [Google Scholar]
- Itzhak Y, Roig-Cantisano A, Dombro RS, Norenberg MD. Acute liver failure and hyperammonemia increase peripheral-type benzodiazepine receptor binding and pregnenolone synthesis in mouse brain. Brain Res. 1995;705:345–348. doi: 10.1016/0006-8993(95)01244-3. [DOI] [PubMed] [Google Scholar]
- Jiang W, Desjardins P, Butterworth RF. Cerebral inflammation contributes to encephalopathy and brain edema in acute liver failure: protective effect of minocycline. J Neurochem. 2009a;109:485–493. doi: 10.1111/j.1471-4159.2009.05981.x. [DOI] [PubMed] [Google Scholar]
- Jiang W, Desjardins P, Butterworth RF. Direct evidence for central proinflammatory mechanisms in rats with experimental acute liver failure: protective effect of hypothermia. J Cereb Blood Flow Metab. 2009b;29:944–952. doi: 10.1038/jcbfm.2009.18. [DOI] [PubMed] [Google Scholar]
- Jiang W, Desjardins P, Butterworth RF. Minocycline attenuates oxidative/nitrosative stress and cerebral complications of acute liver failure in rats. Neurochem Int. 2009c;55:601–605. doi: 10.1016/j.neuint.2009.06.001. [DOI] [PubMed] [Google Scholar]
- Jover R, Rodrigo R, Felipo V, et al. Brain edema and inflammatory activation in bile duct ligated rats with diet-induced hyperammonemia: A model of hepatic encephalopathy in cirrhosis. Hepatology. 2006;43:1257–1266. doi: 10.1002/hep.21180. [DOI] [PubMed] [Google Scholar]
- Kawamata Y, Fujii R, Hosoya M, et al. A G protein-coupled receptor responsive to bile acids. J Biol Chem. 2003;278:9435–9440. doi: 10.1074/jbc.M209706200. [DOI] [PubMed] [Google Scholar]
- Keitel V, Donner M, Winandy S, Kubitz R, Haussinger D. Expression and function of the bile acid receptor TGR5 in Kupffer cells. Biochem Biophys Res Commun. 2008;372:78–84. doi: 10.1016/j.bbrc.2008.04.171. [DOI] [PubMed] [Google Scholar]
- Keitel V, Gorg B, Bidmon HJ, Zemtsova I, Spomer L, Zilles K, Haussinger D. The bile acid receptor TGR5 (Gpbar-1) acts as a neurosteroid receptor in brain. Glia. 2010;58:1794–1805. doi: 10.1002/glia.21049. [DOI] [PubMed] [Google Scholar]
- Ksontini R, Colagiovanni DB, Josephs MD, et al. Disparate roles for TNF-alpha and Fas ligand in concanavalin A-induced hepatitis. J Immunol. 1998;160:4082–4089. [PubMed] [Google Scholar]
- Lavoie J, Layrargues GP, Butterworth RF. Increased densities of peripheral-type benzodiazepine receptors in brain autopsy samples from cirrhotic patients with hepatic encephalopathy. Hepatology. 1990;11:874–878. doi: 10.1002/hep.1840110524. [DOI] [PubMed] [Google Scholar]
- Livak KJ, Schmittgen TD. Analysis of relative gene expression data using real-time quantitative PCR and the 2(−Delta Delta C(T)) Method. Methods. 2001;25:402–408. doi: 10.1006/meth.2001.1262. [DOI] [PubMed] [Google Scholar]
- Maruyama T, Tanaka K, Suzuki J, Miyoshi H, Harada N, Nakamura T, Miyamoto Y, Kanatani A, Tamai Y. Targeted disruption of G protein-coupled bile acid receptor 1 (Gpbar1/M-Bar) in mice. J Endocrinol. 2006;191:197–205. doi: 10.1677/joe.1.06546. [DOI] [PubMed] [Google Scholar]
- Matkowskyj KA, Marrero JA, Carroll RE, Danilkovich AV, Green RM, Benya RV. Azoxymethane-induced fulminant hepatic failure in C57BL/6J mice: characterization of a new animal model. Am J Physiol. 1999;277:G455–G462. doi: 10.1152/ajpgi.1999.277.2.G455. [DOI] [PubMed] [Google Scholar]
- McMahan RH, Wang XX, Cheng LL, et al. Bile acid receptor activation modulates hepatic monocyte activity and improves nonalcoholic fatty liver disease. J Biol Chem. 2013;288:11761–11770. doi: 10.1074/jbc.M112.446575. [DOI] [PMC free article] [PubMed] [Google Scholar]
- McMillin M, Frampton G, Thompson M, Galindo C, Standeford H, Whittington E, Alpini G, DeMorrow S. Neuronal CCL2 is upregulated during hepatic encephalopathy and contributes to microglia activation and neurological decline. J Neuroinflammation. 2014a;11:121. doi: 10.1186/1742-2094-11-121. [DOI] [PMC free article] [PubMed] [Google Scholar]
- McMillin M, Galindo C, Pae HY, Frampton G, Di Patre PL, Quinn M, Whittington E, DeMorrow S. Gli1 activation and protection against hepatic encephalopathy is suppressed by circulating transforming growth factor beta1 in mice. J Hepatol. 2014b;61:1260–1266. doi: 10.1016/j.jhep.2014.07.015. [DOI] [PMC free article] [PubMed] [Google Scholar]
- Norenberg MD, Itzhak Y, Bender AS. The peripheral benzodiazepine receptor and neurosteroids in hepatic encephalopathy. Advances in experimental medicine and biology. 1997;420:95–111. doi: 10.1007/978-1-4615-5945-0_7. [DOI] [PubMed] [Google Scholar]
- Quan HY, Kim do Y, Kim SJ, Jo HK, Kim GW, Chung SH. Betulinic acid alleviates non-alcoholic fatty liver by inhibiting SREBP1 activity via the AMPK-mTOR-SREBP signaling pathway. Biochem Pharmacol. 2013;85:1330–1340. doi: 10.1016/j.bcp.2013.02.007. [DOI] [PubMed] [Google Scholar]
- Rolando N, Harvey F, Brahm J, Philpott-Howard J, Alexander G, Gimson A, Casewell M, Fagan E, Williams R. Prospective study of bacterial infection in acute liver failure: an analysis of fifty patients. Hepatology. 1990;11:49–53. doi: 10.1002/hep.1840110110. [DOI] [PubMed] [Google Scholar]
- Rolando N, Wade J, Davalos M, Wendon J, Philpott-Howard J, Williams R. The systemic inflammatory response syndrome in acute liver failure. Hepatology. 2000;32:734–739. doi: 10.1053/jhep.2000.17687. [DOI] [PubMed] [Google Scholar]
- Schaap FG, Trauner M, Jansen PL. Bile acid receptors as targets for drug development. Nature reviews. Gastroenterology & hepatology. 2014;11:55–67. doi: 10.1038/nrgastro.2013.151. [DOI] [PubMed] [Google Scholar]
- Steinkamp-Fenske K, Bollinger L, Xu H, Yao Y, Horke S, Forstermann U, Li H. Reciprocal regulation of endothelial nitric-oxide synthase and NADPH oxidase by betulinic acid in human endothelial cells. J Pharmacol Exp Ther. 2007;322:836–842. doi: 10.1124/jpet.107.123356. [DOI] [PubMed] [Google Scholar]
- Vaquero J, Polson J, Chung C, Helenowski I, Schiodt FV, Reisch J, Lee WM, Blei AT. Infection and the progression of hepatic encephalopathy in acute liver failure. Gastroenterology. 2003;125:755–764. doi: 10.1016/s0016-5085(03)01051-5. [DOI] [PubMed] [Google Scholar]
- Vassileva G, Golovko A, Markowitz L, et al. Targeted deletion of Gpbar1 protects mice from cholesterol gallstone formation. Biochem J. 2006;398:423–430. doi: 10.1042/BJ20060537. [DOI] [PMC free article] [PubMed] [Google Scholar]
- Walker WS, Gatewood J, Olivas E, Askew D, Havenith CE. Mouse microglial cell lines differing in constitutive and interferon-gamma-inducible antigen-presenting activities for naive and memory CD4+ and CD8+ T cells. Journal of neuroimmunology. 1995;63:163–174. doi: 10.1016/0165-5728(95)00146-8. [DOI] [PubMed] [Google Scholar]
- Wan Y, Jiang S, Lian LH, Bai T, Cui PH, Sun XT, Jin XJ, Wu YL, Nan JX. Betulinic acid and betulin ameliorate acute ethanol-induced fatty liver via TLR4 and STAT3 in vivo and in vitro. International immunopharmacology. 2013;17:184–190. doi: 10.1016/j.intimp.2013.06.012. [DOI] [PubMed] [Google Scholar]
- Wright G, Shawcross D, Olde Damink SW, Jalan R. Brain cytokine flux in acute liver failure and its relationship with intracranial hypertension. Metab Brain Dis. 2007;22:375–388. doi: 10.1007/s11011-007-9071-4. [DOI] [PubMed] [Google Scholar]
- Yi J, Xia W, Wu J, Yuan L, Wu J, Tu D, Fang J, Tan Z. Betulinic acid prevents alcohol-induced liver damage by improving the antioxidant system in mice. Journal of veterinary science. 2014;15:141–148. doi: 10.4142/jvs.2014.15.1.141. [DOI] [PMC free article] [PubMed] [Google Scholar]
- Yoneno K, Hisamatsu T, Shimamura K, et al. TGR5 signalling inhibits the production of pro-inflammatory cytokines by in vitro differentiated inflammatory and intestinal macrophages in Crohn’s disease. Immunology. 2013;139:19–29. doi: 10.1111/imm.12045. [DOI] [PMC free article] [PubMed] [Google Scholar]
- Zheng ZW, Song SZ, Wu YL, Lian LH, Wan Y, Nan JX. Betulinic acid prevention of d-galactosamine/lipopolysaccharide liver toxicity is triggered by activation of Bcl-2 and antioxidant mechanisms. The Journal of pharmacy and pharmacology. 2011;63:572–578. doi: 10.1111/j.2042-7158.2010.01239.x. [DOI] [PubMed] [Google Scholar]


