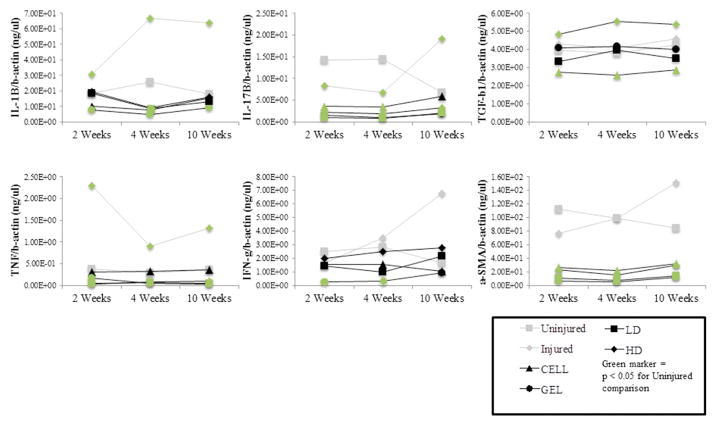
Figure 6.
Inflammatory and tissue remodeling gene expression. RT-PCR results for interleukin 1β, interleukin 17β, transforming growth factor β1, tumor necrosis factor, interferon γ and smooth muscle actin alpha at 2, 4 and 10 weeks following treatment for all control and treatment groups. Fold changes are reported with respect to human beta actin expression. Data are shown as mean ± standard deviation. Significant pair-wise comparisons to Uninjured Controls are indicated with green symbols (P < 0.05). All other significant pair-wise comparisons are provided in Supplementary Table C.

