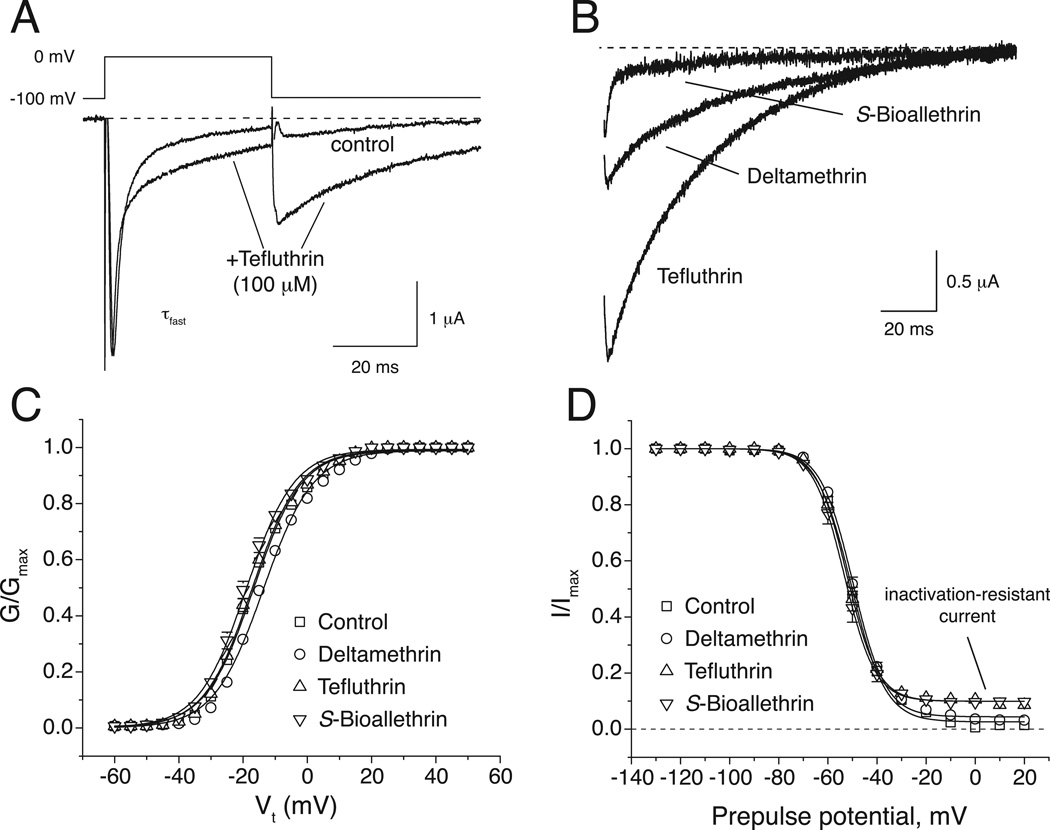
Fig. 1.
Action of pyrethroids on Nav1.6+β1+β2 sodium channels expressed in Xenopus oocytes (re-drawn from data in Tan and Soderlund, 2010). (A) Representative control and tefluthrin (100 µM)-modified sodium currents recorded from an oocyte expressing rat Nav1.6 sodium channels using the indicated depolarization protocol. The dashed line indicates zero current. (B) Representative sodium tail currents recorded from oocyte expressing rat Nav1.6 sodium channels following exposure to S-bioallethrin, tefluthrin or deltamethrin (100 µM). Traces show currents recorded beginning 0.5 ms after repolarization to −100 mV from a step depolarization to 0 mV. The dashed line indicates zero current. (C) Effects of S-bioallethrin, tefluthrin or deltamethrin (100 µM) on the voltage dependence of activation of rat Nav1.6 sodium channels expressed in oocytes. Conductances of peak transient sodium currents measured upon depolarization from −100 mV to a range of test potentials are plotted as a function of test potential. Values are means; of 19 (control), 4 (S-bioallethrin), 6 (tefluthrin) or 9 (deltamethrin) separate experiments with different oocytes; bars show SE values larger than the data point symbols. Conductance – voltage curves were fitted to mean conductance values using the Boltzmann equation. (D) Effects of S-bioallethrin, tefluthrin or deltamethrin (100 µM) on the voltage dependence of steady-state inactivation of rat Nav1.6 sodium channels expressed in oocytes. Amplitudes of peak transient currents obtained during a 40-ms test depolarization to 0 mV following 100-msec conditioning prepulses from −140 mV to a range of conditioning potenticals are plotted as a function of prepulse potential. Values are means of 19 (control), 4 (S-bioallethrin), 6 (tefluthrin) or 9 (deltamethrin) separate experiments with different oocytes; bars show SE values larger than the data point symbols. The dashed line indicates zero current (complete inactivation). Current -voltage curves were fitted to mean current amplitude values using the Boltzmann equation.

