

Abstract
In this brief report, we analyzed ecological correlates of risk of extinction for mammals endemic to China using phylogenetic eigenvector methods to control for the effect of phylogenetic inertia. Extinction risks were based on the International Union for Conservation of Nature (IUCN) Red List and ecological explanatory attributes that include range size and climatic variables. When the effect of phylogenetic inertia were controlled, climate became the best predictor for quantifying and evaluating extinction risks of endemic mammals in China, accounting for 13% of the total variation. Range size seems to play a trivial role, explaining ~1% of total variation; however, when non-phylogenetic variation partitioning analysis was done, the role of range size then explained 7.4% of total variation. Consequently, phylogenetic inertia plays a substantial role in increasing the explanatory power of range size on the extinction risks of mammals endemic to China. Limitations of the present study are discussed, with a focus on under-represented sampling of endemic mammalian species.
Keywords: Trait evolution, Macroevolution, Macroecology, Ecological processes and mechanisms
Species’ extinction risk is driven by multiple ecological factors (Cardillo et al, 2005, 2008), including small population size (Legendre et al, 2008), small range size (Harris & Pimm, 2008), large body size (Cardillo & Bromham, 2001) and degrading habitat conditions (Halley & Iwasa, 2011). One key focus of current macroecological studies is understanding the ecological correlates of species’ extinction risks, in order to both better understand change in demographics and to implement more effective conservation measures (Cooper et al, 2008; Keane et al, 2005; Reynolds et al, 2005).
Global patterns of the extinction risks of mammals have been well quantified (Cardillo et al, 2004, 2005, 2006; Jones et al, 2009), but it is unknown whether the relevant ecological determinants attributed to extinction risks of mammals on a global scale can be applied at regional or local scales. The central goal of the present study is to evaluate drivers of extinction risks of mammals at the regional scale, specifically examining the ecological causes of extinction risk for mammals endemic to China and accounting for phylogenetic inertia (Carrascal et al, 2008). There are over 200 known mammal species endemic to China, with the full distributional ranges only limited to the terrestrial boundaries of modern China. However, because of limited data access, only a subset of endemic mammals has been included in the present analysis, though I deal with the corresponding potential constraints.
MATERIALS AND METHODS
Data sets
Distributional records of endemic mammals were derived from the China Species Information Service (http://www.baohu.org/) and literature related to mammalian fauna of China (Smith & Xie, 2008; Wang, 2003). For the selected species, phylogeny was reconstructed from the previously established meta-phylogeny of global mammals (Bininda-Emonds et al, 2007). The tree for the subsequent analyses is presented in Figure 1. The threatened status of each species was obtained from the International Union for Conservation of Nature (IUCN; http://www.iucn.org/).
Figure 1.

The phylogeny of 53 mammals endemic to China (redrawn from Binind-Emonds et al, 2007)
Ecological variables
Range size for each endemic mammal was calculated using digital distribution range maps (http://www.Iucnredlist.org/technical-documents/spatial-data). Climatic variables included precipitation, minimal temperature, maximal temperature, mean temperature, evaporation, humidity and solar radiation. These data are interpolations of observed data collected from 1950−2000. Data were calculated and exacted from grid cells with the presence of the species using the WorldClim database (http://www.worldclim.org). Data are available from the author upon request.
Data analyses
I used phylogenetic eigenvector regression (PVR) (Carrascal et al, 2008; Diniz-Filho et al, 1998, 2011; Kuhn et al, 2009; Morales-Castilla et al, 2012; Seger et al, 2013) to quantify and account for phylogenetic signals inherited in tip species due to non-independent history caused by cladogenesis and anagenesis events (Inglis, 1988). The core of the PVR method is to construct a matrix of pairwise phylogenetic distances among concerned species and a principal coordinates analysis (PCoA) is performed on this matrix. The matrix of phylogenetic distances for the endemic mammals of China is available from the author upon request. The most important axes accounting for most of total variance were retained to represent the major components of phylogenetic signal for subsequent analyses (Carrascal et al, 2008; Diniz-Filho et al, 2012c).
To remove phylogenetic autocorrelation within the climatic variables and life-history traits for endemic mammals, all the explanatory variables were regressed onto the selected eigenvectors so as to obtain residuals to study the correlations between explanatory variables and extinction risk.
Variation partitioning followed the methods of previous studies (Legendre & Legendre, 1998; Carrascal et al, 2008). In detail, climatic variables were used as group A, while life-history traits formed group B. During the multiple regression analysis when extinction risks of species served as the response variable, the difference between the variation VAB explained by A+B and the variation VA explained by A became the independent contribution of group B for explaining the total variation of extinction risk. Similarly, the independent contribution of group A for explaining the total variation of extinction risks of species was given by VAB−VB. Unexplained variation inside the response variable was 1−VAB.
As a comparison, variation partitioning without controlling phylogenetic inertia was also performed to evaluate the relative influence of phylogenetic inertia. The variation partitioning procedure was identical to the above-mentioned method, except that all variables were not phylogenetically corrected.
RESULTS
When phylogenetic inertia was controlled using PVR, there was still a large fraction of unexplained variation for the extinction risks of endemic mammals of China, with only 13% of total variation being explained by the ecological variables included here (Figure 2). The influential role of climate was identified, which explains approximately 13% of the variance independently. As such, almost all the fraction of explained variation was attributed to climate. By contrast, the role of range size was not important, because only 1% of total variation was explained by this trait (Figure 2).
Figure 2.
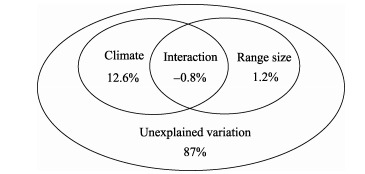
Partitioning of variation attributed to different explanatory variable groups after controlling for phylogenetic inertia effects
When variation partitioning was performed without controlling for phylogenetic inertia (Figure 3), the results were similar to those resulting from phylogenetic adjustment (Figure 2), but the role of range size in extinction risk became more important, accounting for 7.4% of the total variation in extinction risk and climate explained 11.2% of total variation (Figure 3).
Figure 3.

Partitioning of variation attributed to different explanatory variable groups without controlling for phylogenetic inertia effects
As a consequence, the influence of phylogenetic inertia could be determined via comparison of these two methods (contrast Figure 2 and Figure 3). The variation partitioning results for the situation with phylogenetic adjustment would partially eliminate the influence of range size when explaining the extinction risks of species.
DISCUSSION
There are a suite of statistical methods to detect and remove phylogenetic inertia effects (Blomberg et al, 2003, 2012; Diniz-Filho et al, 1998, 2012b; Pagel, 1999), but many are strongly correlated and robust for handling alternative evolutionary models (Diniz-Filho et al, 2012b; Seger et al, 2013). The merit of the PVR method and its extension (Diniz-Filho et al, 2012a) is that it is able to capture nonlinear components of phylogenetic signals and elegantly evaluate the deviation of Brownian motion for the evolution of those examined traits (Diniz-Filho et al, 2012a).
Previous studies found that range size is an important attribute that can predict extinction risk over different taxonomic groups (including global mammals) (Cardillo et al, 2005; Cooper et al, 2008; Harris & Pimm, 2008; Hanna & Cardillo, 2013; He, 2012). However, for the endemic mammals of China, threatened status is principally predicted by climate, and not life-history or range size (Figs. 2 and 3). One reason for the weak explanatory power of range size in my findings is that the distribution information for endemic taxa in China may be incomprehensive, reducing the explanatory power of range size on structuring extinction risk. Furthermore, limited phylogenetic sampling of endemic species may have contribute to the reduced explanatory power of range size.
Despite interesting findings, there are a few shortcomings to note. First, the weak phylogenetic inertia signal detected may be due to the fact that many variables influence species’ extinction risk besides or in addition to climate and distribution; for example, human disturbance (Kong et al, 2013) and environmental pollution. A lack of comprehensive and comparable data on such topics for use in examining extinction risk makes for a less convincing or robust analysis. Moreover, since I did not include nonendemic species in the analysis, the phylogenetic signal is weakened because the role of evolution is weak when influencing species’ range sizes, due to limited evolutionary divergence amongst endemic taxa.
A further potential limitation of the present study is the comparatively small sample of 53 endemic mammals, conspicuously less than the total number of endemic mammals in China. As a consequence, these findings may not be robust enough to represent the true ecological correlates of extinction risk for this group. The power of phylogenetic signals is also reduced due to this limited sampling. Unfortunately, there is no clear remedy to this shortcoming, as only 53 endemic mammalian species were able to be included due to data, e.g., global mammalian phylogeny does not contain many mammals endemic to China (Bininda-Emonds et al, 2007), some of which may be yet identified as new endemic species or become a synonym/subspecies of a wide-ranging species (Li et al, 2006). Further research in the area may allow for a more detailed replication of this analysis at a later date.
Acknowledgements: I would like to thank two anonymous reviewers for constructive comments on this manuscript.
Funding Statement
This work was supported by the China Scholarship Council (CSC)(201308180004)
REFERENCES
- 1. Bininda-Emonds O, Cardillo M, Jones K, MacPhee R, Beck R, Grenyer R, Price S, Vos A, Gittleman J, Purivs A. 2007. The delayed rise of present-day mammals. Nature, 446 (7135): 507- 512. [DOI] [PubMed] [Google Scholar]
- 2. Blomberg SP, Garland T Jr, Ives AR. 2003. Testing for phylogenetic signal in comparative data: behavioral traits are more labile. Evolution, 57 (4): 717- 745. [DOI] [PubMed] [Google Scholar]
- 3. Blomberg S, Lfevre J, Wells A, Wterhouse M. 2012. Independent contrasts and PGLS regression estimators are equivalent. Systematic Biology, 61 (3): 382- 391. [DOI] [PubMed] [Google Scholar]
- 4. Cardillo M, Bromham L. 2001. Body size and risk of extinction in Australian mammals. Conservation Biology, 15 (5): 1435- 1440. [Google Scholar]
- 5. Cardillo M, Mace GM, Gittleman JL, Jones KE, Bielby J, Purvis A. 2008. The predictability of extinction: biological and external correlates of decline in mammals. Proceedings of the Royal Society B: Biological Sciences, 275 (1641): 1441- 1448. [DOI] [PMC free article] [PubMed] [Google Scholar]
- 6. Cardillo M, Mace G, Gittleman J, Purvis A. 2006. Latent extinction risk and the future battlegrounds of mammal conservation. Proceedings of the National Academy of Sciences of the United States of America, 103 (11): 4157- 4161. [DOI] [PMC free article] [PubMed] [Google Scholar]
- 7. Cardillo M, Mace GM, Jones KE, Bielby J, Bininda-Emonds ORP, Sechrest W, Orme CD, Purvis A. 2005. Multiple causes of high extinction risk in large mammal species. Science, 309 (5738): 1239- 1241. [DOI] [PubMed] [Google Scholar]
- 8. Cardillo M, Purvis A, Sechrest W, Gittleman J, Bielby J, Mace G. 2004. Human population density and extinction risk in the World’s carnivores. PLoS Biology, 2 (7): e197- [DOI] [PMC free article] [PubMed] [Google Scholar]
- 9. Carrascal L, Seoane J, Palomino D, Polo V. 2008. Explanations for bird species range size: ecological correlates and phylogenetic effects in the Canary Islands. Journal of Biogeography, 35 (11): 2061- 2073. [Google Scholar]
- 10. Cooper N, Bielby J, Thomas GH, Purvis A. 2008. Macroecology and extinction risk correlates of frogs. Global Ecology and Biogeography, 17 (2): 211- 221. [Google Scholar]
- 11. Diniz-Filho JAF, de Sant’Ana CER, Bini LM. 1998. An eigenvector method for estimating phylogenetic inertia. Evolution, 52 (5): 1247- 1262. [DOI] [PubMed] [Google Scholar]
- 12. Diniz-Filho JAF, Cianciaruso MV, Rangel TF, Bini LM. 2011. Eigenvector estimation of phylogenetic and functional diversity. Functional Ecology, 25 (4): 735- 744. [Google Scholar]
- 13. Diniz-Filho JAF, Rangel TF, Santos T, Bini LM. 2012. a. Exploring patterns of interspecific variation in quantitative traits using sequential phylogenetic eigenvector regressions. Evolution, 66 (4): 1079- 1090. [DOI] [PubMed] [Google Scholar]
- 14. Diniz-Filho JAF, Santos T, Rangel TF, Bini LM. 2012. b. A comparison of metrics for estimating phylogenetic signal under alternative evolutionary models. Genetics and Molecular Biology, 35 (3): 673- 679. [DOI] [PMC free article] [PubMed] [Google Scholar]
- 15. Diniz-Filho JAF, Bii LM, Rangel TF, Morales-Castilla I, Olalla-Tárraga Má, Rodríguez Má, Hawkins BA. 2012. c. On the selection of phylogenetic eigenvectors for ecological analyses. Ecography, 35 (3): 239- 249. [Google Scholar]
- 16. Halley J, Iwasa Y. 2011. Neutral theory as a predictor of avifaunal extinctions after habitat loss. Proceedings of the National Academy of Sciences of the United States of America, 108 (6): 2316- 2321. [DOI] [PMC free article] [PubMed] [Google Scholar]
- 17. Hanna E, Cardillo M. 2013. A comparison of current and reconstructed historic geographic range sizes as predictors of extinction risk in Australian mammals. Biological Conservation, 158 196- 204. [Google Scholar]
- 18. Harris G, Pimm S. 2008. Range size and extinction risk in forest birds. Conservation Biology, 22 (1): 163- 171. [DOI] [PubMed] [Google Scholar]
- 19. He FL. 2012. Area-based assessment of extinction risk. Ecology, 93 (5): 974- 980. [DOI] [PubMed] [Google Scholar]
- 20. Inglis WG. 1988. Cladogenesis and anagenesis: a confusion of synapomorphies. Journal of Zoological Systematics and Evolutionary Research, 26 (1): 1- 11. [Google Scholar]
- 21. Jones KE, Bielby J, Cardillo M, Fritz SA, O’Dell J, Orme CDL, Safi K, Schrest W, Boakes EH, Carbone C, Connolly C, Cutts MJ, Foster JK, Grenyer R, Habib M, Plaster CA, Price SA, Rigby EA, Rist J, Teacher A, Bininda-Emonds ORP, Gittleman JL, Mace GM, Purvis A, Michener WK. 2009. PanTHERIA: a species-level database of life history, ecology and geogrpahy of extant and recently extinct mammals. Ecology, 90 (9): 2648- [Google Scholar]
- 22. Keane A, de Brooke ML, McGowan PJK. 2005. Correlates of extinction risk and hunting pressure in gamebirds (Galliformes). Biological Conservation, 126 (2): 216- 233. [Google Scholar]
- 23. Kong WY, Zheng ZH, Wu JC, Ning Y, Wang Y, Han XD. 2013. Foraging habitat selection of Siberian Crane (Grus leucogeranus) during autumn migration period in the Momoge Nature Reserve. Zoological Research, 34 (3): 166- 173. [PubMed] [Google Scholar]
- 24. Kuhn I, Nobis MP, Durka W. 2009. Combining spatial and phylogenetic eigenvector filtering in trait analysis. Global Ecology and Biogeography, 18 (6): 745- 758. [Google Scholar]
- 25. Legendre P, Legendre L. 1998. Numerical Ecology. Amsterdam: Elsevier Science BV., [Google Scholar]
- 26. Legendre S, Schoener T, Clobert J, Spiller D. 2008. How is extinction risk related to population-size variability over time? A family of models for species with repeated extinction and immigration. The American Naturalist, 172 (2): 282- 298. [DOI] [PubMed] [Google Scholar]
- 27. Li G, Jones G, Rossiter SJ, Chen SF, Parsons S, Zhang S. 2006. Phylogenetic of small horseshoe bats from east Asia based on mitochondrial DNA sequence variation. Journal of Mammalogy, 87 (6): 1234- 1240. [Google Scholar]
- 28. Morales-Castilla I, Rodriguez Má, Hawkins BA. 2012. Deep phylogeny, net primary productivity, and global body size gradient in birds. Biological Journal of the Linnean Society, 106 (4): 880- 892. [Google Scholar]
- 29. Pagel M. 1999. Inferring the historical patterns of biological evolution. Nature, 401 (6756): 877- 884. [DOI] [PubMed] [Google Scholar]
- 30. Reynolds JD, Webb TJ, Hawkins LA. 2005. Life history and ecological correlates of extinction risk in European freshwater fishes. Canadian Journal of Fisheries and Aquatic Sciences, 62 (4): 854- 862. [Google Scholar]
- 31. Seger GDS, Duarte LDS, Debastiani VJ, Kindel A, Karenkow JA. 2013. Discriminating the effects of phylogenetic hypothesis, tree resolution and clade age estimates on phylogenetic signal measurements. Plant Biology, 15 (5): 858- 867. [DOI] [PubMed] [Google Scholar]
- 32. Smith AT, Xie Y. 2008. A Guide to the Mammals of China, USA: Princeton University Press; [Google Scholar]
- 33. Wang YX. 2003. A Complete Checklist of Mammal Species and Subspecies in China: A Taxonomic and Geographic Reference, Beijing: China Forestry Press. (in Chinese) [Google Scholar]