

Summary
Hematopoiesis is a multistage process involving the differentiation of stem and progenitor cells into distinct mature cell lineages. Here we present Haemopedia, an atlas of murine gene-expression data containing 54 hematopoietic cell types, covering all the mature lineages in hematopoiesis. We include rare cell populations such as eosinophils, mast cells, basophils, and megakaryocytes, and a broad collection of progenitor and stem cells. We show that lineage branching and maturation during hematopoiesis can be reconstructed using the expression patterns of small sets of genes. We also have identified genes with enriched expression in each of the mature blood cell lineages, many of which show conserved lineage-enriched expression in human hematopoiesis. We have created an online web portal called Haemosphere to make analyses of Haemopedia and other blood cell transcriptional datasets easier. This resource provides simple tools to interrogate gene-expression-based relationships between hematopoietic cell types and genes of interest.
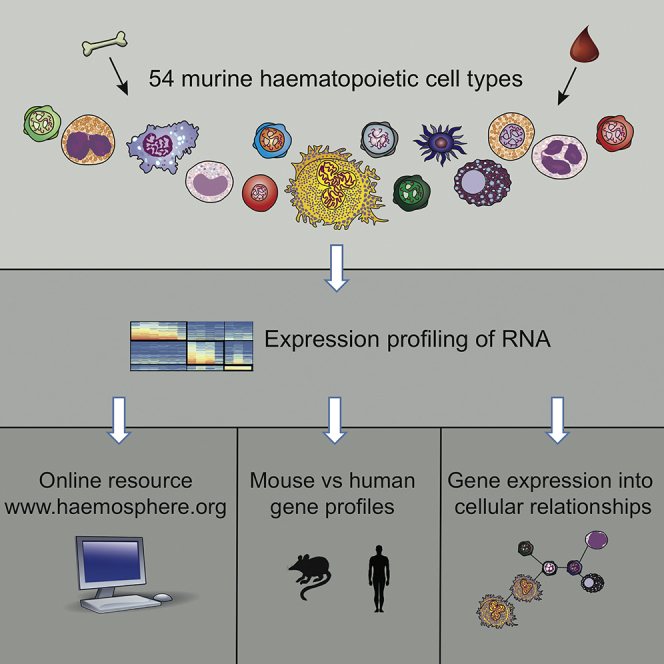
Graphical Abstract
Highlights
-
•
Haemopedia is an expression dataset covering 54 murine hematopoietic cell types
-
•
Relationship of cells recreated with the expression pattern of small sets of genes
-
•
Many murine lineage-specific genes still lineage specific in humans
-
•
Data can be accessed via online portal for ease of analysis
De Graaf and colleagues transcriptionally profile 54 murine blood cell types from stem to mature cells. Lineage relationship of cells can be reconstructed from the expression patterns of small sets of genes. Lineage-specific genes are identified, many of which show conserved expression patterns in humans. An online web portal to this dataset is provided for ease of analysis.
Introduction
Every day hematopoietic stem and progenitor cells in the bone marrow differentiate under tight regulation into a plethora of mature blood cells, with functions as diverse as oxygen transport, wound healing, and immune responses. These stem cells can both differentiate to produce intermediate lineage-restricted progenitors, and can replenish themselves via self-renewal, yielding a system that can sustain cellular output over a lifespan of many decades.
The transcriptional changes that underlie hematopoiesis and result in functionally and morphologically distinct cell types are still only partially understood. Transcriptional profiles of specific hematopoietic cell types have been collated in both mouse (Chambers et al., 2007, Heng and Painter, 2008, Seita et al., 2012) and human (Novershtern et al., 2011, Rapin et al., 2014, Watkins et al., 2009) cells, with a particular focus on lymphoid cells. There has not yet been a mouse collection that covers all the major hematopoietic lineages.
We have generated a comprehensive set of transcriptional profiles from the mouse, covering 54 diverse hematopoietic cell types from stem cells to terminally differentiated hematopoietic lineages, and eight non-hematopoietic “outgroups” using Illumina BeadChips, which we term Haemopedia—an encyclopedia of blood cell transcription. The samples have been processed and hybridized by a single facility, minimizing technical artifacts and resulting in high reproducibility. This dataset can be viewed in Haemosphere, an online data portal we have developed that allows visualization of expression profiles, differential expression analysis, and management of gene sets.
The mouse has been an extremely useful model organism for studying hematopoiesis (Schmitt et al., 2014). Our dataset demonstrates a high degree of concordance between the transcriptional profiles seen in human and mouse hematopoietic cell types. This validates the utility of Haemopedia for both understanding the transcriptomics of hematopoietic differentiation in a major model organism and allowing for a comparison of mouse and human hematopoiesis. We further show that the Haemopedia gene-expression data can be used to reconstruct the relationships between cell types, to identify lineage-specific gene sets that include genes not previously associated with particular blood cell types, and to identify new subpopulations of hematopoietic cells.
Results
Data Collection
Haemopedia contains transcriptional profiles for 169 hematopoietic samples that represent 54 hematopoietic cell types from all major lineages including B cells, T cells, natural killer (NK) cells, dendritic cells, macrophages, neutrophils, eosinophils, basophils, mast cells, erythrocytes, and megakaryocytes, as well as progenitors and stem cells (Figure 1 and Table S1). Cells were sorted by flow cytometry according to the markers shown in Table S2 and Figure S1A. In addition, for reference we also included some “outgroups” of other tissue types for comparison (Figure 1). All primary hematopoietic samples were collected from C57BL/6 mice. When aliquots of sorted samples were re-analyzed they showed >95% purity. The identity of representative cell types was further confirmed by microscopic examinations of stained cytocentrifuge preparations and/or culture experiments (Figure S1B). At least three replicates were included whenever possible (Table S2). Samples were hybridized to the Illumina Mouse WG-6 V2.0 BeadArrays.
Figure 1.

Cells Included in Haemopedia
The 54 hematopoietic cell populations that were purified by flow sorting from mouse and then analyzed by gene-expression profiling are shown here grouped in their respective lineages. The colors associated with each lineage are used throughout the paper. See Figure S1 and Table S1 for sample information, Table S2 for cell type information including abbreviations used, purification protocols, and tissue of origin, Table S3 for antibody information, Figure S1 for sorting information, Figure S2 for clustering of replicate samples, and Figure S3 for a comparison of cell types with other hematopoietic expression datasets.
To check how closely the replicate samples clustered, we used t-Distributed Stochastic Neighbor Embedding (t-SNE) (Van der Maaten and Hinton, 2008). This showed that, generally speaking, the replicates were very similar, and that cells of the same lineages also clustered similarly (Figure S2). As a further quality control test, we clustered our cell types with two other hematopoietic datasets, ImmGen (Heng and Painter, 2008) and GEXC (Seita et al., 2012) (Figure S3). Despite these datasets using different microarray platforms, the cells clustered well by lineage rather than by batch, showing our expression data are robust.
Cell Relationship
There is a hierarchal relationship between hematopoietic cells, with stem cells and progenitors producing immature cells that are committed to a particular lineage, which then differentiate further into mature blood cells (Seita and Weissman, 2010). These relationships have been extensively defined in the literature by in vitro or in vivo differentiation studies. We sought to investigate whether these relationships were recapitulated by our transcriptional data.
Because the cellular differentiation relationships within the hematopoietic system are conventionally represented as a stepwise, branching process, we chose to use minimum spanning trees (MST) (Prim, 1957), a type of analysis that allows samples to be directly connected to each other rather than by theoretical intermediates, such as in hierarchical clustering. We have constructed an MST using only the probes with expression that varies most over hematopoiesis (Figures 2 and S4A). While unsupervised, this captures many of the expected relationships in the cell type data, such that the stem cells and progenitors are placed centrally in the plot while the more mature cells radiate into distinct lineage-specific axes. The MST also compares well with relationships observed in other datasets, including H3K4me1 profiles, using different clustering methods (Lara-Astiaso et al., 2014). Where we have a differentiation series in the data, the tree captures the progressive order of maturation; for example megakaryocytes of increasing ploidy (Meg8N, 16N–32N) or T cell progenitor maturation (CD4TThy1Lo [Thy1lo T cell progenitors], TN1, TN2, TN3 to TN4) or B cell development (ProB, PreB to ImmB). This shows that the Haemopedia dataset is able to recapitulate known linear relationships during differentiation from stem cells into mature progenitors of various lineages, along with separation of discrete cell lineages.
Figure 2.

Relationships of Cells Inferred by Expression Data Recapitulate Known Cellular Relationships
A total of 890 probes (719 genes) with SD > 2 on a log2 scale across all cell types were selected (Figure S4A). A minimum spanning tree based on Euclidean distance measurements was calculated using these probes. Lengths of branches reflect the distance between cell types. Colors are as given in Figure 1. See Figure S4B for MST based on only transcription factors or surface markers (genes given in Table S4).
Similarly to recent work showing a revised model of myeloid commitment in which erythrocyte and megakaryocyte lineage committed progenitors are derived from a multipotential progenitor rather than the common myeloid progenitors (CMPs) (Paul et al., 2015, Perié et al., 2015), our MST shows CD9Hi progenitors and megakaryocytes as branching off short-term HSCs (STHSCs) rather than CMPs. A similar phenomenon has been observed in human hematopoiesis with single-cell studies suggesting that megakaryocytes can be derived directly from HSCs in the adult, rather than from an oligopotent progenitor (Notta et al., 2015). An unexpected relationship shown by the MST is that peripheral blood monocytes are placed near to bone marrow eosinophils rather than granulocyte macrophage progenitors (GMPs). This may have arisen because of the relative paucity of data available in our atlas for intermediate developmental stages for these lineages, unlike for T and B cells, for which the intermediate stages are very well characterized.
The cell type relationships displayed in Figure 2 were created using the expression data from more than 700 genes; however, during hematopoiesis, lineage commitment can be specified according to finely graded expression of particular transcription factors, such as Myb or Pu.1 (DeKoter and Singh, 2000, Emambokus et al., 2003). Similarly, cell identity can be defined using a combination of a few key cell surface markers (Akashi et al., 2000, Godfrey et al., 1993). To see whether this held true for our dataset, we created MSTs using only the most transcriptionally variable cell surface markers or transcription factors (Figure S4B). After applying a cutoff of SD > 2.5 (log2 scale) expression across all cell types, 59 surface markers (71 probes) and 45 transcription factors (53 probes) were left (Table S4). This included some well-known regulators of hematopoietic differentiation such as Cebpe (Lekstrom-Himes, 2001), Mpl (Alexander et al., 1996), and Gata family members (Chlon and Crispino, 2012).
The resulting trees demonstrate that these two independent lists containing smaller numbers of genes capture the relationships faithfully where we have a detailed differentiation series, but show some variation where the distance between cell types is large. This suggests that both the transcription factors and surface receptors have fine gradients of expression between cell types, which, in combination, can resolve subtle differences in cellular maturity.
This analysis confirms that our MSTs are robust to gene selection where we have detailed differentiation data along linear pathways, but that small gene sets can influence the branching points when the number of intermediates is limited.
Lineage-Specific Genes
Commitment, maturation, and activity of specific hematopoietic lineages are regulated by transcription factors and receptors that are expressed selectively. Since we have covered many mature lineages in our dataset, we set out to identify genes that are expressed selectively and highly in specific lineages. To do this we looked for genes that had high expression in a single mature cell type and substantially lower expression in all other mature lineages. We also looked for stem cell-specific genes using a similar method, comparing gene-expression level in stem cell populations with all of the mature cell lineages. By applying these criteria to stem cells and each of the mature lineages across all of the genes in Haemopedia, we derived a signature set of genes for each lineage (Table S5). The expression level of these signature genes across all cell types is shown in Figure 3A. To confirm the general application of these lineage signatures, we looked at their expression in two other hematopoietic datasets, ImmGen (Heng and Painter, 2008) and GEXC (Seita et al., 2012). The expression of these signatures was largely conserved (Figure S5). Notable exceptions were the erythrocyte and megakaryocyte signatures, which are lowly expressed in the GEXC samples of those lineages. As we defined these signatures using mature cells while the Gene Expression Commons only contains progenitors from these lineages, the reduced degree of concordance with the signatures can be expected. In particular, the lack of expression of the erythrocyte signature in the GEXC preCFU-E (pre-colony-forming units - erythrocyte) correlates well with the lack of expression observed in our preCFU-E, showing that data from different developmental stages can be very informative.
Figure 3.

Identifying Lineage-Specific Genes
(A) Expression of lineage-specific genes across all mouse cell types. The heatmap is colored by the absolute expression value (log2) for each gene, where blue is low, yellow intermediate, and red high expression. The number of genes specific for each lineage is shown along the left of the heatmap; for complete gene list see Table S5. Mature cells are highlighted in black and progenitor cells in gray. Lineages are colored as in Figure 1. The expression of lineage signature genes in their associated lineage is highlighted in heavily lined boxes.
(B) Selected gene signatures that are over-represented within the lineage signatures indicated; complete lists of gene signatures associated with enriched signatures are shown in Table S6. Lineage signatures compared with other expression datasets are shown in Figure S5.
The erythrocyte lineage had the largest unique signature with 1,461 probes. This results from this highly specialized cell type having a function dramatically different to that of all of the other hematopoietic cell types. The signature included genes involved in heme biosynthesis such as Urod, Uros, and Ppox. The eosinophil lineage displayed the smallest signature with just 49 uniquely upregulated probes, including genes encoding eosinophil granule proteins such as Ear2 and Prg3, while sharing some common pathways with the other granulocytes in the atlas.
On the whole, the mature cell signatures were foreshadowed in their lineage-restricted progenitors. For example, the T cell signature was largely expressed from the TN3 stage of maturation, but this program was not yet highly expressed in the earlier T cell progenitors. MEPs (megakaryocyte-erythroid progenitor cells) as defined by Lin− CKIT+ CD34− FcγRlo SCA-1− were named after their ability to produce both megakaryocytes and erythrocytes in vitro on a BCL2 transgenic background, but in C57BL/6 mice with wild-type BCL2 expression overwhelmingly produce erythrocytes in vivo (Akashi et al., 2000, Ng et al., 2011). Interestingly, on our hematopoietic MST (Figure 2) they lie between CFU-E and PreCFU-Es, express erythroid lineage-specific genes, and do not show significant expression of the megakaryocyte lineage genes, unlike other progenitor groups such as the STHSCs, CMPs, and BEMPs (bipotential erythroid-megakaryocyte progenitor cells). This supports their placement as predominantly erythroid progenitor cells with limited bipotentiality.
Cells of specific lineages enact transcriptional programs that produce the cellular components required for their phenotype as mature blood cells. To identify regulators governing development of these gene-expression programs, we looked through gene sets associated with genetic perturbations, chemical stimulations, and conserved motif binding (Liberzon et al., 2011), and identified those that were significantly over-represented in our lineage-specific gene sets (Figure 3B and Table S6). As would be expected, target genes for transcription factors or signaling pathways known to play key lineage-specific roles were found to be upregulated within the corresponding cells. For example, Klf1 was found within the erythrocyte gene signature, and its targets genes were also within the erythrocyte lineage signature (Pilon et al., 2008), and B cell receptor signaling is upregulated in the B cell lineage signature (Schaefer et al., 2009). The stem cell signature included six Hox genes, a family implicated in stem cell self-renewal and leukemia (Argiropoulos and Humphries, 2007), as well as the targets of the NUP98-HOXA9 fusion protein that is found in acute myeloid leukemia (Takeda, 2006). This analysis confirms that the lineage signatures are related to known lineage functions, and novel gene sets may suggest new regulators of particular lineages.
Similarity between Mouse and Human Expression Data
The human D-MAP compendium includes transcriptional data from 38 types of human hematopoietic cells, which can be separated into ten major lineages as well as progenitor cells (for details of cells see Novershtern et al., 2011). To explore transcriptional similarities and differences between the mouse and human datasets, we identified homologous genes (i.e., those with one-to-one orthologs in both mouse and human). Where there were multiple probes for either species, we selected only the probe that had the highest variance in expression across each dataset. This resulted in 9,294 one-to-one orthologs found in both species.
To compare the human and mouse data, we separately mean-centered probes in each species to remove platform- and species-specific batch effects, using only the probes that had a dynamic range of more than 8 (3 on a log2 scale) across both human and mouse cell types. This gave a set of 2,189 genes. We then clustered the cell types using multidimensional scaling (Figure S6). Thus, after normalization the cell types were grouped based on their lineage, rather than their species, with clear clusters for the erythrocyte lineage, the T cell lineage, and a cluster for the granulocyte/monocyte lineages.
To examine these relationships in more detail, we excluded cell types that were not profiled in both species (see Experimental Procedures for details). Many of the same surface markers were used to define and sort the equivalent populations in mouse and human, further supporting their similarity. We then correlated each human cell type with each mouse cell type to identify the closest relationships (Figure 4). The erythrocyte, megakaryocyte, and B and T cell lineages each correlated well with the corresponding lineage in the other species; however, granulocyte/macrophage lineages correlated highly with other myeloid lineages, rather than having their strongest correlation with their orthologous lineage.
Figure 4.

Similarity of Expression Patterns in Mouse and Human Cells
Heatmap of correlations between mouse and human cell types after mean normalization of expression for one-to-one orthologs between the species. Genes with SD > 0.8 on a log2 scale were chosen, leaving 2,026 genes. Heatmap scale is according to Pearson correlation of cell types, with no correlation (dark blue) through to highly correlated (dark red). Lineages are colored as in Figure 1. Lineages that are equivalent between species are highlighted by heavily lined boxes. Multidimensional scaling plot of mouse versus human cell types is shown in Figure S6.
To test whether the murine lineage-specific genes (Figure 5) retain their lineage-specific expression in humans, we again looked at the list of one-to-one orthologs. Of the 2,731 lineage-specific genes that we identified (excluding mast cell-specific genes in the absence of an orthologous human cell type in this dataset), 1,208 (44%) had a one-to-one ortholog in humans. Of those, we found that 385 (40%) were still most highly expressed in the orthologous lineage (Figure 5A and Table S7). The erythroid cells, for which there were a high number of lineage-specific genes in the mouse signature set (Figure 3), retained a high number of genes specifically expressed in human erythroid cells, with 51% of their one-to-one orthologs to the lineage-specific signature (256/500) maintaining highest expression in the human erythroid lineage. However, few of the myeloid lineage orthologs were most highly expressed in their human equivalents. This correlated with the lack of specificity of correlation between different myeloid cell types (Figure 4).
Figure 5.

Expression of Mouse Lineage Signature Genes in Human Hematopoietic Cells
Genes shown are from murine hematopoietic lineage signatures as in Figure 3 and have one-to-one human orthologs in human hematopoietic cells. Heatmap is colored according to mean normalized expression. Lineage colors are as given in Figure 1.
(A) Lineage signature genes that have their highest expression level in the orthologous human lineage, with their expression in the lineage of interest highlighted by a heavily lined box.
Numbers (left side) show the number of lineage signature genes with maximum expression in the equivalent human lineage as a proportion of lineage signature genes with a one-to-one human ortholog. Details of genes are given in Table S7.
(B) Lineage signature genes that do not have their highest expression level in the orthologous human lineage. Only genes that are expressed in at least one cell type at least 8-fold (3 on a log2 scale) higher than the mean expression are shown.
We also identified genes that were lineage specific in mice, but with an expression pattern that was not conserved in humans. We selected all one-to-one orthologous lineage signature genes, which had maximum expression in a different lineage, and were expressed 8-fold higher (3 on a log2 scale) than the mean expression across all lineages. This left us with 38 genes (Figure 5B). Some genes have extremely different expression patterns in humans, such as Spon2, which is highly expressed in specific progenitor cells and megakaryocytes in mice, yet is highest in NK cells and CD8+ T cells in humans. Other genes retain expression in the lineage of interest, but are more broadly expressed in humans. One example is Ptgs2, which retains in humans the neutrophil expression that is observed in mice, but is also highly expressed in other myeloid cells in humans, with high expression detected in monocytes and dendritic cells as well as granulocytes.
Haemosphere: A Web Portal to Hematopoietic Expression Data
To make the data in Haemopedia widely accessible and useful, we have developed a web portal that is publicly accessible at haemosphere.org. Named Haemosphere, this web portal is designed for researchers without significant bioinformatics expertise to access and analyze data in an intuitive way, providing interactive plots for expression profiles, multidimensional scaling, and heatmaps.
In addition to providing access to Haemopedia, Haemosphere includes a selection of other published datasets considered as hematopoietic “atlases.” These are datasets focused on the blood and contain a range of wild-type/healthy hematopoietic cells that can serve as reference data. The strength of these datasets combined with Haemopedia is their utility in supporting rapid testing of experimental hypotheses in silico. Hence, enhanced ease of access and exploration by researchers with diverse expertise will greatly increase their value.
At the time of publication, there are four murine (Chambers et al., 2007, Heng and Painter, 2008, Seita et al., 2012) (including Haemopedia) and three human (Novershtern et al., 2011, Rapin et al., 2014, Watkins et al., 2009) expression datasets included in Haemosphere, which provides a convenient single point of entry with a consistent interface to the data, and also enables analyses and comparisons across different datasets. There are other existing data portals that allow exploration of hematopoietic expression data, including GEXC (Seita et al., 2012), Bloodspot (Bagger et al., 2016), ImmGen (Heng and Painter, 2008), and InnateDB (Breuer et al., 2013). Haemosphere differs significantly to these data portals by providing a unique set of functions for analysis and access to several independent datasets.
Some of the key features of Haemosphere include:
-
•
Interactive expression profile plots for genes of interest
-
•
Analysis of gene set expression in a selected dataset through the generation of an interactive heatmap
-
•
Interactive multidimensional scaling plot enables visualization of relationships between cell types within a dataset
-
•
Identification of differentially expressed genes between two cell types or lineages within a dataset using well-established methods (limma from R/Bioconductor) (Ritchie et al., 2015)
-
•
Finding correlated and negatively correlated genes
-
•
Linking genes to their orthologs
Discovering Hematopoietic Genes Using Haemosphere
Haemopedia includes transcription profiles from rare hematopoietic cells types such as eosinophils, for which published transcription datasets are relatively scant. To illustrate the combined power of Haemopedia and Haemosphere, we performed an example analysis using the tools we provide in Haemosphere, which yielded an eosinophil-specific transcription factor, Mkx.
Starting with a known regulator of eosinophils, Ccr3 (the receptor for eotaxin) (Ponath et al., 1996), which is highly expressed on the surface of eosinophils, Haemosphere was used to view its expression profile across hematopoiesis (Figure 6A). This shows distinctive high expression in eosinophils and basophils, as expected. The “find similar” function available on the expression profile page of Haemosphere was then used to find genes in which expression is correlated to Ccr3. The resulting table of genes, sorted by Pearson correlation value (Table S8), contained some known eosinophil-specific genes such as Siglecf (Stevens et al., 2007), Il4 (Piehler et al., 2011), and Epx (Horton et al., 1996) as well as genes that have not previously been associated with the eosinophil lineage. These included Mkx, which was one of the most highly positively correlated genes. The Mkx expression profile is shown in Figure 6B, illustrating its similarity to Ccr3 expression.
Figure 6.

Haemosphere: A Web Portal to Hematopoietic Expression Data
haemosphere.org is an online data portal and analysis tool that contains Haemopedia as well as other hematopoietic datasets of relevance. Among other features, Haemosphere can be used to discover pathways and genes involved in an aspect of hematopoiesis. An example is shown here.
(A) Expression profile of eosinophil marker gene Ccr3 as shown in Haemosphere (the plot used here has been downloaded from Haemosphere as a pdf, which is one of the features of Haemosphere). Genes positively correlated to Ccr3 are given in Table S8.
(B) Expression profile of Mkx, a transcription factor with high expression correlation to Ccr3.
Mkx is an IRX family-related homeobox gene with known roles in tendon formation (tenogenesis), but no previously reported function in hematopoiesis (Ito et al., 2010). To further examine Mkx expression during hematopoiesis, we generated an Mkx-driven GFP reporter mouse, MkxGFP (see Experimental Procedures). Consistent with Haemopedia expression profiles, GFP fluorescence was greatest in eosinophils in comparison with other lineages (Figure 7A). We next examined Mkx expression in eosinophils isolated from different hematopoietic compartments (Figure 7Bi). The high expression of Mkx observed in eosinophils was derived from an Mkx-positive subpopulation. Peritoneal cavity eosinophils were shown to have the largest proportion of Mkx-positive cells, followed by eosinophils from the spleen and peripheral blood, and then the bone marrow (Figure 7Bii). This suggests a possible gradient of Mkx expression within the bulk eosinophil population or, alternatively, a subset of Mkx-expressing eosinophils in each compartment. Thus these results confirm that Haemopedia can be used as a powerful tool to screen for potential hematopoietic regulators with hitherto unknown hematopoietic functions with a high degree of specificity.
Figure 7.

In Vivo Exploration of Mkx, an Eosinophil-Specific Gene
(A) The Mkx-GFP levels (median fluorescence intensity) in cells in MxkGFP/GFP reporter mice. Eosinophils and B cells were taken from bone marrow, neutrophils, and monocytes from peripheral blood. Data represent mean ± SEM with replicates shown as individual points (n = 4–6 mice).
(B) (i) Comparison of GFP expression in different eosinophil populations from the MxkGFP/GFP mouse. Negative control is peripheral blood eosinophils from an Mkx+/+ mouse. Data shown are normalized to the mode. (ii) Percentage of eosinophils that are GFP+ in tissues given in (Bi) in MkxGFP/GFP mice. Data represent mean ± SEM with replicates shown as individual points (n = 6 mice).
Discussion
The major strengths of Haemopedia are the breadth and the quality of the data: the data are all collected from a single strain of mice and the expression data are processed at a single facility. It covers all of the mature lineages of hematopoiesis in mice and includes a diverse collection of progenitors.
The range of cell types in Haemopedia makes identification of lineage-specific genes more rigorous. The genes that we have identified as lineage signatures are highly specific to each lineage and are lineage specific in other datasets (Figure S5). This provides a powerful resource for identifying new regulators and markers of particular lineages. In our analysis of the most variable genes across hematopoiesis, we identified pathways and transcription factor targets over-represented in the lineage signatures. Any novel pathways and transcription factors associated with each lineage may therefore provide new insights into the regulation of those cell types and the perturbations that may lead to disease.
We were able to use gene-expression information to organize the cell types into MST (Figure 2). These showed a maturation hierarchy from progenitors and stem cells to mature cells and identified the major lineages and subtle stages in developmental trajectories. However, the relationship between progenitors or the placement of some myeloid lineages was not as clear. This can be observed by the variable placement of mast cells and basophils depending on which genes are selected to construct the tree (Figures 2 and S4). This may be because the distances between those cell populations and their progenitors are too large to allow their accurate placement without further intermediate populations. Where the relationship between the progenitors is unclear, this may be due to the heterogeneity of sorted populations or because multiple pathways to maturity may exist. Single-cell analysis shows that there are even more subtle distinctions between progenitors and stem cells than have been traditionally defined (Drissen et al., 2016, Wilson et al., 2015, Zhou et al., 2016). This has led to identification of novel pathways of hematopoietic development (Drissen et al., 2016) and should assist in clarifying the pathways to lineage commitment.
There has been great interest in comparing mouse and human transcriptomes, with the interpretation being sensitive to the normalization strategy used (Gilad and Mizrahi-Man, 2015, Lin et al., 2014). However, major developmental pathways are conserved between these species, and both similarities and differences between cell-specific gene-expression profiles across species can be highly informative (Brawand et al., 2011, Pishesha et al., 2014). We observed that while many of our lineage-specific genes were conserved between species, the granulocyte/macrophage lineages in particular had less conserved signature genes. These cell types also did not separate into distinct lineages when clustered into an MST or by multidimensional clustering (Figures 2 and S4). There are several potential reasons for these observations. There are a range of known differences between mouse and human myeloid cells (Mestas and Hughes, 2004). For instance, CD33, which binds sialic acid, is expressed on mouse granulocytes but is found on human monocytes, while CD4 is expressed on human monocytes and granulocytes but not on mouse macrophages. This supports the important point that studies using mouse models need to validate the specificity or presence of the human gene or pathway of interest in mice.
Large datasets, such as Haemopedia, can be difficult to navigate, particularly for non-bioinformaticians. For this reason we have created Haemosphere as a web portal allowing direct access to hematopoietic data from the Haemopedia collection as well as other hematopoietic transcription datasets. The combination of Haemopedia and Haemosphere provides a powerful data-mining tool with broad application. We plan to add appropriate new datasets to Haemosphere at the request of our users, in particular including RNA-sequencing expression profiles. We are also developing new tools to enable, for example, integrated gene-ontology analysis and dynamic gene clustering. We identified a transcription factor, Mkx, which had no known role in hematopoiesis, as having highly eosinophil-specific expression by correlation with known eosinophil genes using the Haemopedia and Haemosphere functionality. We validated this gene by in vivo analysis of expression to define a subset of eosinophils in the peripheral blood, spleen, and peritoneal cavity, showing the power and utility of this approach.
In conclusion, Haemopedia is a comprehensive collection of gene-expression data covering all hematopoietic lineages, which, along with Haemosphere (a web portal and suite of analysis tools), will enable improved understanding of the molecular and genetic regulation of blood cell function and production.
Experimental Procedures
Cell Purification and Quality Assessment
All cells were purified from wild-type C57BL/6 mice, between 7 and 12 weeks of age, except Pre and Pro B cells, which were collected from 5- to 7-week-old mice. Bone marrow was collected from femurs and tibiae, and in some instances, hips. Lymph node cells were collected from the inguinal, axillary, brachial, mesenteric, and superficial cervical lymph nodes. Peritoneal cells were isolated by peritoneal lavage. Peripheral blood was collected from the retro-orbital plexus into Microtainer tubes containing EDTA (BD Biosciences). All procedures involving animals were approved by The Walter and Eliza Hall Institute of Medical Research Animal Ethics Committee. Cells were purified according to the combination of monoclonal antibodies outlined in Tables S2 and S3 and then isolated on a fluorescence-activated cell sorter. Except for extremely rare populations, a portion of the sample was resorted to confirm the final purity of the sample. In some experiments, sorted cell populations were transferred onto slides using a cytospin centrifuge and subsequently stained with May-Grunwald/Giemsa staining (Sigma-Aldrich) for morphological examination.
RNA Isolation, Amplification, and Hybridization
Total RNA was isolated from purified cell populations using RNeasy Micro/Mini kits (Qiagen). Each purified RNA sample was assessed for quality and integrity using the 2100 Bioanalyzer (Agilent Technologies).
RNA was amplified according to the manufacturer's instructions with the Illumina Total Prep RNA Amplification Kit (Ambion). The quality of the labeled product was again ascertained using the Agilent Bioanalyzer 2100. Labeled cRNA was then hybridized to Illumina MouseWG-6 V 2.0 Expression BeadChips according to the manufacturer's instructions at the Australian Genome Research Facility.
Processing of Gene-Expression Data
The microarray intensities were normexp background corrected and quantile normalized using control probes (Shi et al., 2010). After normalization, we restricted to a curated selection of probes that were supported by an Ensembl transcript (Barbosa-Morais et al., 2009). This resulted in 34,031 probes covering 19,699 genes.
Data Availability
All data can be viewed and are available for download on haemosphere.org. The dataset is also available in the Gene Expression Omnibus under the accession number GEO: GSE77098.
Bioinformatics Analyses
Minimum Spanning Trees
When clustering cell types, the data were averaged for each cell type and then probes of interest were selected with an SD cutoff to select only the genes with the most varied expression pattern across cells. Initially the 889 probes (covering 717 genes) with SD > 4 (2 on a log2 scale) were selected. For the cell surface marker and transcription factor sets a cutoff of SD > 6.25 (2.5 on a log2 scale) was used. The Euclidean distance between each cell type was calculated with these probes, and this value was used to determine the minimum spanning tree with the vegan package in R (Oksanen et al., 2015).
Multidimensional Plots
Multidimensional scaling plots of distances between cell types were made using the plotMDS function in the limma package in R (Ritchie et al., 2015).
t-Distributed Stochastic Neighbor Embedding Plots
t-SNE plots (Van der Maaten and Hinton, 2008) were made in R using standard parameters in the package Rtsne.
Identification of Lineage-Specific Genes
Lineage-specific genes were selected with criteria that ensured they were most highly expressed in a single lineage. The mature cells (as marked in Figure 3) of all lineages were selected. Differential expression was then assessed using linear modeling and empirical Bayes t statistics to find false discovery rate (FDR)-corrected p values with the limma package in R (Ritchie et al., 2015, Smyth, 2004). For each mature lineage, we performed separate pairwise comparisons between the samples of the lineage of interest and the samples in every other lineage. Genes were considered upregulated in the lineage of interest if they had an FDR after Benjamini-Hochberg correction of <0.01 and were >2-fold (1 on a log2 scale) higher expressed in the lineage of interest. Then probes were identified as “lineage specific” if they met this criteria in every comparison with another mature lineage. A similar test was done for the stem cell-specific genes, with stem cell samples compared with every mature lineage, to find genes that were highly expressed in stem cells compared with every mature lineage. If a gene was stem cell specific, but also fell into a lineage-specific list, it was left only in the stem cell list.
Human-Mouse Comparison
Transcriptional profiles from human hematopoietic cells were obtained from Novershtern et al. (2011) by downloading the published data from the GEO with accession number GEO: GSE26014. The collection of data was quantile normalized, and probes associated with Ensembl gene IDs by BioMart (www.biomart.org) were then filtered for those that were only associated with a single Ensembl ID. To link mouse and human orthologs, we used the Mouse Genome Informatics (MGI; www.informatics.jax.org) reports and selected for those that had a one-to-one mapping between species. In cases were genes were represented by multiple probes, we selected the probe with the highest mean expression across the species. This left 9,294 orthologous genes. The data for each gene was then mean-centered at zero separately for each species.
For later comparisons we removed cell types that were not represented in both species. This included several progenitor populations and mast cells, as they were only represented in mice. We also removed the human plasmacytoid dendritic cell DENDa1 from the human collection, as there is no equivalent in the mouse collection and the human mature NKa1 cell (CD56− CD16+ CD3−), which is more similar to the human monocytes than the NK cells, as there is no equivalent in the mouse collection.
The heatmap comparing mouse with human cells was colored based on correlations of genes which had an SD of >0.8 on a log2 scale in both species, leaving 2,026 genes.
Author Contributions
C.A.D.G. performed and designed research, collected data, analyzed data, and wrote the paper. J.C. designed and created Haemosphere, wrote its code, analyzed data, and wrote the paper. T.M.B., A.J.R., J.E.B., K.F., and C.M. collected and analyzed data. K.R., A.P.N., M.K., C.B., A.D., M.C.D., E.L., L.W., S.K.N., B.W., S.Y.H., E.A.K., S.K., and A.B.M. collected data. Y.H. and G.K.S. analyzed data. W.S.A. produced the MkxGFP mouse. T.S. analyzed data. M.J.W. and S.K.D. designed Haemosphere and analyzed data. N.S. wrote Haemosphere code. D.J.H. designed research and Haemosphere, and analyzed data.
Acknowledgments
The authors would like to thank the many people who contributed to this project, with numerous feedback and involvement. We thank the Australian Genome Research Facility for running microarray samples; thanks also to Matt Ritchie, Eugene Maraskovsky, and their respective teams. C.A.D.G. was supported by an APA, and an NHMRC Early Career Fellowship. M.C.D. and J.E.B. were supported by NHMRC Early Career Fellowships. E.A.K. was supported by a University of Melbourne Scholarship and an NHMRC Early Career Fellowship. A.P.N. was supported by the Cure Cancer Australia/Leukemia Foundation Australia Post Doctoral Fellowship and Lions Fellowship, Cancer Council Victoria. This work is in part supported by a Science and Industry Endowment Fund (SIEF) grant to S.K.N., W.S.A., and D.J.H.; Program and Project Grants (1016647, 1048087, 1054618), Fellowships (W.S.A. 1058344, G.K.S. 1058892), and Independent Research Institutes Infrastructure Support Scheme Grant (361646) from the NHMRC; funding from the Australian Cancer Research Fund; funding from the Victorian State Government Operational Infrastructure Support; and funding from CSL to D.J.H. The Australian Regenerative Medicine Institute is supported by grants from the State Government of Victoria and the Australian Government. This work was partially supported by funding from CSL to D.J.H.
Published: August 4, 2016
Footnotes
Supplemental Information includes Supplemental Experimental Procedures, six figures, and eight tables and can be found with this article online at http://dx.doi.org/10.1016/j.stemcr.2016.07.007.
Accession Numbers
The dataset is available in the Gene Expression Omnibus under the accession number GEO: GSE77098.
Supplemental Information
References
- Akashi K., Traver D., Miyamoto T., Weissman I.L. A clonogenic common myeloid progenitor that gives rise to all myeloid lineages. Nature. 2000;404:193–197. doi: 10.1038/35004599. [DOI] [PubMed] [Google Scholar]
- Alexander W.S., Roberts A.W., Nicola N.A., Li R., Metcalf D. Deficiencies in progenitor cells of multiple hematopoietic lineages and defective megakaryocytopoiesis in mice lacking the thrombopoietic receptor c-Mpl. Blood. 1996;87:2162–2170. [PubMed] [Google Scholar]
- Argiropoulos B., Humphries R.K. Hox genes in hematopoiesis and leukemogenesis. Oncogene. 2007;26:6766–6776. doi: 10.1038/sj.onc.1210760. [DOI] [PubMed] [Google Scholar]
- Bagger F.O., Sasivarevic D., Sohi S.H., Laursen L.G., Pundhir S., Sønderby C.K., Winther O., Rapin N., Porse B.T. BloodSpot: a database of gene expression profiles and transcriptional programs for healthy and malignant haematopoiesis. Nucleic Acids Res. 2016;44:D917–D924. doi: 10.1093/nar/gkv1101. [DOI] [PMC free article] [PubMed] [Google Scholar]
- Barbosa-Morais N.L., Dunning M.J., Samarajiwa S.A., Darot J.F.J., Ritchie M.E., Lynch A.G., Tavaré S. A re-annotation pipeline for Illumina BeadArrays: improving the interpretation of gene expression data. Nucleic Acids Res. 2009;38:e17. doi: 10.1093/nar/gkp942. [DOI] [PMC free article] [PubMed] [Google Scholar]
- Brawand D., Soumillon M., Necsulea A., Julien P., Csárdi G., Harrigan P., Weier M., Liechti A., Aximu-Petri A., Kircher M. The evolution of gene expression levels in mammalian organs. Nature. 2011;478:343–348. doi: 10.1038/nature10532. [DOI] [PubMed] [Google Scholar]
- Breuer K., Foroushani A.K., Laird M.R., Chen C., Sribnaia A., Lo R., Winsor G.L., Hancock R.E.W., Brinkman F.S.L., Lynn D.J. InnateDB: systems biology of innate immunity and beyond—recent updates and continuing curation. Nucleic Acids Res. 2013;41:1228–1233. doi: 10.1093/nar/gks1147. [DOI] [PMC free article] [PubMed] [Google Scholar]
- Chambers S.M., Boles N.C., Lin K.Y.K., Tierney M.P., Bowman T.V., Bradfute S.B., Chen A.J., Merchant A.A., Sirin O., Weksberg D.C. Hematopoietic fingerprints: an expression database of stem cells and their progeny. Cell Stem Cell. 2007;1:578–591. doi: 10.1016/j.stem.2007.10.003. [DOI] [PMC free article] [PubMed] [Google Scholar]
- Chlon T.M., Crispino J.D. Combinatorial regulation of tissue specification by GATA and FOG factors. Development. 2012;139:3905–3916. doi: 10.1242/dev.080440. [DOI] [PMC free article] [PubMed] [Google Scholar]
- DeKoter R.P., Singh H. Regulation of B lymphocyte and macrophage development by graded expression of PU.1. Science. 2000;288:1439–1441. doi: 10.1126/science.288.5470.1439. [DOI] [PubMed] [Google Scholar]
- Drissen R., Buza-Vidas N., Woll P., Thongjuea S., Gambardella A., Giustacchini A., Mancini E., Zriwil A., Lutteropp M., Grover A. Distinct myeloid progenitor–differentiation pathways identified through single-cell RNA sequencing. Nat. Immunol. 2016;17:1–13. doi: 10.1038/ni.3412. [DOI] [PMC free article] [PubMed] [Google Scholar]
- Emambokus N., Vegiopoulos A., Harman B., Jenkinson E., Anderson G., Frampton J. Progression through key stages of haemopoiesis is dependent on distinct threshold levels of c-Myb. EMBO J. 2003;22:4478–4488. doi: 10.1093/emboj/cdg434. [DOI] [PMC free article] [PubMed] [Google Scholar]
- Gilad Y., Mizrahi-Man O. A reanalysis of mouse ENCODE comparative gene expression data. F1000Res. 2015;121:1–32. doi: 10.12688/f1000research.6536.1. [DOI] [PMC free article] [PubMed] [Google Scholar]
- Godfrey D.I., Kennedy J., Suda T., Zlotnik A. A developmental pathway involving four phenotypically and functionally distinct subsets of CD3-CD4-CD8- triple-negative adult mouse thymocytes defined by CD44 and CD25 expression. J. Immunol. 1993;150:4244–4252. [PubMed] [Google Scholar]
- Heng T.S.P., Painter M.W. The Immunological Genome Project: networks of gene expression in immune cells. Nat. Immunol. 2008;9:1091–1094. doi: 10.1038/ni1008-1091. [DOI] [PubMed] [Google Scholar]
- Horton M.A., Larson K.A., Lee J.J., Lee N.A. Cloning of the murine eosinophil peroxidase gene (mEPO): characterization of a conserved subgroup of mammalian hematopoietic peroxidases. J. Leukoc. Biol. 1996;60:285–294. doi: 10.1002/jlb.60.2.285. [DOI] [PubMed] [Google Scholar]
- Ito Y., Toriuchi N., Yoshitaka T., Ueno-Kudoh H., Sato T., Yokoyama S., Nishida K., Akimoto T., Takahashi M., Miyaki S. The Mohawk homeobox gene is a critical regulator of tendon differentiation. Proc. Natl. Acad. Sci. USA. 2010;107:10538–10542. doi: 10.1073/pnas.1000525107. [DOI] [PMC free article] [PubMed] [Google Scholar]
- Lara-Astiaso D., Weiner A., Lorenzo-Vivas E., Zaretsky I., Jaitin D.A., David E., Keren-Shaul H., Mildner A., Winter D., Jung S. Chromatin state dynamics during blood formation. Science. 2014;345:943–949. doi: 10.1126/science.1256271. [DOI] [PMC free article] [PubMed] [Google Scholar]
- Lekstrom-Himes J.A. The role of C/EBP(epsilon) in the terminal stages of granulocyte differentiation. Stem Cells. 2001;19:125–133. doi: 10.1634/stemcells.19-2-125. [DOI] [PubMed] [Google Scholar]
- Liberzon A., Subramanian A., Pinchback R., Thorvaldsdóttir H., Tamayo P., Mesirov J.P. Molecular signatures database (MSigDB) 3.0. Bioinformatics. 2011;27:1739–1740. doi: 10.1093/bioinformatics/btr260. [DOI] [PMC free article] [PubMed] [Google Scholar]
- Lin S., Lin Y., Nery J.R., Urich M.A., Breschi A., Davis C.A., Dobin A., Zaleski C., Beer M.A., Chapman W.C. Comparison of the transcriptional landscapes between human and mouse tissues. Proc. Natl. Acad. Sci. USA. 2014;111:17224–17229. doi: 10.1073/pnas.1413624111. [DOI] [PMC free article] [PubMed] [Google Scholar]
- Mestas J., Hughes C.C.W. Of mice and not men: differences between mouse and human immunology. J. Immunol. 2004;172:2731–2738. doi: 10.4049/jimmunol.172.5.2731. [DOI] [PubMed] [Google Scholar]
- Ng A.P., Kauppi M., Metcalf D., Di L., Hyland C.D., Alexander W.S. Characterization of thrombopoietin (TPO)-responsive progenitor cells in adult mouse bone marrow with in vivo megakaryocyte and erythroid potential. Proc. Natl. Acad. Sci. USA. 2011;109:2364–2369. doi: 10.1073/pnas.1121385109. [DOI] [PMC free article] [PubMed] [Google Scholar]
- Notta F., Zandi S., Takayama N., Dobson S., Gan O.I., Wilson G., Kaufmann K.B., Mcleod J., Laurenti E., Dunant C.F. Distinct routes of lineage development reshape the human blood hierarchy across ontogeny. Science. 2015;351:1–16. doi: 10.1126/science.aab2116. [DOI] [PMC free article] [PubMed] [Google Scholar]
- Novershtern N., Subramanian A., Lawton L.N., Mak R.H., Haining W.N., McConkey M.E., Habib N., Yosef N., Chang C.Y., Shay T. Densely interconnected transcriptional circuits control cell states in human hematopoiesis. Cell. 2011;144:296–309. doi: 10.1016/j.cell.2011.01.004. [DOI] [PMC free article] [PubMed] [Google Scholar]
- Oksanen J., Blanchet F.G., Kindt R., Legendre P., Minchin P.R., O’Hara R.B., Simpson G.L., Solymos P., Stevens M.H.H., Wagner H. 2015. Vegan: Community Ecology Package. R Package Version 2.3-1.http://CRAN.R-Project.org/package=vegan [Google Scholar]
- Paul F., Arkin Y., Giladi A., Adhemar J.D., Kenigsberg Ephraim, Keren-Shaul H., Winter D., Lara-Astiaso D., Gury M., Weiner A. Transcriptional heterogeneity and lineage commitment in myeloid progenitors. Cell. 2015;163:1–15. doi: 10.1016/j.cell.2015.11.013. [DOI] [PubMed] [Google Scholar]
- Perié L., Duffy K.R., Kok L., De Boer R.J., Schumacher T.N. The branching point in erythro-myeloid differentiation. Cell. 2015;163:1655–1662. doi: 10.1016/j.cell.2015.11.059. [DOI] [PubMed] [Google Scholar]
- Piehler D., Stenzel W., Grahnert A., Held J., Richter L., Köhler G., Richter T., Eschke M., Alber G., Müller U. Eosinophils contribute to IL-4 production and shape the T-helper cytokine profile and inflammatory response in pulmonary cryptococcosis. Am. J. Pathol. 2011;179:733–744. doi: 10.1016/j.ajpath.2011.04.025. [DOI] [PMC free article] [PubMed] [Google Scholar]
- Pilon A.M., Arcasoy M.O., Dressman H.K., Vayda S.E., Maksimova Y.D., Sangerman J.I., Gallagher P.G., Bodine D.M. Failure of terminal erythroid differentiation in EKLF-deficient mice is associated with cell cycle perturbation and reduced expression of E2F2. Mol. Cell. Biol. 2008;28:7394–7401. doi: 10.1128/MCB.01087-08. [DOI] [PMC free article] [PubMed] [Google Scholar]
- Pishesha N., Thiru P., Shi J., Eng J.C., Sankaran V.G., Lodish H.F. Transcriptional divergence and conservation of human and mouse erythropoiesis. Proc. Natl. Acad. Sci. USA. 2014;111:4103–4108. doi: 10.1073/pnas.1401598111. [DOI] [PMC free article] [PubMed] [Google Scholar]
- Ponath P.D., Qin S., Ringler D.J., Clark-Lewis I., Wang J., Kassam N., Smith H., Shi X., Gonzalo J.A., Newman W. Cloning of the human eosinophil chemoattractant, eotaxin. Expression, receptor binding, and functional properties suggest a mechanism for the selective recruitment of eosinophils. J. Clin. Invest. 1996;97:604–612. doi: 10.1172/JCI118456. [DOI] [PMC free article] [PubMed] [Google Scholar]
- Prim R.C. Shortest connection networks and some generalizations. Bell Syst. Tech. J. 1957;36:1389–1401. [Google Scholar]
- Rapin N., Bagger F.O., Jendholm J., Mora-jensen H., Krogh A., Kohlmann A., Thiede C., Borregaard N., Bullinger L., Winther O. Comparing cancer vs normal gene expression profiles identifies new disease entities and common transcriptional programs in AML patients. Blood. 2014;123:894–904. doi: 10.1182/blood-2013-02-485771. [DOI] [PubMed] [Google Scholar]
- Ritchie M.E., Phipson B., Wu D., Hu Y., Law C.W., Shi W., Smyth G.K. Limma powers differential expression analyses for RNA-sequencing and microarray studies. Nucleic Acids Res. 2015;43:e47. doi: 10.1093/nar/gkv007. [DOI] [PMC free article] [PubMed] [Google Scholar]
- Schaefer C.F., Anthony K., Krupa S., Buchoff J., Day M., Hannay T., Buetow K.H. PID: the pathway interaction database. Nucleic Acids Res. 2009;37:674–679. doi: 10.1093/nar/gkn653. [DOI] [PMC free article] [PubMed] [Google Scholar]
- Schmitt C.E., Lizama C.O., Zovein A.C. From transplantation to transgenics: mouse models of developmental hematopoiesis. Exp. Hematol. 2014;42:707–716. doi: 10.1016/j.exphem.2014.06.008. [DOI] [PubMed] [Google Scholar]
- Seita J., Weissman I.L. Hematopoietic stem cell: self-renewal versus differentiation. Wiley Interdiscip. Rev. Syst. Biol. Med. 2010;2:640–653. doi: 10.1002/wsbm.86. [DOI] [PMC free article] [PubMed] [Google Scholar]
- Seita J., Sahoo D., Rossi D.J., Bhattacharya D., Serwold T., Inlay M.A., Ehrlich L.I.R., Fathman J.W., Dill D.L., Weissman I.L. Gene expression commons: an open platform for absolute gene expression profiling. PLoS One. 2012;7:1–11. doi: 10.1371/journal.pone.0040321. [DOI] [PMC free article] [PubMed] [Google Scholar]
- Shi W., Oshlack A., Smyth G.K. Optimizing the noise versus bias trade-off for Illumina whole genome expression BeadChips. Nucleic Acids Res. 2010;38:e204. doi: 10.1093/nar/gkq871. [DOI] [PMC free article] [PubMed] [Google Scholar]
- Smyth G.K. Linear models and empirical Bayes methods for assessing differential expression in microarray experiments. Stat. Appl. Genet. Mol. Biol. 2004;3:e3. doi: 10.2202/1544-6115.1027. [DOI] [PubMed] [Google Scholar]
- Stevens W.W., Kim T.S., Pujanauski L.M., Hao X., Braciale T.J. Detection and quantitation of eosinophils in the murine respiratory tract by flow cytometry. J. Immunol. Methods. 2007;327:63–74. doi: 10.1016/j.jim.2007.07.011. [DOI] [PMC free article] [PubMed] [Google Scholar]
- Takeda A. NUP98-HOXA9 induces long-term proliferation and blocks differentiation of primary human CD34+ hematopoietic cells. Cancer Res. 2006;66:6628–6637. doi: 10.1158/0008-5472.CAN-06-0458. [DOI] [PubMed] [Google Scholar]
- Van der Maaten L., Hinton G. Visualizing data using t-SNE. J. Mach. Learn. Res. 2008;9:2579–2605. [Google Scholar]
- Watkins N.A., Gusnanto A., de Bono B., De S., Miranda-saavedra D., Hardie D.L., Angenent W.G.J., Attwood A.P., Ellis P.D., Erber W. A HaemAtlas: characterizing gene expression in differentiated human blood cells. Blood. 2009;113:1–9. doi: 10.1182/blood-2008-06-162958. [DOI] [PMC free article] [PubMed] [Google Scholar]
- Wilson N.K., Kent D.G., Buettner F., Shehata M., Macaulay I.C., Calero-Nieto F.J., Sánchez Castillo M., Oedekoven C.A., Diamanti E., Schulte R. Combined single-cell functional and gene expression analysis resolves heterogeneity within stem cell populations. Cell Stem Cell. 2015;16:712–724. doi: 10.1016/j.stem.2015.04.004. [DOI] [PMC free article] [PubMed] [Google Scholar]
- Zhou F., Li X., Wang W., Zhu P., Zhou J., He W., Ding M., Xiong F., Zheng X., Li Z. Tracing haematopoietic stem cell formation at single-cell resolution. Nature. 2016;533:487–492. doi: 10.1038/nature17997. [DOI] [PubMed] [Google Scholar]
Associated Data
This section collects any data citations, data availability statements, or supplementary materials included in this article.
Supplementary Materials
Data Availability Statement
All data can be viewed and are available for download on haemosphere.org. The dataset is also available in the Gene Expression Omnibus under the accession number GEO: GSE77098.