

Abstract
Objective:
The underlying hypothesis of our work is that specific clinical neuropsychiatric benefits can be achieved by selective activation of specific axonal pathways during deep brain stimulation (DBS). As such, the goal of this study was to develop a method for identifying axonal pathways whose activation is most likely necessary for achieving therapeutic benefits during DBS.
Experimental design:
Our approach combined clinical data, diffusion tensor tractography, and computer models of patient‐specific neurostimulation to identify particular axonal pathways activated by DBS and determine their correlations with individual clinical outcome measures. We used this method to evaluate a cohort of seven treatment‐resistant depression patients treated with DBS of the ventral anterior internal capsule and ventral striatum (VC/VS).
Principal observations:
Clinical responders exhibited five axonal pathways that were consistently activated by DBS. All five pathways coursed lateral and medial to the VS or dorsal and lateral to the nucleus accumbens; however, details of their specific trajectories differed. Similarly, one common pathway was identified across nonresponders.
Conclusions:
Our method and preliminary results provide important background for studies aiming to expand scientific characterization of neural circuitry associated with specific psychiatric outcomes from DBS. Furthermore, identification of pathways linked to therapeutic benefit provides opportunities to improve clinical selection of surgical targets and stimulation settings for DBS devices. Hum Brain Mapp, 2012. © 2011 Wiley Periodicals, Inc.
Keywords: deep brain stimulation, depression, neural activation, axonal pathways, clinical outcomes, psychiatric disorders
INTRODUCTION
Despite undergoing multiple pharmacological and behavioral treatments, a significant number of psychiatric patients diagnosed with treatment‐resistant depression (TRD) remain severely disabled [Giacobbe et al., 2009; Lozano et al., 2008]. For these patients, deep brain stimulation (DBS) represents a surgical alternative that has demonstrated encouraging therapeutic results in early stage clinical trials [Lozano et al., 2008; Malone et al., 2009; Mayberg et al., 2005]. Prevailing hypotheses suggest that the therapeutic benefits of DBS are brought forth by stimulation‐dependent regulation of abnormal network activity [McIntyre and Hahn, 2010]. Unfortunately, definition of precise therapeutic mechanisms and optimal stimulation targets remains restricted by limited characterization of the specific neuronal effects of DBS. Converging biochemical and functional imaging studies have provided insight into complex cortico‐striato‐thalamo‐cortical (CSTC) networks associated with affective and anxiety disorders [Mayberg, 1997; Ward et al., 2010]. Abnormal activity in the amygdala, thalamus, and orbitofrontal and anterior cingulate cortices has prompted different surgical targets to be attempted. For example, DBS of the ventral anterior internal capsule (VAIC)/ventral striatum (VC/VS) (Figs. 1 and 2) has generated long‐term improvement in TRD patients [Malone et al., 2009]. Similarly, DBS of subgenual cingulate white matter has produced sustained improvement in depressive symptoms of TRD patients [Lozano et al., 2008; Mayberg et al., 2005]. However, questions remain on which anatomical targets and axonal pathways are explicitly responsible for the therapeutic benefits of psychiatric DBS [Lujan et al., 2008].
Figure 1.
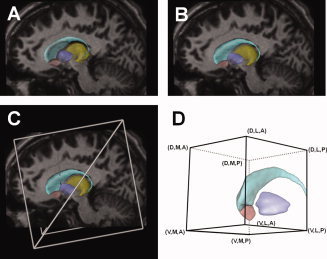
Anatomical models of DBS. A: 3D surfaces representing various nuclei (light blue, caudate nucleus; dark blue, pallidum; pink, nucleus accumbens; yellow, thalamus) displayed on a sagittal view of the MRI for patient CC5. The nuclei surfaces were originally placed within the context of the patient's MRI based on the anterior and posterior commissure points (not visible). B: Nuclei surfaces translated, rotated, and scaled (9 degrees of freedom) to improve the fit of the visible anatomy on the patient's MRI. C: A virtual 3391 DBS electrode was incorporated into the model by using the patient‐specific stereotactic intraoperative electrode location (defined using a Leksell stereotactic frame). A–C: Example data provided for patient CC5 left. D: ROI used to analyze the pathways identified by the streamline tractography. The combinations of letters indicate the general location of the boundaries of each pathway with respect to the ROI (D, dorsal; V, ventral; A, anterior; P, posterior; M, medial; L, lateral). Abbreviations: DBS, deep brain stimulation; MRI, magnetic resonance imaging; ROI, region of interest. [Color figure can be viewed in the online issue, which is available at wileyonlinelibrary.com.]
Figure 2.
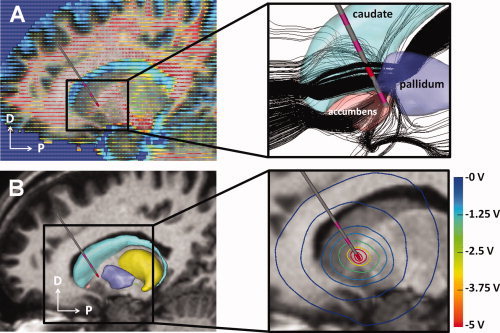
Electrical models of DBS. A: The location of each patient‐specific DBS electrode was defined within the context of the diffusion‐tensor atlas brain. Each tensor (corresponding to one voxel) is represented by an ellipsoid, whose major axis indicates the preferred direction of water diffusivity. Fractional anisotropy is represented by the color of the ellipsoid (red, anisotropic; blue, isotropic). The inset shows the results of streamline tractography (black lines) performed from seed points defined around the patient‐specific electrode location. B: The diffusion‐tensor atlas brain was also used to estimate conductivity‐tensors used in a 3D finite element model of the DBS electric field. The inset shows voltage iso‐contours generated by monopolar cathodic stimulation applied within the ventral anterior internal capsule. Abbreviations: DBS, deep brain stimulation. [Color figure can be viewed in the online issue, which is available at wileyonlinelibrary.com.]
Anatomical tracing work in nonhuman primates and diffusion‐tensor (DT) tractography studies in humans suggest that CSTC networks are functionally segregated [Gutman et al., 2009; Haber and Brucker, 2009; Haber et al., 2006]. Thus, we hypothesize that selective activation of target axonal pathways within CSTC networks is responsible for specific therapeutic effects observed in TRD DBS patients. Furthermore, we hypothesize that these pathways are consistent across patients. Thus, our goal was to identify specific DBS‐activated pathways associated with therapeutic improvements in TRD patients. We set out to identify relationships between patient‐specific DBS electrode location, model predictions of axonal activation, and clinical outcomes. This study presents our first experience with this novel methodology applied to the analysis of seven TRD patients who received bilateral VC/VS DBS therapy.
MATERIALS AND METHODS
Patient Population
All patients underwent pre‐ and postoperative psychiatric evaluations at the Cleveland Clinic as part of a larger multicenter clinical trial of DBS for TRD and obsessive compulsive disorder [Greenberg et al., 2010; Malone et al., 2009]. Patients were evaluated using Hamilton Depression Rating Scale (HDRS), Montgomery–Åsberg Depression Rating Scale (MADRS), and Global Assessment of Functioning (GAF) (Table I). Axonal activation was analyzed in seven TRD patients implanted bilaterally with quadripolar 3391 (formerly 3387‐IES) DBS electrodes (1.27‐mm diameter, 3‐mm contact length, and 4‐mm spacing between adjacent contacts, Medtronic, Minneapolis, MN). Pertinent clinical data on the patients analyzed in this work are summarized in Tables II and III. Ethical approval was obtained from the corresponding institutional review boards before patient enrollment. Informed written consent was obtained after patients met with the psychiatrists and neurosurgeons leading the study. We created a computational DBS model, consisting of anatomical and electrical components, for each of the 14 brain hemispheres included in this study.
Table I.
Clinical outcomes
| Patient | HDRS | MADRS | GAF | |||||||||
|---|---|---|---|---|---|---|---|---|---|---|---|---|
| Baseline score | Last follow‐up score | Score change (%) | Group | Baseline score | Last follow‐up score | Score change (%) | Group | Baseline score | Last follow‐up score | Score change (%) | Group | |
| CC1 | 34 | 9 | 73.5 | 1.1 | 37 | 3 | 91.9 | 2.1 | 45 | 60 | 25 | 3.3 |
| CC2 | 27 | 27 | 0 | 1.3 | 28 | 18 | 35.7 | 2.3 | 45 | 55 | 18.2 | 3.3 |
| CC3 | 37 | 34 | 8.1 | 1.3 | 32 | 25 | 21.9 | 2.3 | 50 | 51 | 2 | 3.3 |
| CC4 | 32 | 1 | 96.9 | 1.1 | 25 | 0 | 100 | 2.1 | 45 | 95 | 52.6 | 3.2 |
| CC5 | 35 | 1 | 97.1 | 1.1 | 30 | 0 | 100 | 2.1 | 45 | 71 | 36.6 | 3.2 |
| CC6 | 26 | 2 | 92.3 | 1.1 | 26 | 0 | 100 | 2.1 | 45 | 95 | 52.6 | 3.2 |
| CC7 | 33 | 0 | 100 | 1.1 | 35 | 0 | 100 | 2.1 | 41 | 95 | 56.8 | 3.2 |
Baseline scores were measured the day before implantation. Patient grouping is described in the form X.Y, where X refers to the corresponding outcome measure (1, HDRS; 2, MADRS; 3, TRD GAF) and Y refers to the type of clinical response (1, remission; 2, nonremission but clinical response; 3, insufficient response or no response).
Table II.
Patient information
| Patient | Gender | Indication | Age at implant (years) | Last follow‐up (months after implant) |
|---|---|---|---|---|
| CC1 | F | TRD | 37 | 41 |
| CC2 | F | TRD | 50 | 35 |
| CC3 | F | TRD | 27 | 30 |
| CC4 | F | TRD | 53 | 28 |
| CC5 | M | TRD | 54 | 19 |
| CC6 | F | TRD | 53 | 17 |
| CC7 | M | TRD | 23 | 15 |
Table III.
Clinical stimulation settings
| Patient | Left side | Right side | ||||||||||
|---|---|---|---|---|---|---|---|---|---|---|---|---|
| Frequency (Hz) | Pulsewidth (μs) | Amplitude (V) | Impedance (Ω) | Electrode configuration | Ring/arc angle (°) | Frequency (Hz) | Pulsewidth (μs) | Amplitude (V) | Impedance (Ω) | Electrode configuration | Ring/arc angle (°) | |
| CC1 | 100 | 150 | 7 | 644 | 0+ 1− | 72/110 | 100 | 150 | 7 | 640 | 0+ 1− | 73/65 |
| CC2 | 130 | 150 | 8 | 1005 | 0− 1− 3+ | 66/117 | 130 | 150 | 7 | 751 | 0− 1− 3+ | 68/56 |
| CC3 | 100 | 90 | 6.5 | 589 | 1− 2− 3+ | 67/123 | 100 | 150 | 8 | 557 | 1− 2− 3+ | 58/62 |
| CC4 | 130 | 210 | 4 | 1359 | 0+ 3− | 59/109 | 130 | 210 | 5 | 1120 | 0− 3+ | 61/63 |
| CC5 | 130 | 90 | 5 | 448 | 1− C+ | 86/126 | 130 | 90 | 5 | 292 | 1− 3− C+ | 80/44 |
| CC6 | 130 | 120 | 5.5 | 946 | 1− 2− 3+ | 77/128 | 130 | 90 | 7 | 568 | 1− 2− 3+ | 69/53 |
| CC7 | 100 | 210 | 5 | 598 | 1− 2− 3+ | 61/125 | 100 | 60 | 6 | 555 | 1− 2− 3+ | 58/57 |
Electrode configuration indicates the contact number (0–3) followed by its type (cathodes are indicated by a negative sign and anodes by a positive sign). Only active contacts are shown in the electrode configuration. The electrode trajectory with respect to the axonal pathways is defined by the intraoperative ring and arc angles for each DBS electrode.
Anatomical Models of Patient‐Specific VC/VS DBS
Each anatomical model included patient‐specific imaging data, a virtual DBS electrode, and three‐dimensional (3D) surface models of striatal, pallidal, and thalamic nuclei (Fig. 1A,C). The virtual electrode was created from a geometric representation of a 3391 DBS electrode. The 3D nuclei surfaces were extracted from a high‐resolution magnetic resonance imaging (MRI) data set [Butson et al., 2007] that was part of a DT atlas brain [Wakana et al., 2004].
We created each anatomical model by following these four steps: first, we identified fiducial markers from a Leksell (Elekta, Stockholm, Sweden) stereotactic head frame visible in each preoperative computed tomography (CT) data set and co‐registered them with pre‐existing fiducial models explicitly defined in stereotactic space (Fig. 1C). This allowed us to define the anterior (AC) and posterior (PC) commissures within a rigid coordinate system. Second, we co‐registered each patient‐specific preoperative MRI and CT images. All co‐registrations were performed using a mutual information algorithm [Viola et al., 2006]. Third, the 3D nuclei surfaces were co‐registered with each patient‐specific preoperative MRI using Cicerone v1.2 [Miocinovic et al., 2007]. This was achieved by aligning the atlas brain with the stereotactic midline and scaling it along its anteroposterior axis such that the AC and PC atlas coordinates matched the explicitly‐defined MRI coordinates. Further alignment and scaling of the atlas surfaces were performed to fit visible nuclei on the MRI. We used simple 4 × 4 affine transformation matrices to rotate, scale, and translate the atlas surfaces in 3D space (9 degrees of freedom) using Cicerone until a satisfactory co‐registration was achieved [Lujan et al., 2009]. These brain nuclei surfaces served as a transition tool linking the anatomical patient space to the DT atlas brain and allowed us to perform transformations between the two corresponding coordinate systems. Finally, a virtual DBS electrode was seeded within each anatomical model using intraoperative stereotactic coordinates (Fig. 1C) [Machado et al., 2009]. We verified the correct placement of each virtual electrode by co‐registering pre‐ and postoperative CT scans.
Anatomical Framework for Identification of Axonal Pathways and Analysis of Axonal Activation
We defined a common anatomical framework on the left side of the DT atlas brain (Fig. 1D) and mapped onto it each virtual DBS electrode from its patient‐specific stereotactic space (Fig. 1C). Individual electrode mappings were obtained by mathematically inverting the 4 × 4 affine transform matrices used to transform the atlas surfaces from DT atlas space into each patient‐specific anatomical model. Next, we identified 3D trajectories of white‐matter axon fibers that could be directly activated by DBS in these seven patients by using a streamline tractography algorithm [Wakana et al., 2004; Weinstein et al., 1999]. Fiber tractography analysis was performed on a 60 × 60 × 60 mm region of interest (ROI; Fig. 1D) encompassing all sites of therapeutic stimulation (i.e., active contacts for all 14 electrodes) and nearby nuclei. This process inferred 228,960 different axon trajectories originating from seed coordinate points within the DT atlas brain voxels (a subset of axon fibers is shown in Fig. 2A inset). Seed points were distributed within 14 cylindrical regions (one for each virtual electrode) that were 52.5 mm in length and with a 9.5 mm radius. These regions encompassed axonal fibers that could be locally activated by DBS (Fig. 2B inset) at maximal clinical stimulation settings (i.e., 210 Hz, 10 V, and 450‐μs pulses). Each seed region was formed by nine planes oriented at 20° intervals and centered on the virtual DBS electrode. Within each plane, seeds were distributed at 1.9 and 0.5 mm horizontal and vertical resolutions, respectively. This distribution of tractography seeds ensured a balance between relevant axonal pathways defined by the tractography while reducing the computational requirements to perform all simulations of neural activation to a manageable size. The trajectories resulting from these seeds propagated along the direction of the principal eigenvector of each voxel within the ROI, preserving voxel‐to‐voxel directional information. Fiber tracking from each seed continued until a highly isotropic region (fractional anisotropy ≤0.2) [Weinstein et al., 1999] or the boundaries of the ROI were reached. Short axon trajectories with total lengths under 10.5 mm, or crossing into the electrode shaft, were discarded before the analysis to prevent edge effects during the axonal activation simulations, which would result in inaccurate activation responses.
Axon Models
A multicompartment model of a myelinated axon (Fig. S1) was created to represent each of the 228,960 axon trajectories identified in the tractography analysis [McIntyre et al., 2002; McNeal, 1976]. Geometrical and biophysical parameters for these axon models were defined according to previously published values for fiber diameters of 5.7 μm [McIntyre et al., 2002]. This fiber diameter is large for the VC/VS and was selected to provide a “worst case” estimate of the spread of axonal activation from DBS. The geometry required to explicitly define the trajectory of each axon was determined using Matlab 7.6 (Mathworks, Natick, MA).
Electrical Models of Patient‐Specific VC/VS DBS
We created 14 individual electric field finite element models (FEMs; one of these models is shown in Fig. 2B) that characterized the patient‐specific voltage distribution within the brain (Fig. 2B, inset) [Butson et al., 2007; Chaturvedi et al., 2010]. Each FEM combined anisotropic properties of brain tissue, capacitance at the electrode‐tissue interface, a thin layer of encapsulation around the electrode, and therapeutic stimulation settings (Table III) [Chaturvedi et al., 2010]. We modeled the brain tissue as an inhomogeneous and anisotropic medium [McIntyre et al., 2004], using the DT atlas brain to provide an estimate of the 3D tissue electrical properties [Miocinovic et al., 2009; Tuch et al., 2001]. The DBS electrode contact was modeled as a purely capacitive element with a 6.6‐μF capacitance to reflect the 3,391 electrode contact size [Butson and McIntyre, 2005]. We incorporated a 0.5‐mm‐thick encapsulation layer surrounding the electrode to account for charge transduction reactions and a 42% voltage drop at the electrode‐tissue interface [Chaturvedi et al., 2010; Miocinovic et al., 2009]. We used Ohm's law to adjust the encapsulation layer conductivity (0.03–0.26 S/m) in each patient‐specific model to match the measured clinical impedance (292–1,452 Ω). We applied patient‐specific stimulation settings to the electric field model and used a Fourier FEM solver to solve Poisson's equation with Dirichlet and Neumann boundary conditions [Butson and McIntyre, 2005]. Each FEM solution provided the voltage distribution within the brain tissue (Figs. 2B, inset and 3).
Figure 3.
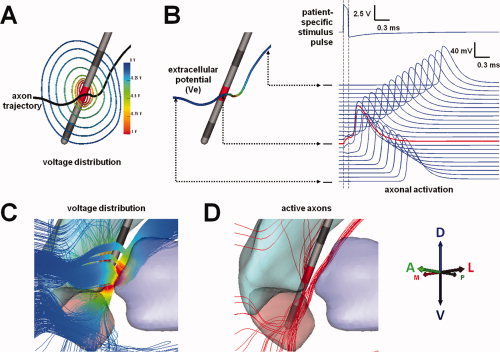
Patient‐specific model of axonal activation. A: Electric field generated by patient‐specific stimulation settings represented by iso‐potential contours; (B) stimulation‐induced extracellular potentials (Ve) interpolated onto an axon model (red corresponds to the highest Ve magnitude and dark blue to the lowest). Action potentials initiate in the axon at the node of Ranvier where the second spatial derivative of the extracellular potential is largest (red trace). Once initiated, action potentials propagate in both directions along the axon (blue traces). C: Extracellular voltages generated by patient‐specific stimulation settings were coupled to multicompartment cable models of axons in the VAIC. D: Axon models directly activated by DBS (example data presented for patient CC5 left, −5V, 90 μs, 130 Hz). Abbreviations: DBS, deep brain stimulation; VAIC, ventral anterior internal capsule. [Color figure can be viewed in the online issue, which is available at wileyonlinelibrary.com.]
Axonal Activation
We analyzed axonal activation across patients by combining all 14 patient‐specific electrodes (Fig. 4C) and their associated axonal trajectories within the common anatomical framework (Fig. 1D). We determined the extracellular voltages along each axon model (Fig. 3B,C) by interpolating the patient‐specific 3D electric fields onto each axon model compartment (Fig. S1). We simulated the axonal response to extracellular stimulation in all 228,960 axon models for the 14 patient‐specific DBS electric fields using NEURON 7.0 [Hines and Carnevale, 1997]. Characterization of axonal activation (Fig. 3D), defined by the generation of a propagating action potential (Fig. 3B), required over 7 million computer simulations. These computer simulations were performed on a Linux‐based high‐performance computing cluster with 15 individual computational nodes and a total of 68 cores running Rocks Clusters 5.3 (University of California at San Diego).
Figure 4.
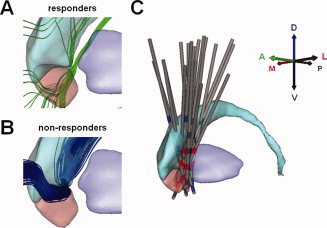
Therapeutic and nontherapeutic axonal activation. A: Activated axons common to at least 75% of the brain hemispheres of TRD responders. B: Activated axons common to at least 75% of brain hemispheres for which TRD patients did not achieve clinical response. C: All 14 virtual DBS electrodes were mapped onto a common anatomical framework defined within the diffusion tensor atlas brain (oblique sagittal view where active cathodes are shown in red, active anodes in blue, and inactive contacts in dark gray). Abbreviations: TRD, treatment‐resistant depression; DBS, deep brain stimulation. [Color figure can be viewed in the online issue, which is available at wileyonlinelibrary.com.]
Correlation of Clinical Outcomes and Activation of Axonal Pathways
We followed the approach of Malone et al. [ 2009] and classified TRD patients into three subgroups for each clinical outcome measure (x): remission (subgroup x.1), nonremission but clinical response (subgroup x.2), and insufficient response or nonresponders (subgroup x.3) (Table I, Fig. S2). Remission was defined as a final score of 10 or less on the HDRS and MADRS measures (groups 1.1 and 2.1, respectively). No remission criteria were defined for GAF measures (groups 3.1). Nonremission clinical response for HDRS (group 1.2) and MADRS (group 2.2) measures was defined as a minimum of 50% improvement from baseline. Clinical response for GAF measure (group 3.2) was defined as a follow‐up score of at least 71. Patients unable to reach significance for therapeutic response were classified as nonresponders (groups 1.3, 2.3, 3.3, 4.3, and 5.3 for HDRS, MADRS, and GAF).
We investigated commonalities in axonal activation across patients to identify axonal pathways associated with therapeutic and nontherapeutic clinical outcomes (see Fig. 4). We combined the patient‐specific active axons for each clinical group described in Table I and analyzed all axons within each group to identify common activation across patients. The probability of producing the clinical outcome associated with each group (e.g., HDRS remission) by stimulating each axon was proportional to the number of patients for which the axon was activated by DBS within that group. Axon fibers activated in at least 75% of the group hemispheres (Fig. S2) were associated with the corresponding clinical outcome (see Fig. 5). Common therapeutic active axons overlapping with common active axons identified in nonresponder groups were excluded from the analysis. Individual axonal pathways were identified using an automated algorithm that grouped active axons with similar trajectories (Fig. S3). The algorithm (S4) is described in the Supporting Information.
Figure 5.
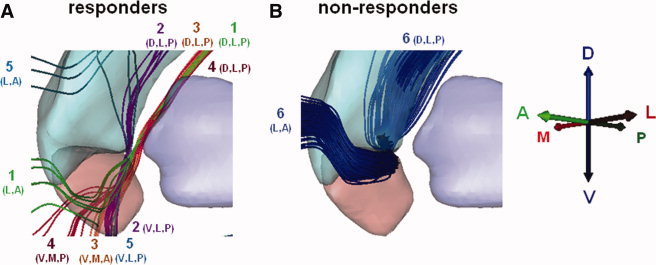
Outcome‐specific axonal pathways. Common active pathways across 75% of the hemispheres in the responder (A) and nonresponder (B) clinical groups. The numbers indicate distinct pathways identified using the algorithm described in Figure S3. The combinations of letters indicate the general location of the boundaries of each pathway with respect to the ROI (D, dorsal; V, ventral; A, anterior; P, posterior; M, medial; L, lateral). Abbreviations: TRD, treatment‐resistant depression.
Statistical Analysis
Statistical analyses of clinical outcomes were performed using one‐way analysis of variance (ANOVA) in Origin 7.5 (OriginLab Co., Northampton, MA). The significance level was set at P < 0.05.
RESULTS
Baseline and chronic DBS clinical outcome scores are summarized in Table I [Malone et al., 2009]. The mean HDRS, MADRS, and GAF improvements from baseline were 66.8% ± 43.7%, 78.5% ± 34.3%, and 34.8% ± 20.7%, respectively. One‐way ANOVA of HDRS, MADRS, and GAF scores showed sustained and significant improvement (P = 0.002, P = 0.0001, and P = 0.002, respectively). Overall, the mean GAF outcome scores for all seven patients increased from 45.1% ± 2.6% to 74.6% ± 20.1%. According to individual HDRS scores, five patients (CC1 and CC4–CC7) were classified as in remission, and two patients (CC2 and CC3) were classified as nonresponders, none fell into the middle category of nonremission but clinical response. HDRS scores for patient CC2 returned to baseline after an undetected battery depletion of the patient's left‐side implantable pulse generator (IPG). Patient CC3 presented initial improvements that were not maintained over time. Follow‐up MADRS scores and percent improvements resulted in identical patient classification to HDRS. Four patients (CC4–CC7) showed final clinical GAF scores of 71 or higher; thereby designating them as clinical responders for this measure. Patients CC4–CC7 achieved large improvements on both HDRS and MADRS measures (>92%).
We created a patient‐specific DBS computational model for each brain hemisphere of each patient (see Fig. 1). DT tractography generated a population of 228,960 axons within our DBS simulation environment (see Fig. 2). Application of patient‐specific DBS electrode locations (see Fig. 1) and stimulation settings to these axons enabled prediction of stimulation induced action potential generation (see Fig. 3). We grouped all axons that were active for all brain hemispheres within each outcome classification. The probability of evoking the clinical outcome associated with each clinical group by activating a specific axon was proportional to the number of hemispheres within the group for which said axon was active. This patient classification (i.e., grouping) allowed us to identify pathways associated with specific clinical improvements common across patients (Fig. S2). In our analysis, we excluded active axons within remission or responder groups that were also active in non‐responders. This allowed us to identify pathways associated exclusively with either therapeutic (Fig. 4A) or nontherapeutic (Fig. 4B) outcomes.
Our analysis identified five distinct active pathways (P1‐5, the numbers correspond to pathway labels in Fig. 5) common to at least 75% of the clinical responder hemispheres. These pathways passed through the VAIC and coursed lateral and medial to the VS or dorsal and lateral to the nucleus accumbens. Despite this local overlap, their specific trajectories were different. It must be noted that the methodology used in this study did not allow us to identify the origin, termination, or direction of transmission of these axons with certainty. Instead, it provides a theoretical definition of the local axon trajectories activated by DBS within a ROI near the implanted DBS electrode (Fig. 1D). All five active pathways were common to at least 75% of the hemispheres in the HDRS remission group (Fig. 5A). Three of these pathways (P2–P4) were also commonly activated across patients in the GAF clinical response group. Pathways 1–4 coursed along the ventromedial surface of the dorsal striatum, from the dorsolateral and posterior region of our ROI. These continued with anterolateral (P1), ventro‐latero‐posterior (P2), ventro‐medial‐anterior (P3), and ventro‐medial‐posterior (P4) projections relative to the boundaries of the ROI. The fifth pathway (P5) overlapped with the ventro‐latero‐posterior segment of pathway 2 in its course along the ventro‐medial portion of the posterior accumbens. This pathway passed dorsally along the lateral head of the caudate, continuing in a lateral and anterior direction over the central caudate. Conversely, one active pathway (P6) was common to 75% of nonresponder hemispheres. This pathway was adjacent to the ventromedial surface of the dorsal striatum and followed a general trajectory similar to pathway P1 (Fig. 5B).
DISCUSSION
Clinical trials of DBS have demonstrated significant therapeutic benefit for the treatment of neuropsychiatric disorders [Lozano et al., 2008; Malone et al., 2009]. However, the precise therapeutic mechanisms, optimal stimulation targets, and specific axonal pathways responsible for therapeutic benefit have yet to be explicitly defined. This study presents an example of how we can use computational models to integrate medical imaging, clinical outcome measures, and medical device technology to gain a better understanding of the effects of a focal psychiatric treatment. Our goal was to develop a novel method to aid in the characterization of explicit axonal pathways responsible for therapeutic benefits of neuropsychiatric DBS, thereby laying the groundwork for new approaches to brain disease management and improved clinical outcomes.
Recent scientific efforts have focused on defining the organization and structural connectivity of neural networks associated with neuropsychiatric disease. Metabolic imaging studies have helped identify cortical and subcortical areas of the brain associated with neuropsychiatric pathologies [Greenberg et al., 2006; Mayberg et al., 2005; Saxena et al., 2004]. Similarly, anatomical tracing studies in nonhuman primates have provided insight into the organization of networks involved with these areas [An et al., 1998; Carmichael and Price, 1996; Freedman et al., 2000]. More recently, functional definition of these networks has been augmented by the use of diffusion tensor imaging (DTI) tractography [Wakana et al., 2007]. DTI‐based tractography has shown CSTC projections from the VC/VS and subcallosal cingulate white matter (the two most actively researched surgical targets for neuropsychiatric DBS) overlapping in multiple regions of the brain associated with antidepressant responses [Gutman et al., 2009; Johansen‐Berg et al., 2008]. However, detailed tracing in nonhuman primates has shown that, while the general trajectory of axonal pathways can overlap, anatomical segregation is typically maintained [Haber et al., 2006]. Thus, it becomes evident that individually, imaging and anatomical techniques only provide pieces of a larger puzzle on DBS. We propose that computational models add another piece to that puzzle and enable unique opportunities to refine our understanding of the neural networks associated with psychiatric disease as well as aid in the definition of surgical targets and selection of optimal stimulation settings.
It has been shown that TRD is associated with distinct neural networks that include regions of overlap [Kopell et al., 2004; Mayberg, 1997]. However, our analysis of axonal activation within the VC/VS (one of such regions) showed that the best therapeutic outcomes were achieved only when axonal pathways associated with the responder group were activated. Our results from this initial group of patients suggest that pathways lateral and posterior to the middle portion (on a dorsal‐ventral direction) of the VS should be the focus of investigation for future TRD DBS studies (see Fig. 5). However, careful attention should also be paid to pathways coursing dorsal and lateral to the VS. More importantly, our results showed that clinical outcomes deteriorated when therapeutic pathways overlapping with pathways identified in the nonresponder group were activated. These findings support our hypothesis that therapeutic improvements require unique and selective activation of axonal pathways associated with specific clinical benefits. Furthermore, they suggest that simultaneous activation of optimal and nonoptimal pathways may deteriorate, slow down the progression of, and even prevent clinical improvements.
Although the results of this study were generated with some of the most advanced computational techniques currently available, our methods make use of several simplifications that should be acknowledged. First, we performed fiber tractography on a single diffusion tensor atlas brain, which prevented true patient‐specific analysis of axonal activation. Although the use of patient‐specific DTI would suggest a more accurate representation of specific pathways activated by DBS, their inherent lower resolution and lower signal‐to‐noise ratio (compared to the atlas brain) would have introduced additional sources of error for the tractography analysis. Furthermore, the use of a single DTI atlas brain allowed us to directly compare axonal activation within a common anatomical framework for a wide range of patients. Additionally, the DTI atlas brain allowed us to build a single library of axonal pathways that was consistent across all patients and is expandable as new data are collected.
A second simplification of note was that we identified axonal trajectories using streamline tractography for a small 60 × 60 × 60 mm VC/VS ROI. In streamline tractography, the trajectory obtained can point in an erroneous direction when multiple fibers cross within a DTI voxel (e.g., crossing or branching fibers) or the voxel tensor is homogeneous (e.g., gray matter or cerebrospinal fluid), causing incorrect tract propagation [Singh and Wong, 2010]. Furthermore, restricting the size of the ROI prevented us from determining the connectivity from these activated therapeutic and nontherapeutic pathways to specific cortical and subcortical structures with any degree of certainty. On the other hand, this size restriction allowed us to confidently identify and analyze explicit fiber pathways around the electrode that were likely activated by DBS while maintaining a manageable data set. Furthermore, the evolving fields of probabilistic tractography [Hua et al., 2008; Wakana et al., 2007; Zhang et al., 2010] and independent component analysis DTI [Singh and Wang, 2010] provide hope that the origin and termination of the pathways identified in this study can be statistically defined in the near future.
A third simplification was that each brain hemisphere was treated as an independent set of anatomical pathways to increase our sample size and constrain identification of potential therapeutic pathways. Although the stimulation settings were originally defined unilaterally, the clinical outcomes used to classify patients into clinical subgroups were obtained after chronic bilateral stimulation. As such, the relationship between left and right stimulation to clinical response may or may not be independent. However, patients received maximal clinical benefit when stimulated bilaterally, suggesting that there is at least some degree of benefit from independent stimulation on each side. Our bilateral analysis may have masked possible differences and clinical implications between left and right DBS. However, by analyzing pathway activation simultaneously across both hemispheres, we were able to constrain the number and distribution of common fiber trajectories and increase the probability of identifying relevant therapeutic pathways.
Another important limitation was that we only analyzed a limited number of clinical outcomes, which were generated for a single stimulation setting at one point in time for each patient. A more extensive analysis of the parameter space and associated clinical outcomes, performed over multiple instances in time, may be able to shed some light into the progression of the disease, the therapeutic mechanisms of DBS, and any possible differences in axonal activation between left, right, and bilateral stimulation. Nonetheless, the stimulation settings we did evaluate represented the culmination of exhaustive searches through the parameter space to achieve clinically defined maximal therapeutic benefits [Malone et al., 2009], thus justifying our focus on the most recent clinical settings.
Ultimately, the true power of the methods outlined in this study lie in their ability to analyze and integrate axonal activation data from multiple patients. As such, future work combining high‐resolution patient‐specific DTI and probabilistic tractography may help establish a more complete and refined depiction of optimal target pathways and corresponding functional interconnections. Additionally, analysis of data with larger variability and larger patient populations (e.g., multicenter data) will increase the statistical power of the analysis, enhancing the accuracy of the axonal pathway predictions. Another critical step in this line of research should be to correlate these human pathways with their nonhuman primate counterparts defined from detailed histological staining studies [Croxson et al., 2005; Haber and Brucker, 2009; Haber et al., 2006], thereby enabling analysis of true anatomical interconnections. Nonetheless, the results of our study represent an important step toward mapping neuronal circuits responsible for specific clinical outcomes in neuropsychiatric DBS. Further interconnection between imaging, modeling, and anatomical analysis should enable definition of the most effective brain locations for targeting specific limbic and cognitive pathologies associated with psychiatric disease. Similar to our experience in Parkinson's disease [Frankemolle et al., 2010], we expect that definition of optimal target pathways will enable computational selection of stimulation settings that will help maximize therapeutic outcomes without exhaustive trial‐and‐error searches through the extensive DBS parameter space.
Supporting information
Additional supporting information may be found in the online version of this article.
Supporting Information Figure 1.
Supporting Information Figure 2.
Supporting Information Figure 3.
Acknowledgements
The authors thank Susumu Mori, Ph.D. for providing the DTI atlas used in this study and Scott Cooper, M.D., Ph.D., for his insightful comments during the preparation of this manuscript.
Conflict of interest for A.C., A.G.M., A.R.R., C.C.M. and J.L.L. (Intelect Medical Inc.); A.R.R. and D.A.M. (Medtronic Inc.); A.C. and C.C.M. (Boston Scientific Corp.).
REFERENCES
- An X, Bandler R, Ongur D, Price JL ( 1998): Prefrontal cortical projections to longitudinal columns in the midbrain periaqueductal gray in macaque monkeys. J Comp Neurol 401: 455–479. [PubMed] [Google Scholar]
- Butson CR, McIntyre CC ( 2005): Tissue and electrode capacitance reduce neural activation volumes during deep brain stimulation. Clin Neurophysiol 116: 2490–2500. [DOI] [PMC free article] [PubMed] [Google Scholar]
- Butson CR, Cooper SE, Henderson JM, McIntyre CC ( 2007): Patient‐specific analysis of the volume of tissue activated during deep brain stimulation. NeuroImage 34: 661–670. [DOI] [PMC free article] [PubMed] [Google Scholar]
- Carmichael ST, Price JL ( 1996): Connectional networks within the orbital and medial prefrontal cortex of macaque monkeys. J Comp Neurol 371: 179–207. [DOI] [PubMed] [Google Scholar]
- Chaturvedi A, Butson CR, Lempka SF, Cooper SE, McIntyre CC ( 2010): Patient‐specific models of deep brain stimulation: Influence of field model complexity on neural activation predictions. Brain Stimulat 3: 65–77. [DOI] [PMC free article] [PubMed] [Google Scholar]
- Croxson PL, Johansen‐Berg H, Behrens TE, Robson MD, Pinsk MA, Gross CG, Richter W, Richter MC, Kastner S, Rushworth MF ( 2005): Quantitative investigation of connections of the prefrontal cortex in the human and macaque using probabilistic diffusion tractography. J Neurosci 25: 8854–8866. [DOI] [PMC free article] [PubMed] [Google Scholar]
- Frankemolle AM, Wu J, Noecker AM, Voelcker‐Rehage C, Ho JC, Vitek JL, McIntyre CC, Alberts JL ( 2010): Reversing cognitive‐motor impairments in Parkinson's disease patients using a computational modelling approach to deep brain stimulation programming. Brain 133( Pt 3): 746–761. [DOI] [PMC free article] [PubMed] [Google Scholar]
- Freedman LJ, Insel TR, Smith Y ( 2000): Subcortical projections of area 25 (subgenual cortex) of the macaque monkey. J Comp Neurol 421: 172–188. [PubMed] [Google Scholar]
- Giacobbe P, Mayberg HS, Lozano AM ( 2009): Treatment resistant depression as a failure of brain homeostatic mechanisms: Implications for deep brain stimulation. Exp Neurol 219: 44–52. [DOI] [PubMed] [Google Scholar]
- Greenberg BD, Malone DA, Friehs GM, Rezai AR, Kubu CS, Malloy PF, Salloway SP, Okun MS, Goodman WK, Rasmussen SA ( 2006): Three‐year outcomes in deep brain stimulation for highly resistant obsessive‐compulsive disorder. Neuropsychopharmacology 31: 2384–2393. [DOI] [PubMed] [Google Scholar]
- Greenberg BD, Gabriels LA, Malone DA Jr, Rezai AR, Friehs GM, Okun MS, Shapira NA, Foote KD, Cosyns PR, Kubu CS, Malloy PF, Salloway SP, Giftakis JE, Rise MT, Machado AG, Baker KB, Stypulkowski PH, Goodman WK, Rasmussen SA, Nuttin BJ ( 2010): Deep brain stimulation of the ventral internal capsule/ventral striatum for obsessive‐compulsive disorder: Worldwide experience. Mol Psychiatry 15: 64–79. [DOI] [PMC free article] [PubMed] [Google Scholar]
- Gutman DA, Holtzheimer PE, Behrens TE, Johansen‐Berg H, Mayberg HS ( 2009): A tractography analysis of two deep brain stimulation white matter targets for depression. Biol Psychiatry 65: 276–282. [DOI] [PMC free article] [PubMed] [Google Scholar]
- Haber SN, Brucker JL ( 2009): Cognitive and limbic circuits that are affected by deep brain stimulation. Front Biosci 14: 1823–1834. [DOI] [PubMed] [Google Scholar]
- Haber SN, Kim KS, Mailly P, Calzavara R ( 2006): Reward‐related cortical inputs define a large striatal region in primates that interface with associative cortical connections, providing a substrate for incentive‐based learning. J Neurosci 26: 8368–8376. [DOI] [PMC free article] [PubMed] [Google Scholar]
- Hines ML, Carnevale NT ( 1997): The NEURON simulation environment. Neural computation 9: 1179–1209. [DOI] [PubMed] [Google Scholar]
- Hua K, Zhang J, Wakana S, Jiang H, Li X, Reich DS, Calabresi PA, Pekar JJ, van Zijl PC, Mori S ( 2008): Tract probability maps in stereotaxic spaces: Analyses of white matter anatomy and tract‐specific quantification. Neuroimage 39: 336–347. [DOI] [PMC free article] [PubMed] [Google Scholar]
- Johansen‐Berg H, Gutman DA, Behrens TE, Matthews PM, Rushworth MF, Katz E, Lozano AM, Mayberg HS ( 2008): Anatomical connectivity of the subgenual cingulate region targeted with deep brain stimulation for treatment‐resistant depression. Cereb Cortex 18: 1374–1383. [DOI] [PMC free article] [PubMed] [Google Scholar]
- Kopell BH, Greenberg B, Rezai AR ( 2004): Deep brain stimulation for psychiatric disorders. J Clin Neurophysiol 21: 51–67. [DOI] [PubMed] [Google Scholar]
- Lozano AM, Mayberg HS, Giacobbe P, Hamani C, Craddock RC, Kennedy SH ( 2008): Subcallosal cingulate gyrus deep brain stimulation for treatment‐resistant depression. Biol Psychiatry 64: 461–467. [DOI] [PubMed] [Google Scholar]
- Lujan JL, Chaturvedi A, McIntyre CC ( 2008): Tracking the mechanisms of deep brain stimulation for neuropsychiatric disorders. Front Biosci 13: 5892–5904. [DOI] [PMC free article] [PubMed] [Google Scholar]
- Lujan JL, Noecker AM, Butson CR, Cooper SE, Walter BL, Vitek JL, McIntyre CC ( 2009): Automated 3‐dimensional brain atlas fitting to microelectrode recordings from deep brain stimulation surgeries. Stereotact Funct Neurosurg 87: 229–240. [DOI] [PMC free article] [PubMed] [Google Scholar]
- Machado A, Haber S, Sears N, Greenberg B, Malone D, Rezai A ( 2009): Functional topography of the ventral striatum and anterior limb of the internal capsule determined by electrical stimulation of awake patients. Clin Neurophysiol 120: 1941–1948. [DOI] [PubMed] [Google Scholar]
- Malone DA Jr, Dougherty DD, Rezai AR, Carpenter LL, Friehs GM, Eskandar EN, Rauch SL, Rasmussen SA, Machado AG, Kubu CS, Tyrka AR, Price LH, Stypulkowski PH, Giftakis JE, Rise MT, Malloy PF, Salloway SP, Greenberg BD ( 2009): Deep brain stimulation of the ventral capsule/ventral striatum for treatment‐resistant depression. Biol Psychiatry 65: 267–275. [DOI] [PMC free article] [PubMed] [Google Scholar]
- Mayberg HS ( 1997): Limbic‐cortical dysregulation: A proposed model of depression. J Neuropsychiatry Clin Neurosci 9: 471–481. [DOI] [PubMed] [Google Scholar]
- Mayberg HS, Lozano AM, Voon V, McNeely HE, Seminowicz D, Hamani C, Schwalb JM, Kennedy SH ( 2005): Deep brain stimulation for treatment‐resistant depression. Neuron 45: 651–660. [DOI] [PubMed] [Google Scholar]
- McIntyre CC, Hahn PJ ( 2010): Network perspectives on the mechanisms of deep brain stimulation. Neurobiol Dis 38: 329–337. [DOI] [PMC free article] [PubMed] [Google Scholar]
- McIntyre CC, Richardson AG, Grill WM ( 2002): Modeling the excitability of mammalian nerve fibers: Influence of afterpotentials on the recovery cycle. J Neurophysiol 87: 995–1006. [DOI] [PubMed] [Google Scholar]
- McNeal DR ( 1976): Analysis of a model for excitation of myelinated nerve. IEEE Trans Bio‐med Eng 23: 329–337. [DOI] [PubMed] [Google Scholar]
- Miocinovic S, Noecker AM, Maks CB, Butson CR, McIntyre CC ( 2007): Cicerone: Stereotactic neurophysiological recording and deep brain stimulation electrode placement software system. Acta Neurochir Suppl 97( Pt 2): 561–567. [DOI] [PubMed] [Google Scholar]
- Miocinovic S, Lempka SF, Russo GS, Maks CB, Butson CR, Sakaie KE, Vitek JL, McIntyre CC ( 2009): Experimental and theoretical characterization of the voltage distribution generated by deep brain stimulation. Exp Neurol 216: 166–176. [DOI] [PMC free article] [PubMed] [Google Scholar]
- Saxena S, Brody AL, Maidment KM, Smith EC, Zohrabi N, Katz E, Baker SK, Baxter LR Jr ( 2004): Cerebral glucose metabolism in obsessive‐compulsive hoarding. Am J Psychiatry 161: 1038–1048. [DOI] [PubMed] [Google Scholar]
- Singh M, Wong CW ( 2010): Independent component analysis‐based multifiber streamline tractography of the human brain. Magn Reson Med 64: 1676–1684. [DOI] [PMC free article] [PubMed] [Google Scholar]
- Tuch DS, Wedeen VJ, Dale AM, George JS, Belliveau JW ( 2001): Conductivity tensor mapping of the human brain using diffusion tensor MRI. Proc Natl Acad Sci USA 98: 11697–11701. [DOI] [PMC free article] [PubMed] [Google Scholar]
- Viola I, Feixas M, Sbert M, Groller ME ( 2006): Importance‐driven focus of attention. IEEE Trans Vis Comput Graph 12: 933–940. [DOI] [PubMed] [Google Scholar]
- Wakana S, Jiang H, Nagae‐Poetscher LM, van Zijl PC, Mori S ( 2004): Fiber tract‐based atlas of human white matter anatomy. Radiology 230: 77–87. [DOI] [PubMed] [Google Scholar]
- Wakana S, Caprihan A, Panzenboeck MM, Fallon JH, Perry M, Gollub RL, Hua K, Zhang J, Jiang H, Dubey P, Blitz A, van Zijl P, Mori S ( 2007): Reproducibility of quantitative tractography methods applied to cerebral white matter. Neuroimage 36: 630–644. [DOI] [PMC free article] [PubMed] [Google Scholar]
- Ward HE, Hwynn N, Okun MS ( 2010): Update on deep brain stimulation for neuropsychiatric disorders. Neurobiol Dis 38: 346–353. [DOI] [PubMed] [Google Scholar]
- Weinstein D, Kindlmann G, Lundberg E ( 1999): Tensorlines: Advection‐diffusion based propagation through diffusion tensor fields. Proceedings of the Conference on Visualization '99: Celebrating ten years. San Francisco, CA: IEEE Computer Society Press; pp 249–253. [Google Scholar]
- Zhang Y, Zhang J, Oishi K, Faria AV, Jiang H, Li X, Akhter K, Rosa‐Neto P, Pike GB, Evans A, Toga AW, Woods R, Mazziotta JC, Miller MI, van Zijl PC, Mori S ( 2010): Atlas‐guided tract reconstruction for automated and comprehensive examination of the white matter anatomy. Neuroimage 52: 1289–1301. [DOI] [PMC free article] [PubMed] [Google Scholar]
Associated Data
This section collects any data citations, data availability statements, or supplementary materials included in this article.
Supplementary Materials
Additional supporting information may be found in the online version of this article.
Supporting Information Figure 1.
Supporting Information Figure 2.
Supporting Information Figure 3.