

Abstract
Background
Thin body condition and weight loss are common in cats with chronic kidney disease (CKD). However, the time course and progression of weight loss before and after diagnosis have not been thoroughly evaluated.
Hypothesis/Objectives
To describe weight loss in cats with CKD before and after diagnosis and its relationship to survival.
Animals
A total of 569 cats (55.5% females and 44.5% males) with CKD from 6 US veterinary practices for which International Renal Interest Society (IRIS) stage, age, date of CKD diagnosis, and at least two body weight measurements were available.
Methods
Body weight measurements were analyzed by time windows and polynomial growth curve analysis. Survival analysis was performed by Kaplan–Meier curves and log‐rank tests.
Results
Median age at diagnosis was 14.9 years (range, 5.0–22.8 years). Cats were categorized at diagnosis as IRIS stage 1 (n = 34 [6%]), stage 2 (n = 345 [61%]), stage 3 (n = 141 [25%]), and stage 4 (n = 49 [9%]). Median body weight at diagnosis was 4.2 kg (range, 1.6–9.9 kg). Cats lost a median of 8.9% of body weight in the 12 months before diagnosis, but weight loss was already present 3 years before diagnosis and accelerated after diagnosis of CKD. Cats <4.2 kg at the time of diagnosis had significantly shorter survival time compared to cats ≥ 4.2 kg at diagnosis (P < .0001).
Conclusions and Clinical Importance
Weight loss can be detected in cats before diagnosis of CKD, accelerates after diagnosis, and is associated with shorter survival. Tracking body weight may help clinicians in earlier diagnosis of CKD.
Keywords: Cachexia, Nutrition, Renal
Abbreviations
- CKD
chronic kidney disease
- IRIS
International Renal Interest Society
Weight loss is common in cats with chronic kidney disease (CKD). The prevalence reported in the literature ranges from 42–82% (Table 1) and depends upon factors such as stage of disease, concurrent diseases, and treatment.1, 2, 3, 4, 5 However, the specific amount and timing of weight loss is difficult to quantify because most studies have been retrospective. One study compared body weight 12 months before and at the time of diagnosis of CKD and found that cats lost a median of 10.8% of body weight in the 12 months before diagnosis.5 Whether loss of body weight begins earlier than 12 months before diagnosis and whether the time course of body weight changes after diagnosis are unknown. Little information is available on body composition of cats with CKD, but the prevalence of cats with CKD that were “thin” or “emaciated” ranges from 36–81% (Table 1).1, 2, 5
Table 1.
Prevalence of weight loss, body composition, and reduced appetite in cats with chronic kidney disease in published studies
| Authors | n | Definition | Prevalence or Amount of Weight Lost |
|---|---|---|---|
| Weight loss | |||
| DiBartola et al1 | 74 | — | Prevalence: 79.1% |
| Elliott et al2 | 80 | — | Prevalence: 42.3–51.3% |
| Goldstein et al3 | 38 | — | Prevalence: |
| Any loss: 81.6% | |||
| 5‐10% loss: 47.4% | |||
| >10% loss: 34.2% | |||
| Boyd et al4 | 211 | — | Prevalence: 67% (>25% loss: 38%) |
| Greene et al5 | 502 | — | Median amount weight lost in 12 months before diagnosis: −10.8% (range, −57.4 to +56.3%) |
| Altered body composition | |||
| Dibartola et al1 | 74 | “Emaciation” | 44.1% |
| Elliott et al2 | 80 | “Thin” | 35.9–80.8% |
| Greene et al5 | 597 | “Thin” | Thin: 66% |
| “Ideal” | Ideal: 8% | ||
| “Heavy” | Heavy: 26% | ||
| Decreased appetite | |||
| Dibartola et al1 | 74 | “Anorexia” | 87.5% |
| Elliott et al2 | 80 | “Poor appetite” | 43.6–92.3% |
| Goldstein et al3 | 38 | “Decreased appetite” | Any decrease in appetite: 71% |
| “Anorexia” | Decreased appetite: 29% | ||
| Anorexia: 42% | |||
| King et al7 | 190 | “Decreased appetite” | 41.4% |
| Greene et al5 | 1230 | “Decrease in appetite” | 20.9% |
| Markovich et al8 | 1079 | “Abnormal appetite” | Abnormal appetite: 43% |
| 1–10 scale by owner (1 = no food intake, 10 = normal appetite) | Mean score = 5.5 ± 2.2 | ||
Mechanisms for weight loss in CKD are multifactorial and include inflammation, malabsorption, increased energy requirements, and decreased appetite.6 Terminology in the veterinary literature regarding decreased appetite is highly variable and often nonspecific (e.g, “anorexia,” “poor appetite,” “decreased appetite”). Retrospective studies providing data on decreased appetite in cats with CKD report a prevalence ranging from 21–92% (Table 1).1, 2, 3, 5, 7, 8 This wide variation likely is related to different stages of disease, lack of information in the medical records about appetite in retrospective studies, and a variety of other factors. One study that surveyed 1079 owners of cats with CKD reported a prevalence of “abnormal appetite” in 43% of affected cats,8 and the mean appetite score was 5.5 ± 2.2, where 1 = no food intake and 10 = normal appetite (unpublished data).
Weight loss in cats with CKD is important because it can negatively impact survival time through direct effects of weight and muscle loss (e.g, weakness and impaired immune function) that have been identified in people with CKD and other chronic disease.9, 10 However, in companion animals, weight loss and decreased appetite could decrease survival time indirectly because of their role in the euthanasia decision for many owners.11 Although studies have identified an association between low body weight or weight loss and survival in cats12 and dogs13 with heart failure and cats with cancer,14 only two studies have evaluated the association between body weight and survival in animals with CKD. One study of dogs with CKD identified a significant association between thin body condition and shorter survival time compared to dogs that were of normal weight or overweight.15 A study of cats with CKD found that cats with body weight ≤4 kg had 2.5 times higher relative risk of death or need for parenteral fluids compared to cats that weighed >4 kg.7 However, this finding was not significant on multivariate analysis.
To address some of these information gaps, the objectives of this study were to: (1) examine the time course of weight loss in cats with CKD both before and after diagnosis and (2) evaluate the relationship between weight loss and survival in cats with CKD.
Materials and Methods
Cats diagnosed with CKD from 6 US veterinary practices between 2006 and 2014 were eligible for this retrospective study. To be included, the following information had to be available: date of diagnosis of CKD, International Renal Interest Society (IRIS) stage, and age. In addition, cats had to have at least 2 body weight measurements: 1 at the time of diagnosis and ≥1 body weight measurement in the 3 years before or after diagnosis. All body weight measurements in the 3 years before and after CKD diagnosis were recorded and analyzed by 2 methods:
Calculation of body weight changes based on time windows
The time windows were constructed around the following time intervals and were made sufficiently wide to include as much data as possible without losing relevance. Cats were counted as having a body weight at a specific time point (e.g, 12 months before diagnosis) if they had a body weight measurement within the prespecified time windows (e.g, day −455 to −275). The prespecified time windows were as follows: 12 months before diagnosis (day −455 to −275), 6 months before diagnosis (day −225 to −141), 3 months before diagnosis (day −118 to −62), 3 months after diagnosis (day +62 to +118), 6 months after diagnosis (day +138 to +222), and 12 months after diagnosis (day +275 to +455). The days were defined relative to the diagnosis date (day 0). Although a simple method of analysis, data were lost when they fell outside of these prespecified windows.
Polynomial Growth Curves
Growth curve analysis was performed by a polynomial, mixed effects model to approximate a curve to fit the observed data.16 The higher‐order terms allow the data to deviate from linearity and give a more accurate representation of the data. The fixed effects model describes the average trajectory across all subjects over time. The random effects model describes the variation among subjects over time with respect to the average trajectory. The correlation structure was assumed to be autoregressive.
Survival and Hazards Analysis
Survival analysis was performed by Kaplan–Meier curves and log‐rank tests. Cats that had not died were right‐censored at their last contact date. Spline regression was used to test for nonlinearity in the predictor variables and for modeling nonlinear functions. This evaluation was performed by a restricted cubic spline model, with 3 knots of weight to create a smooth curve of estimated hazard.17 Commercial statistical software1 was used for all analyses and P < .05 was considered significant.
Results
Five hundred and sixty‐nine cats were enrolled in the study (55.5% spayed females and 44.5% castrated males). At the time of CKD diagnosis, median age was 14.9 years (range, 5.0–22.8 years). The categories of IRIS stages of the cats were as follows: stage 1 (n = 34; 6%), stage 2 (n = 345; 61%), stage 3 (n = 141; 25%), and stage 4 (n = 49; 9%). Median body weight for all 569 cats at the time of diagnosis was 4.2 kg (1.6–9.9 kg). Body weight was lower with increasing age quartiles: <13.0 years (4.6 kg [range, 2.0–9.9 kg]), 13.0– <15.0 years (4.4 kg [range, 1.9–9.4 kg]), 15.0– <16.5 years (4.1 kg [range, 2.0–8.1 kg]), ≥16.5 years (3.7 kg [range, 1.6–8.7 kg]; P < .001). Body weight also varied with severity of CKD IRIS stage 1 (4.3 kg [range, 1.9–7.9 kg]), IRIS stage 2 (4.4 kg [range, 2.1–9.9 kg]), IRIS stage 3 (3.8 kg [range, 1.6–9.6 kg]), and IRIS stage 4 (3.8 kg [range, 2.0–7.3 kg]; P < .001).
All 569 cats had a body weight measurement at the time of diagnosis (because it was 1 part of the inclusion criteria). In the 3 years before diagnosis, the median number of body weight measurements was 6 (range, 1–47), whereas in the 3 years after diagnosis, the median number of body weight measurements was 4 (range, 1–128). The number of cats with body weight assessments in each of the time windows ranged widely (Table 2), from a low at 3 months before diagnosis (n = 96) to a high at 12 months before diagnosis (n = 273). By means of the time points of 12 months before diagnosis (median body weight = 4.71 kg [range, 2.3–12.9 kg]) and time of diagnosis (median body weight = 4.36 kg [range, 1.6–9.6 kg]), the median percentage change in body weight for the 273 cats with body weight measurements at both time points was −8.9% (range, −47.7 to +45.9%). The median percentage change from the time of diagnosis to 12 months after diagnosis (n = 181 cats) was −6.2% (range, −53.9 to +29.7%).
Table 2.
Number of body weight assessments in each time window for 569 cats with chronic kidney disease. Cats were counted as having a body weight at a specific time point (e.g, 12 months before diagnosis) if they had a body weight measurement within the prespecified time windows (e.g, Day −455 to −275). The days were defined relative to the diagnosis date (Day 0)
| Prediagnosis | Diagnosis | Postdiagnosis | |||||
|---|---|---|---|---|---|---|---|
| Time point | 12 months before diagnosis | 6 months before diagnosis | 3 months before diagnosis | Day 0 | 3 months after diagnosis | 6 months after diagnosis | 12 months after diagnosis |
| Window | Day −455 to −275 | Day −225 to −141 | Day −118 to −62 | Day 0 | Day +62 to +118 | Day +138 to +222 | Day +275 to +455 |
| Number of cats in window | 273 | 168 | 96 | 569 | 192 | 194 | 181 |
To examine the time course of weight loss more closely by means of data from all 569 cats, growth curve analysis was performed. This evaluation identified a fixed effects solution with the estimated model: body weight = 4.43–0.417 × time – 0.05 × time2 – 0.002 × time3 (Fig 1). Based on this model, the estimated weight loss during each year (from 3 years before diagnosis of CKD to 3 years after diagnosis) was as follows: year −3 to year −2: −0.21 kg, year −2 to year −1: −0.28 kg, year −1 to diagnosis: −0.37 kg, diagnosis to year +1: −0.47 kg, year +1 to year +2: −0.58 kg, and year +2 to year +3: −0.71 kg. Body weight changes also were associated with age and IRIS stage (Fig 2A and B).
Figure 1.
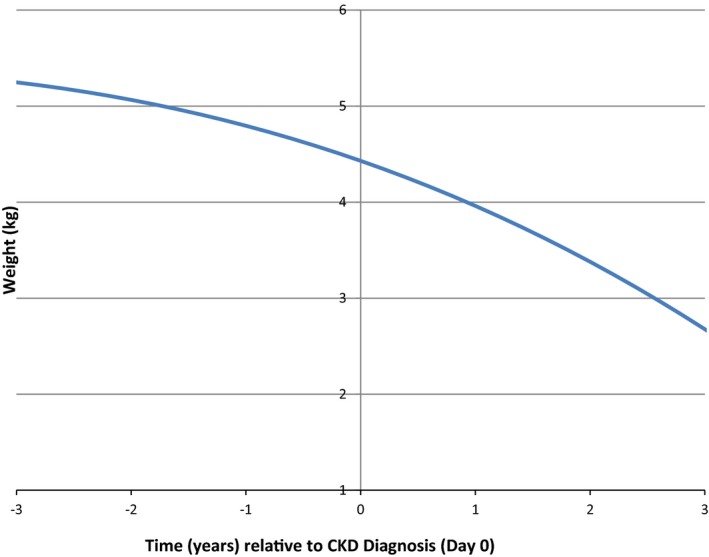
Estimated body weight changes by growth curve analysis in 569 cats with chronic kidney disease (CKD).
Figure 2.
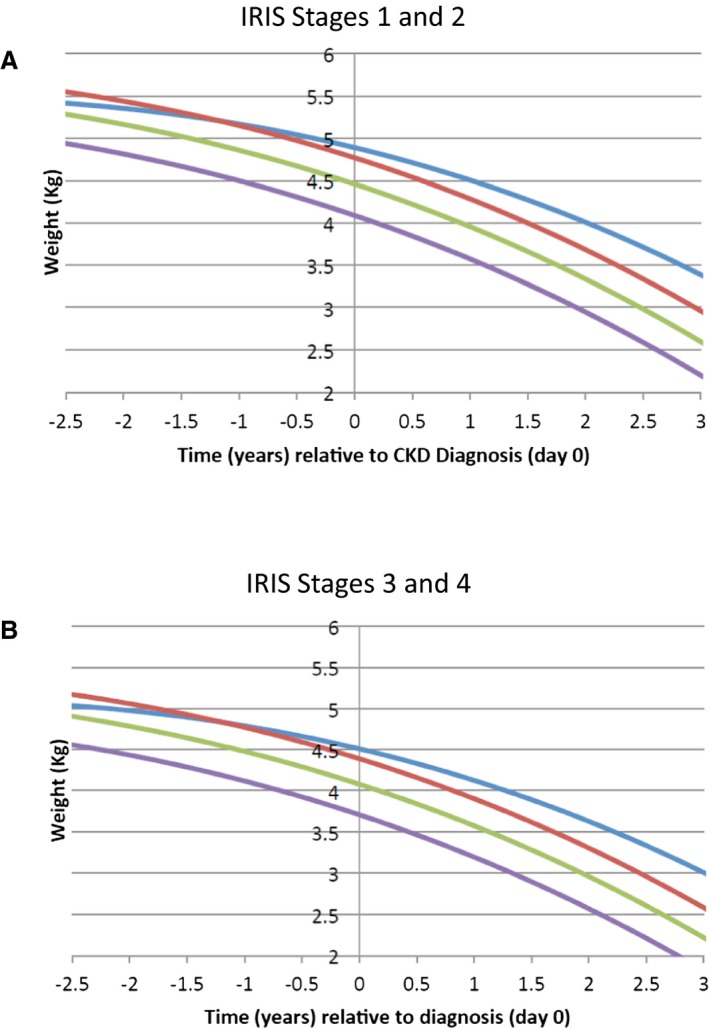
Estimated body weight changes by age group at the time of diagnosis in cats with chronic kidney disease (CKD) for cats in International Renal Interest Society (IRIS) stage 1 or 2 (A) and stage 3 or 4 (B). Age group 1 < 13.0 years (blue line), age group 2 = 13.0– <15.0 years (red line), age group 3 = 15.0– <16.5 years (green line), and age group 4 ≥ 16.5 years (purple line). Data show combined results for male and female cats.
Median survival time (i.e, time from diagnosis to death or censor) was 17.7 months (range, 0.0 to 93.4 months); 58.5% of cats were still alive at the time of analysis. Survival times were compared among sex, age, IRIS stage, and body weight categories. Sex was not significantly associated with survival (P = .470). Cats in IRIS stage 1 or 2 had significantly longer survival times compared to cats in IRIS stage 3 or 4 at the time of diagnosis (P < .0001; Fig 3). Age also was significantly associated with survival time (Fig 4): Cats had significantly shorter survival times with increasing age (P < .0001). Cats with a body weight at diagnosis higher than the group median (4.2 kg) had a significantly longer survival time compared to cats with a body weight lower than the group median (P < .0001; Fig 5). The predicted hazard ratio varied with body weight, with cats at the lowest body weights and also the highest body weights having the highest risk for death (i.e, a “J‐shaped” curve; Fig 6). Multivariate analysis showed that age (P < .0001), IRIS stage (P < .0006), and body weight (P < .0001) all were significantly associated with survival.
Figure 3.
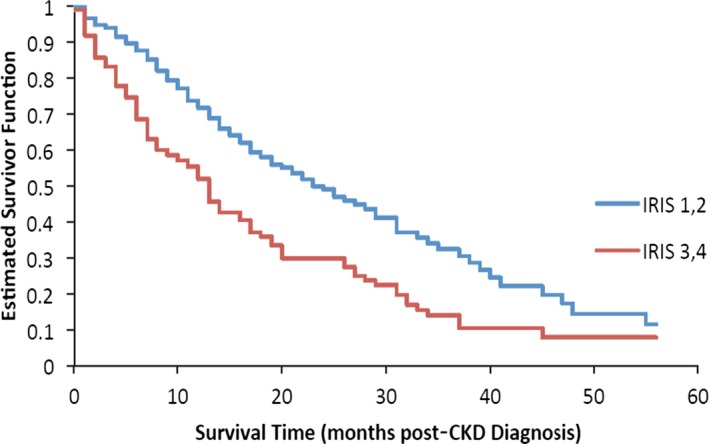
Kaplan–Meier estimate of the survivor function by International Renal Interest Society (IRIS) stage at the time of diagnosis of chronic kidney disease (CKD). Cats in IRIS stage 1 and 2 (blue line) had a significantly longer survival time compared to cats in IRIS stage 3 and 4 (red line), P < .0001).
Figure 4.
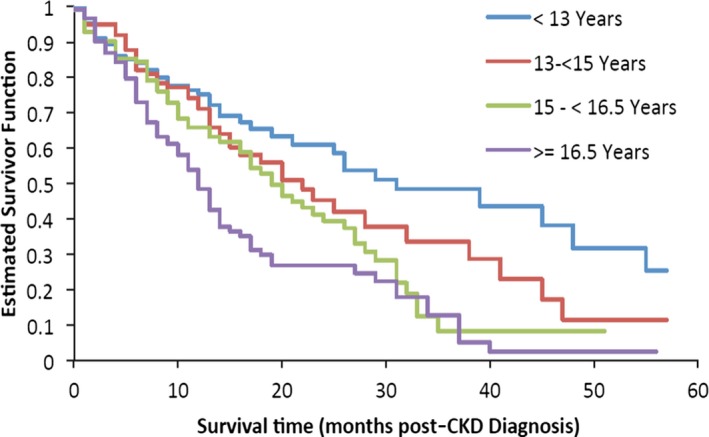
Kaplan–Meier estimate of the survivor function by age at the time of diagnosis of chronic kidney disease (CKD). Cats with increasing age had had significantly shorter survival times (P < .0001).
Figure 5.
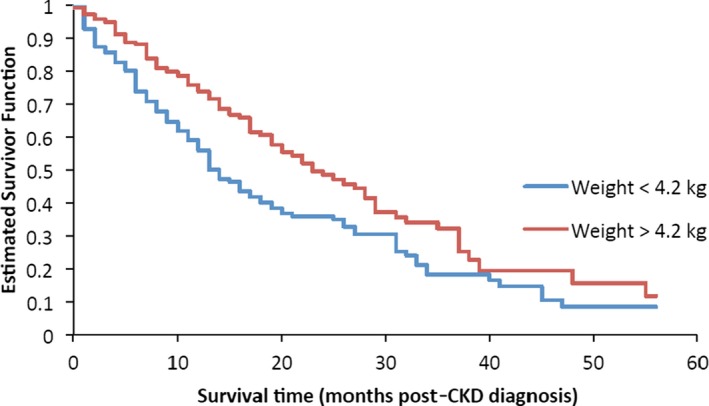
Kaplan–Meier estimate of the survivor function by body weight categories. Cats with a body weight at the time of diagnosis of chronic kidney disease (CKD) higher than the median (4.2 kg) had a significantly longer survival time compared to cats with a body weight <4.2 kg (P < .0001).
Figure 6.
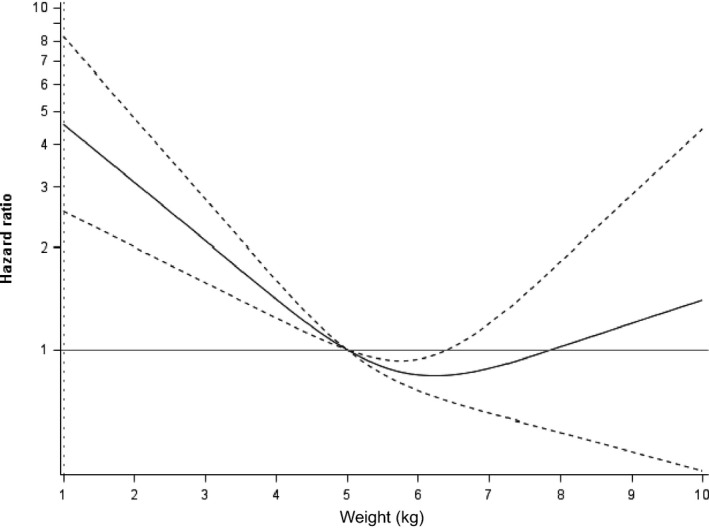
Hazard ratio based on body weight at the time of diagnosis of chronic kidney disease (CKD) in 569 cats. Dotted lines indicate the 95% confidence interval. Cats with the lowest and highest body weights at the time of diagnosis of CKD had shorter survival times than cats with more moderate body weights (P < .0001).
Discussion
By the more limited time window analysis, cats had a median weight loss of −8.9% of body weight in the 12 months before diagnosis of CKD. This finding is similar to a study in which a median loss of −10.8% was reported,5 but our study was limited by the number of cats with body weight measurements at both time points (and even fewer cats at earlier times before and after diagnosis). By growth curve analysis in our study, which included all 569 cats and allowed for additional assessment of the time course of weight loss in these cats, weight loss was identified as early as 3 years before diagnosis of CKD. Growth curve analysis also showed that this weight loss continued at an even faster rate after diagnosis. With the group's median weight loss, a 4.2‐kg‐cat might be expected to lose 0.86 kg in the 3 years before diagnosis and 1.76 kg in the 3 years after diagnosis. However, the amount of weight lost in an individual cat was variable and the time course of weight loss identified in this retrospective study requires confirmation in prospective studies.
In addition to the expected association between IRIS stage and age with survival, low body weight also was associated with a shorter survival time. This negative association between body weight and survival time also was identified in a study of dogs with CKD15 and in the univariate analysis from a study of cats with CKD.7 These findings may be related to negative effects of weight and lean body mass loss but also could be an indirect effect because, anecdotally, owner often report weight loss and decreased appetite to be a factor in the decision for euthanasia (and was identified in a study of dogs with congestive heart failure).11 The significant relationship between low body weight and shorter survival in cats with CKD warrants additional research.
Not only was low body weight associated with shorter survival times, but cats with the highest body weights also had shorter survival times. Although body condition scores were not evaluated in the current retrospective study because of a lack of consistent recording of this variable in the historical medical records, the U‐ or J‐shaped relationship between body weight and survival suggests that an “obesity paradox” may exist in cats with CKD, as it does in people with a variety of chronic conditions, including CKD.9, 18 The obesity paradox is a concept that is used to describe the fact that obesity decreases survival in otherwise healthy people, but in disease (e.g, CKD, congestive heart failure), people who are overweight have longer survival times. A variety of mechanisms have been proposed, but the obesity paradox likely is related to higher lean body mass (overweight and obese people typically have more lean body mass).
Most studies in people have shown either a linear relationship between body mass index and survival (with no negative effects of being overweight or even obese). In a study of 100 dogs with CKD, a significant association was found between thin body condition and shorter survival compared to dogs that were normal weight or overweight.15 The study was not sufficiently powered to evaluate the effects of the highest body condition scores (e.g, 8–9 on a 9‐point scale) compared to overweight (e.g, 6–7 on a 9‐point scale). However, some studies in people with heart disease have shown a U‐ or J‐shaped curve with the shortest survival for underweight people, followed by people at the highest body mass indices, and the longest survival for those who were mildly to moderately overweight.19, 20 Results of our study are similar to those of a study of cats with congestive heart failure,12 which also showed a U‐shaped curve when comparing survival to body weight. In people with CKD and many other chronic diseases, not only does a loss of total body weight occur but a preferential loss of lean body mass occurs. Estimation of lean body mass loss (as documented by muscle condition score or more specific measures of body composition) has not been reported in cats with CKD. Additional research in which both body and muscle condition scores are recorded (and, ideally, more specific measurements of fat and lean body mass) would help to delineate the role of body weight and body composition in survival of cats with CKD.
In addition to the previously mentioned limitations of our study (e.g, retrospective design, lack of body condition and muscle condition scores, and lack of consistent timing of body weight measurements), a number of other issues are important to address. Treatment (both medical and dietary) were not standardized and because diet and medications can affect body weight and survival time,21 these factors could have influenced the results. We also did not control for any potential concurrent diseases that may have been present in these cats, which is an important issue for future prospective studies. In addition, mechanisms underlying the relationship between body weight and survival were not investigated and require further study. A better understanding of the role of weight loss and decreased appetite on an owner's decision for euthanasia also is needed.
Despite these limitations, the results of this study support previous data showing that weight loss is common in cats with CKD. It also extends information from previous research by showing that weight loss is already present at least 3 years before CKD diagnosis and that weight loss appears to increase progressively over time after the diagnosis of CKD. Finally, results show that low (and high) body weight is negatively associated with survival time. These data support the importance of the nutritional assessment guidelines of the World Small Animal Veterinary Association and American Animal Hospital Association,22, 23 which recommend a nutritional assessment be performed on every animal at every visit, which includes body weight, body condition score, muscle condition score, and diet history. Although much additional research is needed, these data suggest that careful monitoring of body weight, in addition to laboratory testing, may allow for an earlier diagnosis of CKD in cats and earlier institution of dietary management and other medical treatments.
Acknowledgment
Supported by Aratana Therapeutics.
Conflict of Interest Declaration
Dr. Freeman reports receiving fees for consulting and serving on an advisory board for Aratana Therapeutics; Dr. Lachaud and Mr. Matthews report receiving fees for consulting with Aratana Therapeutics; Drs. Rhodes and Zollers were employees of Aratana Therapeutics at the time of the study.
Off‐label Antimicrobial Declaration
Authors declare no off‐label use of antimicrobials.
Dr. Zoller is presently affiliated with Norbrook Inc., Overland Park, KS.
Dr. Rhodes is retired and present address is Durham, NH.
Presented in part at the 2015 American College of Veterinary Internal Medicine Forum, Indianapolis, IN and the 8th International Conference on Cachexia, Sarcopenia, and Muscle Wasting, Paris, France, December, 2016.
Footnote
R Development Core Team. R: A language and environment for statistical consulting. Vienna, Austria: R Foundation for Statistical Computing, 2010. Accessed from http://www.R-project.org
References
- 1. DiBartola SP, Rutgers HC, Zack PM, et al. Clinicopathologic findings associated with chronic renal disease in cats: 74 cases (1973–1984). J Am Vet Med Assoc 1987;190:1196–1202. [PubMed] [Google Scholar]
- 2. Elliott J, Barber PJ. Feline chronic renal failure: Clinical findings in 80 cases diagnosed between 1992 and 1995. J Small Anim Pract 1998;39:78–85. [DOI] [PubMed] [Google Scholar]
- 3. Goldstein RE, Marks SL, Cowgill LD, et al. Plasma amino acid profiles in cats with naturally acquired chronic renal failure. Am J Vet Res 1999;60:109–113. [PubMed] [Google Scholar]
- 4. Boyd LM, Langston C, Thompson K, et al. Survival in cats with naturally occurring chronic kidney disease (2000–2002). J Vet Intern Med 2008;22:1111–1117. [DOI] [PubMed] [Google Scholar]
- 5. Greene JP, Lefebvre SL, Wang M, et al. Risk factors associated with the development of chronic kidney disease in cats evaluated at primary care veterinary hospitals. J Am Vet Med Assoc 2014;244:320–327. [DOI] [PubMed] [Google Scholar]
- 6. Freeman LM. Cachexia and sarcopenia: Emerging syndromes of importance in dogs and cats. J Vet Intern Med 2012;26:3–17. [DOI] [PubMed] [Google Scholar]
- 7. King JN, Tasker S, Gunn‐Moore DA, et al. Prognostic factors in cats with chronic kidney disease. J Vet Intern Med 2007;21:906–916. [PubMed] [Google Scholar]
- 8. Markovich JE, Freeman LM, Labato MA, Heinze CR. Survey of dietary and medication practices of owners of cats with chronic kidney disease. J Feline Med Surg 2015;17:979–983. [DOI] [PMC free article] [PubMed] [Google Scholar]
- 9. Kovesdy CP, Anderson JE, Kalantar‐Zadeh K. Paradoxical association between body mass index and mortality in men with CKD not yet on dialysis. Am J Kidney Dis 2007;49:581–591. [DOI] [PubMed] [Google Scholar]
- 10. von Haehling S, Lainscak M, Springer J, et al. Cardiac cachexia: A systematic overview. Pharmacol Ther 2009;121:227–252. [DOI] [PubMed] [Google Scholar]
- 11. Mallery KF, Freeman LM, Harpster NK, et al. Factors contributing to the decision for euthanasia of dogs with congestive heart failure. J Am Vet Med Assoc 1999;214:1201–1204. [PubMed] [Google Scholar]
- 12. Finn E, Freeman LM, Rush JE, et al. The relationship between body weight, body condition, and survival in cats with heart failure. J Vet Intern Med 2010;24:1369–1374. [DOI] [PubMed] [Google Scholar]
- 13. Slupe JL, Freeman LM, Rush JE. Association of body weight and body condition with survival in dogs with heart failure. J Vet Intern Med 2008;22:561–565. [DOI] [PubMed] [Google Scholar]
- 14. Baez JL, Michel KE, Sorenmo K, et al. A prospective investigation of the prevalence and prognostic significance of weight loss and changes in body condition in feline cancer patients. J Feline Med Surg 2007;9:411–417. [DOI] [PMC free article] [PubMed] [Google Scholar]
- 15. Parker VJ, Freeman LM. Association between body condition and survival in dogs with acquired chronic kidney disease. J Vet Intern Med 2011;25:1306–1311. [DOI] [PubMed] [Google Scholar]
- 16. Fairclough DL. Design and Analysis of Quality of Life Studies in Clinical Trials, 2nd ed Boca Raton, FL: Chapman and Hall/CRC; 2010. [Google Scholar]
- 17. Desquilbet L. Dose‐response analyses using restricted cubic spline functions in public health research. Stat Med 2010;29:1037–1057. [DOI] [PubMed] [Google Scholar]
- 18. Kalantar‐Zadeh K, Streja E, Kovesdy CP, et al. The obesity paradox and mortality associated with surrogates of body size and muscle mass in patients receiving hemodialysis. Mayo Clinic Proc 2010;85:991–1001. [DOI] [PMC free article] [PubMed] [Google Scholar]
- 19. Kapoor JR, Heidenreich PA. Obesity and survival in patients with heart failure and preserved systolic function: A U‐shaped relationship. Am Heart J 2010;159:75–80. [DOI] [PubMed] [Google Scholar]
- 20. Musci M, Loforte A, Potapov EV, et al. Body mass index and outcome after ventricular assist device placement. Ann Thoracic Surg 2008;86:1236–1242. [DOI] [PubMed] [Google Scholar]
- 21. Elliott DA. Nutritional management of kidney disease In: Fascetti AJ, Delaney SJ, eds. Applied Veterinary Clinical Nutrition. West Sussex: Wiley‐Blackwell; 2012:251–267. [Google Scholar]
- 22. Baldwin K, Bartges J, Buffington T, et al. AAHA nutritional assessment guidelines for dogs and cats. J Am Anim Hosp Assoc 2010;46:285–296. [DOI] [PubMed] [Google Scholar]
- 23. Freeman L, Becvarova I, Cave N, et al. WSAVA nutritional assessment guidelines. J Small Anim Pract 2011;52:385–396. [DOI] [PubMed] [Google Scholar]