

Abstract
Background:
A substantial excess risk of mortality still exists in persons with type 1 diabetes. The aim of this study was to evaluate the excess risk of mortality in persons with type 1 diabetes without renal complications who target goals for glycemic control and are nonsmokers. Furthermore, we evaluated risk factors of death due to hypoglycemia or ketoacidosis in young adults with type 1 diabetes.
Methods:
We evaluated a cohort based on 33 915 persons with type 1 diabetes and 169 249 randomly selected controls from the general population matched on age, sex, and county followed over a mean of 8.0 and 8.3 years, respectively. Hazard ratios (HRs) for all-cause and cardiovascular disease (CVD) mortality for persons with type 1 diabetes versus controls were estimated.
Results:
The adjusted HRs for all-cause and CVD mortality for persons with type 1 diabetes without renal complications (normoalbuminuria and eGFR ≥ 60 ml/min) and HbA1c ≤ 6.9% (52 mmol/mol) compared to controls were 1.22 (95% CI 0.98-1.52) and 1.03 (95% CI 0.66-1.60), respectively. The HRs increased with higher updated mean HbA1c. For nonsmokers in this group, the HRs for all-cause and CVD mortality were somewhat lower: 1.11 (95% CI 0.87-1.42) and 0.89 (95% CI 0.53-1.48) at updated mean HbA1c ≤ 6.9% (52 mmol/mol). HRs for significant predictors for deaths due to hypoglycemia or ketoacidosis in persons < 50 years were male sex 2.40 (95% CI 1.27-4.52), smoking 2.86 (95% CI 1.57-5.22), lower educational level 3.01 (95% CI 1.26-7.22), albuminuria or advanced kidney disease 2.83 (95% CI 1.63-4.93), earlier hospital diagnosis of hypoglycemia or ketoacidosis 2.30 (95% CI 1.20-4.42), and earlier diagnosis of intoxication 2.53 (95% CI 1.06-6.04).
Conclusions:
If currently recommended HbA1c targets can be reached, renal complications and smoking avoided in persons with type 1 diabetes, the excess risk of mortality will likely converge substantially to that of the general population.
Keywords: type 1 diabetes mellitus, mortality, hypoglycemia, ketoacidosis
Despite aggressive guidelines for risk factor control in persons with type 1 diabetes,1-3 an overall excess risk of mortality remains.4,5 Two registry studies from Scotland and Sweden recently demonstrated excess mortality in persons without renal complications, albeit substantially lower than in those with more advanced renal complications.4,5 An association between excess risk of mortality in those with poor compared to good glycemic control also existed.5 In younger adults (under age 50) with type 1 diabetes, excess risk of mortality was associated with hypoglycemia or ketoacidosis.4,5
The present study is a follow-up analysis from the Swedish National Diabetes Registry (NDR).5 The aim was to improve understanding of risk factor control and mortality in persons with type 1 diabetes. To achieve this, we studied mortality rates in patients without coexisting renal complications, who did not smoke and had optimal glycemic control in relation to matched controls from the general population. We also identified risk factors for death due to ketoacidosis or hypoglycemia in younger adults with type 1 diabetes.
Methods
Participants
The study design and baseline characteristics of the cohort have been described elsewhere.5 In brief, individuals with type 1 diabetes from the Swedish National Diabetes Register (NDR) were included. Type 1 diabetes was defined based on epidemiologic data as treatment with insulin and diagnosis before age 30.5,6 Patients with at least 1 listing in the NDR between January 1, 1998, and December 31, 2011, were included. For every patient record, 5 controls matched on age, sex, and county were randomly selected from the general population. A flow-chart for selection of persons included in the cohort is shown in Figure 1. The final cohort included 33 915 study subjects and 169 249 controls. Subjects and controls were followed from baseline until death or December 31, 2011.
Figure 1.
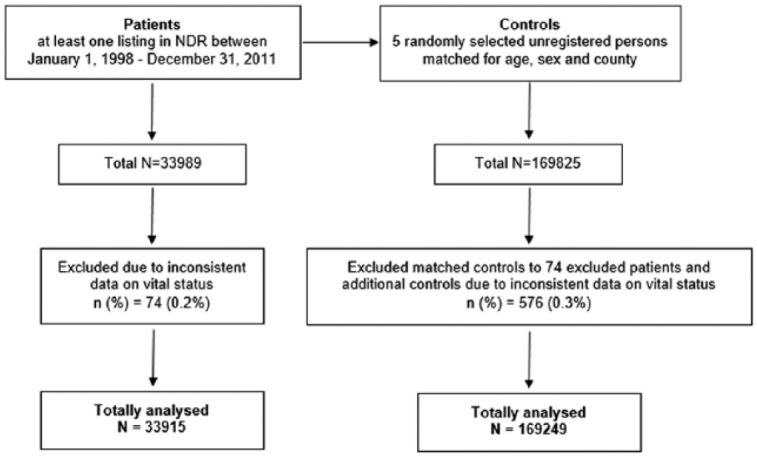
Flow chart for patient selection.
Procedure
Information on coexisting medical conditions and causes of death were retrieved by linking personal identification numbers from patients and controls to the Swedish Inpatient Registry and Cause of Death Registry.5 Information on education and country of birth was retrieved from the Longitudinal Integration Database for Health Insurance and Labor Market Studies.5,7,8
Information on hemoglobin A1c (HbA1c), diabetes duration, smoking, microalbuminuria, and creatinine level were retrieved from NDR. Updated mean HbA1c was used, which is the mean of HbA1c levels until a certain time point, for example, if 3 HbA1c-values exist, it is the mean of these 3 values.9
In Sweden, HbA1c values are measured in accordance with the International Federation of Clinical Chemistry (IFCC) standard.10 Categories of HbA1c were predefined into the general targets of HbA1c and categories of 10 mmol/mol (approximately 1 percentage unit) of HbA1c: less than or equal to 52 mmol/mol (≤6.9%), 53-62 mmol/mol (7.0-7.8%), 63-72 mmol/mol (7.9-8.7%), 73-83 mmol/mol (8.8-9.7%), and ≥83 mmol/mol ( ≥ 9.7%).
Two renal variables5 were evaluated:
Normoalbuminuria, microalbuminuria, macroal buminuria, or chronic kidney disease (CKD) stage 5 (defined as renal dialysis, transplantation, or eGFR<15 ml/min)
Estimated glomerular filtration rate (eGFR) ≥ 60 ml/min, <60 ml/min, or stage 5 CKD
Microalbuminuria was defined as 2 positive results for 3 urine samples obtained within 1 year, with positivity defined as an albumin:creatinine ratio of 3 to 30 mg per millimole (approximately 30 to 300 mg per gram) or a urinary albumin clearance of 20 to 200 μg per minute (20 to 300 mg per liter). Macroalbuminuria was defined as an albumin:creatinine ratio of more than 30 mg per millimole (close to 300 or more mg per gram) or a urinary albumin clearance of more than 200 μg per minute (>300 mg per liter). The Modification of Diet in Renal Disease formula was used to calculate eGFR.11
All-cause and cardiovascular disease (CVD) mortality were evaluated in T1D patients and controls in relation to the 2 renal variables and coexisting updated mean HbA1c levels. The influence of smoking was then added to evaluate excess risk of mortality. Smokers were defined as patients smoking ≥1 cigarette a day or who quit smoking less than 3 months earlier. Smoking status is a variable in the NDR and was categorized into smoking and non-smoking.
To identify predictors of death due to ketoacidosis or hypoglycemia in persons <50 years, we evaluated age, sex, smoking, diabetes duration, education level, born in Sweden or other country, BMI, updated mean HbA1c, insulin delivery type (insulin pump versus multiple daily insulin injections), earlier hypoglycemia or ketoacidosis, renal complications (normo- versus non-normoalbuminuria), eGFR level (CKD stage 1-5), and previous intoxication events. (See the online supplementary material for ICD codes used.)
The study was approved by the ethical committee at the University of Gothenburg (Gothenburg, Sweden).
Statistics
Cox regression was used to evaluate the excess risk of coexisting risk factors on all-cause and CVD mortality, with time-updated mean HbA1c categories and either normoalbuminuria and eGFR ≥ 60 or non-normoalbuminuria or eGFR <60 ml/min as main effect variable. Four models were investigated: model 1 was stratified in matched groups according to age, sex, and county; model 2 was adjusted for time-updated age and sex; model 3 was also stratified for diabetes duration at baseline; model 4 was also adjusted for birth in Sweden or elsewhere, level of education, and prebaseline history of conditions other than diabetes (ie, coronary heart disease, atrial fibrillation, heart failure, acute myocardial infarction, stroke, or cancer). A similar methodology was used for a subgroup of patients that were nonsmokers at baseline. Cox regression was also used in the prediction analyses of death due to ketoacidosis or hypoglycemia. The proportional hazards assumption was fulfilled. All tests were 2-tailed and conducted at the .05 significance level. All analyses were performed by using SAS version 9.4 (SAS Institute).
Results
Baseline characteristics of the cohort consisting of 33 915 subjects and 169 249 controls are shown in Table 1. Mean age was 35.8 and 35.7 years and mean follow-up was 8.0 and 8.3 years, respectively. In persons with diabetes mean HbA1c was 8.2% (65.8 mmol/mol), mean diabetes duration was 20.4 years, and 13.6% were smokers. Number of subjects who died from any cause of mortality was 2701 (8.0%) in the diabetes group and 4835 (2.9%) in the control group, and for CVD mortality the figures were 927 (2.7%) and 1444 (0.9%) respectively. In total, 34% (927/2701) of the deaths in the patient cohort were attributed to CVD. Table 2 shows hazard ratios (HRs) for all-cause and cardiovascular disease (CVD) mortality in persons with type 1 diabetes, normoalbuminuria, and coexisting eGFR ≥ 60 ml/min by various updated mean HbA1c-levels compared to matched controls. HRs in the fully adjusted model for persons with type 1 diabetes and HbA1c ≤ 52 mmol/mol (6.9%) versus controls were 1.22 (95% CI 0.98-1.52) and 1.03 (95% CI 0.66-1.60), respectively, increasing monotonically with higher updated mean HbA1c. For nonsmoking persons with type 1 diabetes the HRs for all-cause and CVD mortality were slightly lower in the fully adjusted model: 1.11 (95% CI 0.87-1.42) and 0.89 (95% CI 0.53-1.48), respectively, for those with updated mean HbA1c ≤ 52 mmol/mol (6.9%) (Table 3).
Table 1.
Baseline Characteristics of Persons With Type 1 Diabetes and Controls.
| HbA1c categories at baseline (NGSP%/IFCC mmol/mol) | ||||||||
|---|---|---|---|---|---|---|---|---|
| Controls n = 169 249 | All type 1 diabetes n = 33 915 | ≤6.9% (≤52 mmol/mol) n = 6142 | 7.0-7.8% (53-62 mmol/mol) n = 7759 | 7.9-8.7% (63-72 mmol/mol) n = 8951 | 8.8-9.6% (73-82 mmol/mol) n = 5442 | ≥9.7% (≥83 mmol/mol) n = 4000 | Missing value n = 1621 | |
| Women | 76 382 (45.1%) | 15 302 (45.1%) | 2711 (44.1%) | 3470 (44.7%) | 3984 (44.5%) | 2451 (45.0%) | 1942 (48.6%) | 744 (45.9%) |
| Age (years) | 35.7 (14.6) | 35.8 (14.6) | 33.9 (14.2) | 37.2 (15.1) | 37.5 (14.8) | 36.1 (14.2) | 32.8 (13.4) | 32.6 (14.5) |
| Born in Sweden | 146 353 (86.5%) | 31 838 (93.9%) | 5732 (93.3%) | 7333 (94.5%) | 8462 (94.5%) | 5110 (93.9%) | 3728 (93.2%) | 1473 (90.9%) |
| Education category | ||||||||
| Low | 31 238 (18.7%) | 6503 (19.3%) | 859 (14.1%) | 1372 (17.8%) | 1704 (19.2%) | 1181 (21.9%) | 1028 (25.9%) | 359 (22.4%) |
| Mid | 80 436 (48.1%) | 16 890 (50.2%) | 2729 (44.8%) | 3688 (48.0%) | 4557 (51.2%) | 2926 (54.2%) | 2204 (55.6%) | 786 (49.1%) |
| High | 55 547 (33.2%) | 10 249 (30.5%) | 2507 (41.1%) | 2627 (34.2%) | 2631 (29.6%) | 1293 (23.9%) | 734 (18.5%) | 457 (28.5%) |
| Variables in the National Diabetes Registry only | ||||||||
| HbA1c (mmol/mol) | 65.8 (15.8) | 45.6 (5.5) | 57.3 (2.6) | 67.2 (2.8) | 76.9 (2.8) | 94.9 (11.3) | ||
| Diabetes duration (years) | 20.4 (14.8) | 16.4 (15.9) | 22.0 (15.0) | 22.8 (14.3) | 21.5 (13.6) | 18.3 (12.9) | 16.8 (14.8) | |
| BMI (kg/m2) | 25.1 (4.0) | 24.6 (4.0) | 25.0 (3.8) | 25.3 (3.8) | 25.4 (4.1) | 25.0 (4.7) | 24.7 (5.0) | |
| LDL (mmol/L) | 2.66 (0.83) | 2.53 (0.76) | 2.60 (0.79) | 2.68 (0.83) | 2.74 (0.86) | 2.87 (0.95) | 2.59 (0.81) | |
| Systolic BP (mmHg) | 126.9 (17.0) | 124.4 (15.9) | 126.8 (16.6) | 128.4 (17.1) | 127.8 (17.2) | 127.0 (18.1) | 123.7 (16.6) | |
| Diastolic BP (mmHg) | 73.6 (9.2) | 72.2 (8.9) | 73.0 (8.9) | 73.8 (9.0) | 74.4 (9.3) | 75.1 (9.6) | 72.9 (9.4) | |
| Smoking | 4277 (13.6%) | 515 (8.9%) | 770 (10.5%) | 1121 (13.3%) | 859 (16.9%) | 855 (23.4%) | 157 (13.1%) | |
| Registrations in the Inpatient Registry prior to baseline | ||||||||
| AMI (I21) | 967 (0.6%) | 745 (2.2%) | 78 (1.3%) | 181 (2.3%) | 221 (2.5%) | 140 (2.6%) | 95 (2.4%) | 30 (1.9%) |
| CHD (I20-I25) | 1826 (1.1%) | 1459 (4.3%) | 173 (2.8%) | 349 (4.5%) | 433 (4.8%) | 262 (4.8%) | 180 (4.5%) | 62 (3.8%) |
| AF (I48) | 938 (0.6%) | 242 (0.7%) | 46 (0.7%) | 58 (0.7%) | 72 (0.8%) | 31 (0.6%) | 25 (0.6%) | 10 (0.6%) |
| HF (I50) | 515 (0.3%) | 513 (1.5%) | 62 (1.0%) | 100 (1.3%) | 159 (1.8%) | 82 (1.5%) | 76 (1.9%) | 34 (2.1%) |
| Stroke (I61-I64) | 728 (0.4%) | 501 (1.5%) | 67 (1.1%) | 117 (1.5%) | 140 (1.6%) | 82 (1.5%) | 68 (1.7%) | 27 (1.7%) |
| Cancer (C00-C97) | 2506 (1.5%) | 607 (1.8%) | 105 (1.7%) | 155 (2.0%) | 170 (1.9%) | 90 (1.7%) | 53 (1.3%) | 34 (2.1%) |
For categorical variables n (%) is presented. For continuous variables, mean (SD) is presented.
Table 2.
Unadjusted and Adjusted Hazard Ratios for All-Cause and Cardiovascular Disease Mortality for Time-Updated Mean Hemoglobin A1c Categories and Time-Updated Normoalbuminuria and Estimated Glomerular Filtration Rate (ml/min).
| Hazard ratio (95% CI), P value |
||||
|---|---|---|---|---|
| Model 1 | Model 2 | Model 3 | Model 4 | |
| All-cause mortality | ||||
| Controls (reference) | 1.00 | 1.00 | 1.00 | 1.00 |
| ≤6.9% (≤52 mmol/mol)—normoalbuminuria and eGFR ≥ 60 | 1.07 (0.84-1.36), 0.59 | 1.18 (0.95-1.46), 0.14 | 1.16 (0.94-1.45), 0.17 | 1.22 (0.98-1.52), 0.077 |
| 7.0-7.8% (53-62 mmol/mol)—normoalbuminuria and eGFR ≥ 60 | 1.46 (1.23-1.72), <.0001 | 1.37 (1.18-1.59), <.0001 | 1.38 (1.19-1.60), <.0001 | 1.36 (1.17-1.57), <.0001 |
| 7.9-8.7% (63-72 mmol/mol)—normoalbuminuria and eGFR ≥ 60 | 1.89 (1.61-2.23), <.0001 | 1.74 (1.51-2.00), <.0001 | 1.76 (1.53-2.02), <.0001 | 1.67 (1.44-1.92), <.0001 |
| 8.8-9.6% (73-82 mmol/mol)—normoalbuminuria and eGFR ≥ 60 | 2.16 (1.68-2.77), <.0001 | 2.32 (1.88-2.86), <.0001 | 2.34 (1.90-2.89), <.0001 | 2.19 (1.77-2.70), <.0001 |
| ≥9.7% (≥83 mmol/mol)—normoalbuminuria and eGFR ≥ 60 | 6.79 (4.54-10.15), <.0001 | 5.82 (4.48-7.56), <.0001 | 5.66 (4.35-7.36), <.0001 | 5.19 (3.99-6.75), <.0001 |
| ≤6.9% (≤52 mmol/mol)—non-normoalbuminuria or eGFR<60 | 4.85 (3.83-6.16), <.0001 | 4.25 (3.59-5.03), <.0001 | 4.24 (3.58-5.01), <.0001 | 3.80 (3.21-4.50), <.0001 |
| 7.0-7.8% (53-62 mmol/mol)—non-normoalbuminuria or eGFR<60 | 4.25 (3.66-4.95), <.0001 | 4.02 (3.59-4.49), <.0001 | 4.01 (3.59-4.49), <.0001 | 3.47 (3.09-3.89), <.0001 |
| 7.9-8.7% (63-72 mmol/mol)—non-normoalbuminuria or eGFR<60 | 5.33 (4.65-6.13), <.0001 | 4.90 (4.44-5.40), <.0001 | 4.95 (4.49-5.46), <.0001 | 4.37 (3.96-4.83), <.0001 |
| 8.8-9.6% (73-82 mmol/mol)—non-normoalbuminuria or eGFR<60 | 5.39 (4.46-6.51), <.0001 | 5.43 (4.76-6.19), <.0001 | 5.54 (4.85-6.31), <.0001 | 4.67 (4.09-5.34), <.0001 |
| ≥9.7% (≥83 mmol/mol)—non-normoalbuminuria or eGFR<60 | 12.16 (9.34-15.83), <.0001 | 12.29 (10.66-14.17), <.0001 | 12.60 (10.92-14.53), <.0001 | 9.95 (8.61-11.50), <.0001 |
| CVD mortality | ||||
| Controls (reference) | 1.00 | 1.00 | 1.00 | 1.00 |
| ≤6.9% (≤52 mmol/mol)—normoalbuminuria and eGFR ≥ 60 | 0.90 (0.56-1.45), 0.66 | 0.98 (0.63-1.52), 0.92 | 0.98 (0.63-1.53), 0.94 | 1.03 (0.66-1.60), 0.89 |
| 7.0-7.8% (53-62 mmol/mol)—normoalbuminuria and eGFR ≥ 60 | 2.11 (1.58-2.83), <.0001 | 1.79 (1.40-2.29), <.0001 | 1.80 (1.41-2.30), <.0001 | 1.70 (1.33-2.18), <.0001 |
| 7.9-8.7% (63-72 mmol/mol)—normoalbuminuria and eGFR ≥ 60 | 2.41 (1.77-3.28), <.0001 | 1.97 (1.52-2.54), <.0001 | 1.98 (1.54-2.56), <.0001 | 1.78 (1.38-2.30), <.0001 |
| 8.8-9.6% (73-82 mmol/mol)—normoalbuminuria and eGFR ≥ 60 | 2.31 (1.45-3.70), .0004 | 2.67 (1.81-3.94), <.0001 | 2.70 (1.83-3.98), <.0001 | 2.33 (1.58-3.43), <.0001 |
| ≥9.7% (≥83 mmol/mol)—normoalbuminuria and eGFR ≥ 60 | 8.40 (3.52-20.04), <.0001 | 6.17 (3.64-10.46), <.0001 | 6.20 (3.66-10.51), <.0001 | 5.56 (3.28-9.43), <.0001 |
| ≤6.9% (≤52 mmol/mol)—non-normoalbuminuria or eGFR<60 | 5.03 (3.37-7.50), <.0001 | 4.58 (3.46-6.05), <.0001 | 4.56 (3.45-6.04), <.0001 | 3.76 (2.84-4.98), <.0001 |
| 7.0-7.8% (53-62 mmol/mol)—non-normoalbuminuria or eGFR<60 | 4.77 (3.72-6.12), <.0001 | 4.83 (4.04-5.79), <.0001 | 4.81 (4.02-5.77), <.0001 | 3.84 (3.20-4.62), <.0001 |
| 7.9-8.7% (63-72 mmol/mol)—non-normoalbuminuria or eGFR<60 | 6.23 (4.94-7.87), <.0001 | 6.11 (5.21-7.16), <.0001 | 6.11 (5.21-7.17), <.0001 | 5.01 (4.26-5.89), <.0001 |
| 8.8-9.6% (73-82 mmol/mol)—non-normoalbuminuria or eGFR<60 | 6.72 (4.83-9.35), <.0001 | 6.97 (5.61-8.66), <.0001 | 7.02 (5.65-8.72), <.0001 | 5.34 (4.29-6.66), <.0001 |
| ≥9.7% (≥83 mmol/mol)—non-normoalbuminuria or eGFR<60 | 13.37 (8.12-22.00), <.0001 | 13.50 (10.43-17.49), <.0001 | 13.58 (10.48-17.60), <.0001 | 9.03 (6.93-11.78), <.0001 |
Model 1 (98.5% individuals with nonmissing data): unadjusted model, matched for age and sex. Model 2 (98.5% individuals with nonmissing data): adjusted for time-updated age and sex. Model 3 (98.5% individuals with nonmissing data): also stratified for diabetes duration at baseline. Model 4 (97.4% individuals with nonmissing data): also adjusted for born in Sweden, maximum education level, and baseline comorbidities (ie, coronary heart disease, atrial fibrillation, heart failure, acute myocardial infarction, stroke, or cancer).
Table 3.
Unadjusted and Adjusted Hazard Ratios for All-Cause and Cardiovascular Disease Mortality for Time-Updated Mean Hemoglobin A1c Categories and Time-Updated Normoalbuminuria and Estimated Glomerular Filtration Rate (ml/min), for Non-smokers at Baseline.
| Hazard ratio (95% CI), P value |
||||
|---|---|---|---|---|
| Model 1 | Model 2 | Model 3 | Model 4 | |
| All-cause mortality | ||||
| Controls (reference) | 1.00 | 1.00 | 1.00 | 1.00 |
| ≤6.9% (≤52 mmol/mol)—normoalbuminuria and eGFR ≥ 60 | 0.96 (0.74-1.26), 0.77 | 1.08 (0.85-1.38), 0.54 | 1.07 (0.84-1.36), 0.59 | 1.11 (0.87-1.42), 0.40 |
| 7.0-7.8% (53-62 mmol/mol)—normoalbuminuria and eGFR ≥ 60 | 1.38 (1.15-1.66), .0007 | 1.29 (1.10-1.53), .0021 | 1.30 (1.11-1.54), .0016 | 1.27 (1.08-1.50), .0049 |
| 7.9-8.7% (63-72 mmol/mol)—normoalbuminuria and eGFR ≥ 60 | 1.74 (1.44-2.09), <.0001 | 1.57 (1.33-1.84), <.0001 | 1.59 (1.35-1.87), <.0001 | 1.50 (1.27-1.77), <.0001 |
| 8.8-9.6% (73-82 mmol/mol)—normoalbuminuria and eGFR ≥ 60 | 1.86 (1.40-2.47), <.0001 | 2.20 (1.73-2.80), <.0001 | 2.22 (1.74-2.83), <.0001 | 2.08 (1.63-2.65), <.0001 |
| ≥9.7% (≥83 mmol/mol)—normoalbuminuria and eGFR ≥ 60 | 6.25 (3.84-10.16), <.0001 | 5.65 (4.08-7.82), <.0001 | 5.45 (3.93-7.54), <.0001 | 5.08 (3.67-7.03), <.0001 |
| ≤6.9% (≤52 mmol/mol)—non-normoalbuminuria or eGFR<60 | 5.08 (3.92-6.59), <.0001 | 4.30 (3.59-5.15), <.0001 | 4.29 (3.58-5.14), <.0001 | 3.79 (3.16-4.55), <.0001 |
| 7.0-7.8% (53-62 mmol/mol)—non-normoalbuminuria or eGFR<60 | 3.91 (3.31-4.63), <.0001 | 3.65 (3.21-4.14), <.0001 | 3.64 (3.21-4.14), <.0001 | 3.13 (2.75-3.56), <.0001 |
| 7.9-8.7% (63-72 mmol/mol)—non-normoalbuminuria or eGFR<60 | 5.02 (4.31-5.85), <.0001 | 4.62 (4.15-5.16), <.0001 | 4.67 (4.19-5.21), <.0001 | 4.13 (3.69-4.62), <.0001 |
| 8.8-9.6% (73-82 mmol/mol)—non-normoalbuminuria or eGFR<60 | 5.08 (4.11-6.29), <.0001 | 5.27 (4.54-6.12), <.0001 | 5.40 (4.64-6.27), <.0001 | 4.49 (3.86-5.23), <.0001 |
| ≥9.7% (≥83 mmol/mol)—non-normoalbuminuria or eGFR<60 | 11.44 (8.33-15.71), <.0001 | 11.66 (9.80-13.87), <.0001 | 12.03 (10.11-14.32), <.0001 | 9.73 (8.16-11.60), <.0001 |
| CVD mortality | ||||
| Controls (reference) | 1.00 | 1.00 | 1.00 | 1.00 |
| ≤6.9% (≤52 mmol/mol)—normoalbuminuria and eGFR ≥ 60 | 0.79 (0.45-1.37), 0.39 | 0.84 (0.51-1.40), 0.51 | 0.85 (0.51-1.41), 0.52 | 0.89 (0.53-1.48), 0.64 |
| 7.0-7.8% (53-62 mmol/mol)—normoalbuminuria and eGFR ≥ 60 | 1.89 (1.36-2.61), .0001 | 1.61 (1.22-2.12), .0008 | 1.62 (1.22-2.13), .0007 | 1.51 (1.14-2.01), .0039 |
| 7.9-8.7% (63-72 mmol/mol)—normoalbuminuria and eGFR ≥ 60 | 2.26 (1.61-3.18), <.0001 | 1.88 (1.42-2.50), <.0001 | 1.90 (1.43-2.52), <.0001 | 1.69 (1.27-2.25), .0003 |
| 8.8-9.6% (73-82 mmol/mol)—normoalbuminuria and eGFR ≥ 60 | 2.18 (1.30-3.65), .0032 | 2.72 (1.76-4.19), <.0001 | 2.75 (1.79-4.24), <.0001 | 2.37 (1.54-3.65), <.0001 |
| ≥9.7% (≥83 mmol/mol)—normoalbuminuria and eGFR ≥ 60 | 8.69 (3.21-23.54), <.0001 | 7.38 (4.07-13.39), <.0001 | 7.37 (4.06-13.37), <.0001 | 6.79 (3.74-12.32), <.0001 |
| ≤6.9% (≤52 mmol/mol)—non-normoalbuminuria or eGFR<60 | 5.71 (3.68-8.87), <.0001 | 4.70 (3.49-6.34), <.0001 | 4.68 (3.47-6.30), <.0001 | 3.80 (2.82-5.14), <.0001 |
| 7.0-7.8% (53-62 mmol/mol)—non-normoalbuminuria or eGFR<60 | 4.33 (3.30-5.68), <.0001 | 4.43 (3.63-5.42), <.0001 | 4.40 (3.60-5.38), <.0001 | 3.46 (2.82-4.25), <.0001 |
| 7.9-8.7% (63-72 mmol/mol)—non-normoalbuminuria or eGFR<60 | 5.97 (4.62-7.71), <.0001 | 5.76 (4.83-6.86), <.0001 | 5.76 (4.82-6.87), <.0001 | 4.69 (3.92-5.61), <.0001 |
| 8.8-9.6% (73-82 mmol/mol)—non-normoalbuminuria or eGFR<60 | 6.62 (4.58-9.59), <.0001 | 6.93 (5.44-8.83), <.0001 | 7.00 (5.49-8.93), <.0001 | 5.22 (4.08-6.69), <.0001 |
| ≥9.7% (≥83 mmol/mol)—non-normoalbuminuria or eGFR<60 | 11.69 (6.41-21.30), <.0001 | 12.54 (9.07-17.32), <.0001 | 12.69 (9.18-17.55), <.0001 | 9.31 (6.69-12.96), <.0001 |
Model 1 (79.1% individuals with nonmissing data): unadjusted model, matched for age and sex. Model 2 (79.1% individuals with nonmissing data): adjusted for time-updated age and sex. Model 3 (79.1% individuals with nonmissing data): also stratified for diabetes duration at baseline. Model 4 (78.3% individuals with nonmissing data): also adjusted for born in Sweden, maximum education level and baseline comorbidities (ie, coronary heart disease, atrial fibrillation, heart failure, acute myocardial infarction, stroke, or cancer).
The HRs for all-cause and CVD mortality for subjects were generally somewhat higher when only 1 renal variable (normoalbuminuria or eGFR ≥ 60 ml/min) was evaluated separately for various updated mean HbA1c levels (Supplemental Tables S1 and S2).
In total, 78% of patients and 52.9% of patient-years belonged to the category of normoalbuminuria + eGFR ≥ 60 ml/min during the study period. Corresponding figures for nonsmokers at baseline belonging to these categories were 63.9% and 44.3%. There were 18.5% of patients and 10.0% of patient-years belonging to the category of updated mean HbA1c ≤ 52 mmol/mol (6.9%), normoalbuminuria, and eGFR ≥ 60 ml/min. In addition, there were 16.0% of persons and 8.8% of patient-years belonging to these categories evaluated in persons with a nonsmoking status at baseline.
The number of patients with diabetes younger than 50 years that have died due to hypoglycemia or ketoacidosis was 81 (3% of all deaths). Univariable and multivariable predictors of death due to hypoglycemia or ketoacidosis in subjects younger than 50 years are shown in Table 4.
Table 4.
Univariable and Multivariable Predictors of Death Due to Ketoacidosis or Hypoglycemia Among Persons With Type 1 Diabetes Followed Until Death or Age 50.
| Variable | Variable value | Hazard ratio (95% CI), P value |
|
|---|---|---|---|
| Univariable analyses | Multivariable analysis | ||
| Time-updated age (years) | By 1-unit increase | 1.02 (0.99-1.05), 0.20 | |
| Time-updated age (ref 18-34 years) | 35-49 years | 1.35 (0.85-2.14), 0.21 | |
| Sex (ref men) | Women | 0.48 (0.30-0.78), 0.30 | 0.42 (0.22-0.79), 0.0069 |
| Time-updated diabetes duration | By 1-unit increase | 1.01 (0.99-1.03), 0.35 | |
| Time-updated diabetes duration (ref 0-1 years) | 2-5 years | 0.27 (0.02-4.36), 0.35 | |
| 6-10 years | 2.65 (0.34-20.52), 0.35 | ||
| 11-15 years | 0.84 (0.10-7.04), 0.87 | ||
| 16-20 years | 2.02 (0.26-15.72), 0.50 | ||
| 21-30 years | 1.13 (0.14-8.93), 0.91 | ||
| 31-40 years | 2.29 (0.29-18.08), 0.43 | ||
| 40+ years | 1.75 (0.15-20.09), 0.66 | ||
| Time-updated insulin method (ref MDI) | Pump | 0.64 (0.29-1.42), 0.27 | |
| Time-updated mean HbA1c (ref ≤6.9% [≤52 mmol/mol]) | 7.0-7.8% (53-62 mmol/mol) | 1.47 (0.52-4.18), 0.47 | |
| 7.9-8.7% (63-72 mmol/mol) | 2.14 (0.79-5.77), 0.13 | ||
| 8.8-9.6% (73-82 mmol/mol) | 4.48 (1.69-11.89), 0.0026 | ||
| ≥9.7% (≥83 mmol/mol) | 8.74 (3.34-22.83), <.0001 | ||
| Education level (ref high) | Low | 9.71 (3.85-24.48), <.0001 | 2.42 (0.81-7.21), 0.11 |
| Middle | 6.57 (2.83-15.25), <.0001 | 3.01 (1.26-7.22), 0.014 | |
| Born in Sweden (ref not born in Sweden) | Born in Sweden | 1.51 (0.48-4.77), 0.49 | |
| Time-updated mean BMI | By 1-unit increase | 0.96 (0.90-1.02), 0.21 | |
| Time-updated smoking status (ref nonsmoking) | Smoking | 3.64 (2.28-5.80), <.0001 | 2.86 (1.57-5.22), 0.0006 |
| Time-updated eGFR (ref CKD stage 1 [eGFR ≥ 90]) | CKD stage 2 (eGFR 60-89) | 0.80 (0.41-1.53), 0.50 | |
| CKD stage 3 (eGFR 30-59) | 2.71 (1.06-6.91), 0.037 | ||
| CKD stage 4 (eGFR 15-29) | 4.40 (1.06-18.28), 0.042 | ||
| CKD stage 5 (eGFR <15, dialysis or transplantation) | 1.96 (0.27-14.30), 0.51 | ||
| Time-updated normoalbuminuria (ref non-normoalbuminuria) | Normoalbuminuria | 0.29 (0.17-0.50), <.0001 | 0.35 (0.20-0.62), 0.0002 |
| Time-updated ketoacidosis/hypoglycemia (ref non–ketoacidosis/hypoglycemia) | Ketoacidosis/hypoglycemia | 2.97 (1.67-5.29), .0002 | |
| Time-updated ketoacidosis/hypoglycemia primary diagnosis (ref non–ketoacidosis/hypoglycemia) | Ketoacidosis/hypoglycemia | 3.39 (1.96-5.86), <.0001 | 2.30 (1.20-4.42), 0.013 |
| Time-updated acute intoxication (ref non–acute intoxication) | Acute intoxication | 5.05 (2.52-10.09), <.0001 | 2.53 (1.06-6.04), 0.036 |
| Time-updated acute intoxication primary diagnosis (ref non–acute intoxication) | Acute intoxication | 4.70 (1.90-11.61), 0.0008 | |
Discussion
In this nationwide study of individuals in Sweden, nonsmoking type 1 diabetic patients with HbA1c <52 mmol/mol (6.9%) without renal complications had no excess risk of mortality compared to that of the general population. Another key finding was the identification of several predictors for death due to hypoglycemia or ketoacidosis in adults with type 1 diabetes younger than age 50, namely male sex, current smoking, lower educational level, presence of microalbuminuria, or more advanced renal complications, earlier hospital diagnosis of hypoglycemia or ketoacidosis, and earlier hospital diagnosis of intoxication.
Strengths of the current study include that all persons with type 1 diabetes in Sweden, in principle, are included in the NDR, which also includes good coverage of risk factors.5 A limitation is that information on several mortality risk factors was not available in controls. However, in contrast to many other studies using general life tables for controls, information on coexisting diseases, educational level, and birth in Sweden existed in both patients and matched controls. Furthermore, although the point estimates for hazard of all-cause and CVD death in nonsmoking persons without renal complications and on-target HbA1c were close to 1 in several models, the confidence intervals were relatively wide, with an upper limit of 1.4-1.5 for all-cause and CVD death respectively. However, these limits are lower than in earlier studies examining risk factors separately.4,5 Furthermore, our findings are strengthened by the fact that consistent patterns were seen between higher updated mean HbA1c and mortality in persons without renal complications. It should be noted that residual confounding cannot be excluded due to the observational nature of the study.
Our results indicate that obtaining good glycemic control early after diagnosis of type 1 diabetes and onward may lead to considerable reductions in excess mortality. Since hyperglycemia is a prerequisite for diabetic nephropathy,12 it may be possible to avoid a major risk factor for mortality in many cases. Furthermore, most persons with type 1 diabetes today are free from renal complications, but most do not reach HbA1c targets (approximately 20% do in Sweden). The current findings suggest that substantially increasing this proportion, especially before renal complications appear, could lead to a reduction in the excess risk of mortality in this patient group.
Moreover, it is possible that more aggressive smoking cessation programs could further reduce the excess risk of mortality to levels comparable to the general population. Since persons with type 1 diabetes generally have frequent contact with care providers, special smoking cessation programs, in line with those generally existing for persons with cardiovascular disease, should be considered.
Earlier studies are sparse of excess mortality in persons with type 1 diabetes who target goals for HbA1c, are free of renal complications and avoid smoking. This is also the case regarding evaluations of patient characteristics for patients dying due to acute complications. One reason is likely that very large patient cohorts are needed over long time periods including information of risk factors on an individual level and such patient cohorts are generally sparse. In the current cohort of 33 915 persons with type 1 diabetes there were 81 deaths due to ketoacidosis or hypoglycemia in patients less than 50 years of age. In a patient cohort being considerably smaller it would be difficult to evaluate patient characteristics. Regarding excess mortality in relation to risk factor control, the confidence intervals were relatively wide in spite of the large patient cohort, also illustrating the need of a large patient cohort. However, it should be noted that there are other cohort studies showing that acute complications are major causes of deaths in younger persons with type 1 diabetes, although not generally evaluating predictors of these deaths.13-16
A limitation of the Swedish Cause of Death Register using International Classification of Disease (ICD) codes is that it is generally not possible to determine whether deaths have occurred due to hypoglycemia or ketoacidosis (ICD-10 codes E10.0, E11.0, E14.0, E10.1, E11.1, E14.1). This has also been the case in earlier registry studies of deaths due to acute complications.5,16 However, the characteristics associated with these deaths, although it must be interpreted with great caution, indicate that ketoacidosis is likely a more common cause than hypoglycemia. The patients had generally higher HbA1c than average in persons with type 1 diabetes and renal complications were more common, also indicating a history of pronounced hyperglycemia in these patients. Noteworthy, there were no differences found regarding deaths due to acute complications in younger adults for persons treated with insulin pump compared to multiple daily insulin injections.
Conclusion
In conclusion, our findings suggest that the rates of mortality in persons with type 1 diabetes may converge with those of the general population by reaching HbA1c targets, and avoiding renal complications and smoking. Clinicians should also pay attention to certain patient groups, particularly young adults with type 1 diabetes, who are at risk of death due to hypoglycemia and ketoacidosis as elucidated here.
Supplementary Material
Acknowledgments
We thank all clinicians involved in the care of the patients with type 1 diabetes for data collection, the staff at the National Diabetes Registry, and Joseph W. Murphy for editorial assistance.
Footnotes
Abbreviations: AF, atrial fibrillation; AMI, acute myocardial infarction; BMI, body mass index; BP, blood pressure; CHD, coronary heart disease; CI, confidence interval; CKD, chronic kidney disease; CVD, cardiovascular disease; eGFR, estimated glomerular filtration rate; HbA1c, hemoglobin A1c; HF, heart failure; HR, hazard ratio; ICD, International Classification of Disease; IFCC, International Federation of Clinical Chemistry; LDL, low-density lipoprotein; MDI, multiple daily injections; NDR, National Diabetes Registry; NGSP, National Glycohemoglobin Standardization Program; T1D, type 1 diabetes.
Declaration of Conflicting Interests: The author(s) declared the following potential conflicts of interest with respect to the research, authorship, and/or publication of this article: ML reports receiving honoraria or having been a consultant for AstraZeneca, Eli Lilly, Medtronic, Novo Nordisk, and Pfizer and grant support from Abbott, AstraZeneca, Dexcom, Novo Nordisk, and Pfizer. All other authors declare no conflicts of interest.
Funding: The author(s) disclosed receipt of the following financial support for the research, authorship, and/or publication of this article: This study was supported by grants from the Swedish Government (under the Avtal om Läkarutbildning och medicinsk Forskning [Agreement for Medical Education and Research]) and the Novo Nordisk Foundation.
Supplemental Material: The supplementary material is available at http://dst.sagepub.com/supplemental
References
- 1. American Diabetes Association. Standards of medical care in diabetes—2014. Diabetes Care. 2014;37(suppl 1):S14-S80. [DOI] [PubMed] [Google Scholar]
- 2. Type 1 diabetes: diagnosis and management of type 1 diabetes in children, young people and adults. Available at: http://egap.evidence.nhs.uk/type-1-diabetes-cg15/guidance#blood-glucose-control-and-insulin-therapy. Accessed January 8, 2014.
- 3. Canadian Diabetes Association Clinical Practice Guidelines Expert Committee. Canadian Diabetes Association 2013 Clinical Practice Guidelines for the Prevention and Management of Diabetes in Canada. Can J Diabetes. 2013;37(suppl 1):S1-S212. [DOI] [PubMed] [Google Scholar]
- 4. Livingstone SJ, Levin D, Wild SH, et al. Estimated life expectancy in a Scottish cohort with type 1 diabetes, 2008-2010. JAMA. 2015;313(1):37-44. [DOI] [PMC free article] [PubMed] [Google Scholar]
- 5. Lind M, Svensson AM, Kosiborod M, et al. Glycemic control and excess mortality in type 1 diabetes. N Engl J Med. 2014;371(21):1972-1982. [DOI] [PubMed] [Google Scholar]
- 6. Eeg-Olofsson K, Cederholm J, Nilsson PM, et al. Glycemic control and cardiovascular disease in 7,454 patients with type 1 diabetes: an observational study from the Swedish National Diabetes Register (NDR). Diabetes Care. 2010;33(7):1640-1646. [DOI] [PMC free article] [PubMed] [Google Scholar]
- 7. Olén O, Bihagen E, Rasmussen F, Ludvigsson JF. Socioeconomic position and education in patients with coeliac disease. Dig Liver Dis. 2012;44(6):471-476. [DOI] [PubMed] [Google Scholar]
- 8. Emilsson L, Smith JG, West J, Melander O, Ludvigsson JF. Increased risk of atrial fibrillation in patients with coeliac disease: a nationwide cohort study. Eur Heart J. 2011;32(19):2430-2437. [DOI] [PubMed] [Google Scholar]
- 9. Lind M, Odén A, Fahlén M, Eliasson B. A systematic review of HbA1c variables used in the study of diabetic complications. Diabetes Metab Syndrome. 2008;2:282-293. [Google Scholar]
- 10. Jeppsson JO, Kobold U, Barr J, et al. Approved IFCC reference method for the measurement of HbA1c in human blood. Clin Chem Lab Med. 2002;40(1):78-89. [DOI] [PubMed] [Google Scholar]
- 11. Levey AS, Bosch JP, Lewis JB, Greene T, Rogers N, Roth D. A more accurate method to estimate glomerular filtration rate from serum creatinine: a new prediction equation. Ann Intern Med. 1999;130:461-470. [DOI] [PubMed] [Google Scholar]
- 12. Parving HH, Mauer M, Ritz E. Diabetic nephropathy. In: Brenner BM, ed. Brenner and Rector’s the Kidney. 7th ed. Philadelphia, PA: WB Saunders; 2004:1777-1818. [Google Scholar]
- 13. Laing SP, Swerdlow AJ, Slater SD, et al. The British Diabetic Association Cohort Study, I: all-cause mortality in patients with insulin-treated diabetes mellitus. Diabet Med. 1999;16(6):459-465. [DOI] [PubMed] [Google Scholar]
- 14. Skrivarhaug T, Bangstad HJ, Stene LC, Sandvik L, Hanssen KF, Joner G. Long-term mortality in a nationwide cohort of childhood-onset type 1 diabetic patients in Norway. Diabetologia. 2006;49(2):298-305. [DOI] [PubMed] [Google Scholar]
- 15. Secrest AM, Becker DJ, Kelsey SF, Laporte RE, Orchard TJ. Cause-specific mortality trends in a large population-based cohort with long-standing childhood-onset type 1 diabetes. Diabetes. 2010;59(12):3216-3222. [DOI] [PMC free article] [PubMed] [Google Scholar]
- 16. Livingstone SJ, Looker HC, Hothersall EJ, et al. Risk of cardiovascular disease and total mortality in adults with type 1 diabetes: Scottish registry linkage study. PLOS Med. 2012;9(10):e1001321. [DOI] [PMC free article] [PubMed] [Google Scholar]
Associated Data
This section collects any data citations, data availability statements, or supplementary materials included in this article.