

Abstract
Background and Purpose
Sinus lift (SL) using cultured autogenous periosteal cells (CAPCs) combined with autogenous bone and platelet‐rich plasma (PRP) was performed to evaluate the effect of cell administration on bone regeneration, by using high‐resolution three‐dimensional computed tomography (CT).
Materials and Methods
SL with autogenous bone and PRP plus CAPC [CAPC(+)SL] was performed in 23 patients. A piece of periosteum taken from the mandible was cultured in M199 medium with 10% fetal bovine serum (FBS) for 6 weeks. As control, 16 patients received SL with autogenous bone and PRP [CAPC(−)SL]. Three‐dimensional CT imaging was performed before and 4 months and 1 year after SL, and stratification was performed based on CT numbers (HUs) corresponding to soft tissue and cancellous or cortical bone.
Results
The augmented bone in CAPC(+)SL revealed an increase in HUs corresponding to cancellous bone as well as a decrease in HUs corresponding to grafted cortical bone. In addition, HUs corresponding to cancellous bone in the graft bed were increased in CAPC(+)SL but were decreased in CAPC(−)SL. Insertion torque during implant placement was significantly higher in CAPC(+)SL.
Conclusion
By promoting bone anabolic activity both in augmented bone and graft bed, CAPCs are expected to aid primary fixation and osseointegration of implants in clinical applications.
Keywords: cultured autogenous periosteal cell, sinus lift bone augmentation, three‐dimensional computed tomography
Introduction
The application of regenerative medicine is expected to expand the clinical indications of dental implant treatment and achieve a high level of functional and aesthetic recovery. Conventionally, artificial bone grafts made mostly of calcium phosphate or autogenous bone grafts are used in alveolar bone regeneration. In recent years, however, the clinical applications of various stem cells have been investigated in cell‐based alveolar bone regeneration.1
The periosteum is a cellular membrane that forms the bony environment of bone tissue, and it mediates the development, growth, and maintenance of mechanical strength of bone as well as fracture healing. It is therefore a useful cell source for bone tissue engineering.2 Periosteal cells can be obtained from a shallow biopsy of the oral mucosa or cranium, regardless of age, whereas cells from dental pulp or umbilical cord can be obtained once only. It has been suggested that periosteal cells have higher osteoinductivity than bone marrow mesenchymal stromal cells.3 Furthermore, various allogeneic or autogenous stem cells require genetic manipulation, cell selection, subculture, and differentiation induction, whereas cultured periosteal cells do not require any of these procedures. The cultivation process is advantageous in terms of ethics and is simple and safe. As the periosteum contains cells that have osteogenic potential, as well as peripheral stem cells that are capable of differentiation into various types of cells, it could be an appropriate source of cells for bone tissue engineering.4, 5, 6
In 2007, a clinical study of cultured autogenous periosteal cells (CAPCs) in alveolar bone regeneration was started,7 and the procedure has been performed in 70 patients to date. This study used CAPCs with the most promising scaffold of particulated autogenous bone and platelet‐rich plasma (PRP) for the purposes of coagulation and facilitating angiogenesis in the graft. As the use of the calcium phosphate‐based bone substitute often results in malassimilation of the graft, the osteoinductive property of CAPCs is unclear when synthetic bone substitute is used. Thus, the present clinical study was designed to verify the positive effect of CAPCs on bone regeneration by administering CAPCs with particulated autogenous bone and PRP in sinus lift (SL) maxillary augmentation.
Based on histological findings and successive high‐resolution three‐dimensional computed tomographic (CT) images in a preliminary study, it was proposed that CAPCs promote high‐quality bone regeneration through the coordinated activation of bone formation and resorption.7 Up to that point, other studies had investigated cell‐based bone regeneration using plane radiographic images of the site of bone regeneration or determined the volume using CT images,8, 9, 10, 11, 12, 13 with no qualitative characterization of the role of cells in bone regeneration or time‐dependent changes in bone metabolism. To verify the clinical hypothesis that the bone anabolic effect of CAPCs is exerted through activation of bone remodeling in the graft, high‐resolution three‐dimensional CT analysis of the SL augmentation area at three time points was conducted with an increased number of patients. Insertion torque measurements were also performed at the time of dental implant placement to assess the actual clinical benefit of CAPCs.
Materials and Methods
Patients
Between April 2007 to July 2013 at 31 sites, 23 patients with advanced atrophy of the maxillary alveolar ridge and sinus floor participated in this clinical study of alveolar bone engineering using a graft consisting of autogenous cortical bone particles and PRP plus CAPC [CAPC(+)SL] as pretreatment for implant placement (Table 1). Patients did not have major organ failure, metabolic disorder, or infectious disease, and all provided written informed consent. The reference group comprised patients who did not consent to the use of CAPCs or those who could not be given CAPCs because of time constraints or failed CAPC culture, and they were treated with SL augmentation using a graft consisting of autogenous cortical bone particles and PRP [CAPC(−)SL]. Some of the subjects in this study have been reported in our previous study.7
Table 1.
Cases and Procedure
| Sinus lift with cultured autogenous periosteal cells | ||||||||||
|---|---|---|---|---|---|---|---|---|---|---|
| Case | Age | Sex | Method | Total graft (g) | Bone particle (%) | PRP glue (%) | Cultured autogenous periosteal cells (%) | Implant position | Initial bone height of sinus floor at the minimum position (mm) | Insertion torque (Ncm) at the lowest position |
| 1 | 52 | Female | R‐SLa | 5.6 | 36 | 41 | 23 | #16–17 | 2.9 | 35 |
| 2 | 52 | Female | R‐SL | 4.0 | 24 | 49 | 28 | #16–17 | 6.5 | 45 |
| 3 | 56 | Female | L‐SLb | 3.8 | 74 | 13 | 13 | #26 | 2.2 | 35 |
| 4 | 62 | Female | L‐SL | 5.5 | 55 | 28 | 17 | #26–27 | 0.8 | 35 |
| 5 | 59 | Female | R‐SL | 3.0 | 80 | 9 | 11 | #16–17 | 1.2 | 20 |
| 6 | 67 | Male | L‐SL | 4.5 | 45 | 32 | 16 | #26 | 5.6 | 35 |
| 7 | 55 | Female | Bi‐SLc | 8.5 | 48 | 37 | 15 | #16–17, 26–27 | Right: 2.2; Left: 1.3 | Right: 35; Left: 15 |
| 8 | 60 | Female | Bi‐SL | 9.0 | 50 | 42 | 8 | #16–17, 26–27 | Right:0.7; Left:0.6 | Right:20; Left:15 |
| 9 | 54 | Male | Bi‐SL | 11.7 | 56 | 38 | 6 | #15, 26 | Right: 3.4; Left: 2.9 | Right: 40; Left: 40 |
| 10 | 45 | Male | R‐SL | 6.0 | 58 | 25 | 17 | #16 | 2.7 | 35 |
| 11 | 70 | Male | Bi‐SL | 8.2 | 71 | 18 | 10 | #16, 26 | Right: 0.8; Left: 0.6 | Right: 45; Left: 45 |
| 12 | 66 | Female | Bi‐SL | 6.2 | 64 | 32 | 4 | #16–17, 26–27 | Right: 1.9; Left: 2.5 | Right: 15; Left: 35 |
| 13 | 68 | Male | R‐SL | 5.0 | 79 | 11 | 10 | #16–17 | 1.6 | 20 |
| 14 | 59 | Male | R‐SL | 3.7 | 54 | 40 | 6 | #16–17 | 3.9 | 35 |
| 15 | 53 | Female | R‐SL | 7.6 | 47 | 42 | 11 | #15–16 | 0.9 | 15 |
| 16 | 61 | Female | Bi‐SL | 9.0 | 46 | 46 | 9 | #15–16, 26 | Right: 0.9; Left: 2.7 | Right: 50; Left: 35 |
| 17 | 65 | Male | R‐SL | 3.4 | 44 | 51 | 5 | #16 | 5.8 | 35 |
| 18 | 59 | Female | Bi‐SL | 10 | 42 | 50 | 8 | #16, 26 | Right: 2.9; Left: 4.3 | 35 |
| 19 | 40 | Male | R‐SL | 4.0 | 34 | 46 | 20 | #16–17 | 2.1 | 25 |
| 20 | 63 | Male | R‐SL | 2.9 | 56 | 24 | 20 | #16 | 8 | 35 |
| 21 | 49 | Female | Bi‐SL | 6.6 | 65 | 9 | 26 | #16, 26 | Right: 1.7; Left: 3.2 | Right: 35; Left: 35 |
| 22 | 62 | Male | R‐SL | 7.7 | 39 | 51 | 10 | #16–17 | 3.8 | 35 |
| 23 | 43 | Female | L‐SL | 5.8 | 33 | 57 | 10 | #25–27 | 1.1 | 35 |
| Sinus lift without cultured autogenous periosteal cells | ||||||||||
|---|---|---|---|---|---|---|---|---|---|---|
| Case | Age | Sex | Method | Total graft (g) | Bone particle (%) | PRP glue (%) | Cultured autogenous periosteal cells (%) | Implant position | Sinus floor thickness (mm) at thinnest position | Insertion torque value (Ncm) at the lowest position |
| 1 | 35 | Female | R‐SL(S)d | 2.2 | 67 | 33 | — | #16 | 8 | 35 |
| 2 | 50 | Female | R‐SL | 4.8 | 83 | 17 | — | #16–17 | 4.7 | 35 |
| 3 | 64 | Male | R‐SL | 3.0 | 65 | 35 | — | #16–17 | 4.8 | 35 |
| 4 | 74 | Male | L‐SL(S) | 4.9 | 61 | 39 | — | #26 | 7.5 | 35 |
| 5 | 59 | Male | L‐SL(S) | 1.8 | 56 | 44 | — | #26 | 8 | 15 |
| 6 | 70 | Male | Bi‐SL | 4.7 | 56 | 44 | — | #16,25–26 | Right: 3.0; Left: 2.5 | Right: 15; Left: 35 |
| 7 | 65 | Male | L‐SL | 3.0 | 57 | 43 | — | #16 | 5.5 | 35 |
| 8 | 69 | Female | R‐SL(S) | 3.5 | 54 | 46 | — | #16–17 | 5.5 | 30 |
| 9 | 49 | Female | R‐SL | 6.4 | 49 | 51 | — | #15–16 | 4.5 | 35 |
| 10 | 75 | Male | R‐SL | 0.9 | 50 | 50 | — | #16 | 1.5 | 15 |
| 11 | 41 | Male | L‐SL | 2.6 | 62 | 38 | — | #15–16 | 5.5 | 15 |
| 12 | 60 | Male | R‐SL | 4.9 | 53 | 47 | — | #16–17 | 1.2 | 5 |
| 13 | 74 | Female | R‐SL(S) | 3.0 | 50 | 50 | — | #16 | 6.2 | 35 |
| 14 | 62 | Female | R‐SL(S) | 3.8 | 47 | 53 | — | #16–17 | 5.9 | 15 |
| 15 | 68 | Female | R‐SL | 3.5 | 43 | 57 | — | #16–17 | 2.2 | 15 |
| 16 | 54 | Female | L‐SL | 2.2 | 60 | 40 | — | #26 | 7.1 | 20 |
R‐SL: right sinus lift.
L‐SL: left sinus lift.
B‐SL: bilateral sinus lift.
(S): simultaneous implant placement.
The study protocol was approved by the Institutional Review Board of the Niigata University Medical and Dental Hospital and followed the Guidelines on Clinical Research Using Human Stem Cells of the Japanese Ministry of Health, Labour and Welfare. The study was conducted in accordance with the World Medical Association's Declaration of Helsinki (2008 version).
Cultivation of periosteum and grafting procedure
CAPCs were grafted in the operating room of Niigata University Medical and Dental Hospital after preparation in the bioclean room of the Cell Processing Center, as described in the previous work.7 Briefly, periosteum was harvested from the molar region of the mandible and placed into culture dishes with Medium 199 (Invitrogen, Carlsbad, CA, USA) containing 10% fetal bovine serum (sourced in New Zealand, SAFC Bioscience, Inc., Tokyo, Japan), 25 mg ascorbic acid (Sigma Chemical, St. Louis, MO, USA), and antibiotics. After 6 weeks of cultivation to allow outgrowth of CAPCs, fragmented CAPC sheets were mixed with autogenous cortical bone particles from the mandibular ramus and PRP, and then graft materials coagulated by CaCl2 solution were grafted onto the floor of the maxillary sinus following the standard procedure of maxillary SL bone grafting [CAPC(+)SL]. Detailed characterization of the CAPC has been described in previous studies.4, 5, 6 The graft material for the reference group was prepared using the same procedure without CAPCs [CAPC(−)SL] (Figure 1).
Figure 1.
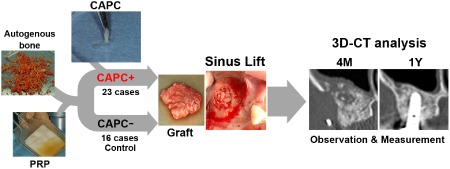
Use of cultured autogenous periosteal cells in sinus lift bone augmentation.
Grafts were prepared by mixing cultured autogenous periosteal cells (CAPCs), platelet‐rich plasma (PRP), and autogenous cortical bone particles from the mandible. Control grafts were prepared by mixing PRP and mandibular autogenous cortical bone particles. The grafts were used in sinus lift bone augmentation, and augmented bones and the surrounding tissue were analyzed in three‐dimensional computed tomography (three‐dimensional CT) at different time points.
3D‐CT = three‐dimensional computed tomography; CAPC = cultured autogenous periosteal cell; PRP = platelet‐rich plasma.
Three‐dimensional analysis of augmented bone
High‐resolution three‐dimensional CT was performed to investigate chronological changes in the preexisting bone in the posterior maxillary alveolar process and in the bone regenerated in the maxillary sinus floor of 23 SL patients (31 maxillary sinuses) treated with CAPC and 16 control SL patients (17 maxillary sinuses) without CAPC (Table 1). As in the previous study,7 CT scans of the maxillary sinus region were conducted at three time points: before treatment and at 4 months (4M) and 1 year (1Y) after SL. Scans were acquired by a 64‐multidetector CT scanner (Aquilion, Toshiba, Tokyo, Japan) using the following protocol: 0.5 mm slice thickness, 0.3 mm slice interval, and 21 helical pitch. High‐resolution three‐dimensional CT images of the maxilla were constructed from DICOM data. With the use of Real INTAGE (Cybernet Systems, Tokyo, Japan), voxel images covering the alveolar ridge and sinus of the maxilla were constructed using three‐dimensional coordinates based on four anatomical landmarks: the anterior nasal spine, posterior nasal spine, and bilateral lowest ends of the pterygoid process of the sphenoid. In each case, images were adjusted and unified by superimposing the three‐dimensional coordinates.
Color mapping was applied to determine bone quality based on bone density using Hounsfield units (HU): voxels >50 HU were identified as bone with D1, > 1,250 HU; D2, 850 to 1,250 HU; D3, 350 to 850 HU; D4, 150 to 350 HU; and D5, 50 to 150 HU.14 DICOM data were transformed into isotropic voxel size, and augmented bone volume was calculated from the number of voxels in the extracted images with HU >50 as the total volume or 50 to 350 HU, 350 to 850 HU, and >850 HU as the volumetric categories. The ratios of augmented bone volumes at 4 months to 1 year after grafting were determined to examine volume changes.7, 15
Measurement of insertion torque during implant placement
Implant placement was performed 5 to 7 months after SL. A torque wrench was used to measure insertion torque (Ncm) at 30 sites in the CAPC(+) SL group and at eight sites in the CAPC(−) SL group, where the thickness between the alveolar crest and maxillary sinus floor was ≤3 mm before bone augmentation. Implants used in this study were Nobel Active (Nobel Biocare, Zurich, Switzerland) and Straumann Standard Plus (Straumann, Basel, Switzerland) implants.
Statistical analysis
Significance differences between the groups were analyzed using the Student's t‐test. p values <0.05 were considered significant (SPSS 21.0, IBM Japan, Tokyo, Japan).
Results
Implant placement was successfully completed in all patients. During the mean observation period of 3.9 years (range, 1.5–6.5 years), no adverse events such as tumor formation, abnormal bone resorption, or implant failure were observed. The initial bone height of the maxillary sinus floor was 2.97 mm (0.6–8.0 mm) in the CAPC(+)SL group because many patients had advanced atrophy of the alveolar process due to tooth loss. This was primarily the reason why these patients were strongly encouraged to participate in this clinical study of CAPCs as they represented challenging cases of bone generation. In the CAPC(−)SL group, the mean bone height was initially 4.46 mm (1.2–8.0 mm) due to the relatively mild atrophy of the alveolar ridge. Therefore, the control group was expected to have an advantage over the experimental group with regard to bone augmentation, and they may be regarded as being equivalent to a “super control” (Table 1).
In both groups, regression of augmented bone was observed on three‐dimensional CT images acquired 1 year after SL compared with the images acquired 4 months after SL. In the CAPC(−)SL group, the three‐dimensional CT images of augmented bones taken at 4 months and 1 year after SL showed areas displayed in blue that correspond to the range of bone density for cortical bone (D1–2 of Misch's [2008] classification).14 Because the D1–2 area does not exist in normal maxillary cancellous bone, these areas were thought to represent grafted autogenous mandibular cortical bone particles that remained for a long period without resorption (Figure 2, arrowheads). When entire augmented bones were analyzed to compare the volumes between 25 maxillary sinuses in the CAPC(+)SL group and 15 maxillary sinuses in the CAPC(−)SL group (Figure 3), no difference between the groups was observed in the volumes at 1 year after SL relative to those at 4 months after SL [73.3% vs. 73.2%, respectively] (Figure 3A). However, stratification based on CT numbers corresponding to soft tissue and cancellous and cortical bone revealed a 27% increase in cancellous bone (350–850 HU, corresponding to D3 of Misch's classification (Figure 3B, middle) [127.2% vs. 100.7%, CAPC(+) and CAPC(−), respectively] and a 40% decrease in cortical bone (≥850 HU, corresponding to D1–2; Figure 3B, right) in the CAPC(+)SL group [58.8% vs. 98.7%, CAPC(+) and CAPC(−), respectively].14 This suggests that CAPCs promote the resorption of the autogenous cortical bone particles of the mandible at the same time as bone formation in augmented bones.
Figure 2.
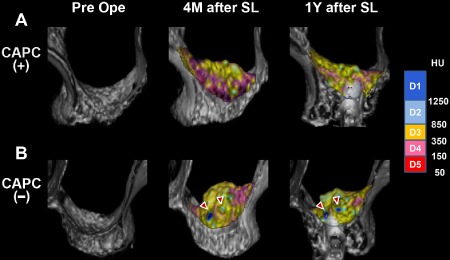
High‐resolution three‐dimensional CT imaging of augmented bones in the maxillary sinus floor.
Sinus lift bone augmentation (SL) with CAPCs (CAPC[+], A) and without CAPCs (CAPC[−], B). Representative three‐dimensional CT images taken before (Pre Ope) and 4 months (4M after SL) and 1 year (1Y after SL) after SL are shown for both groups. The density of the augmented bone is color‐coded based on CT numbers in Hounsfield unit (HU) in accordance with Misch's (2008) classification: D1–2 represent cortical bone, D3 represents cancellous bone, and D4–5 represent soft tissue.9 In B (CAPC[−]), the areas of D1 representing cortical bone are observed in three‐dimensional CT images taken at 4 months and 1 year after SL (arrowheads).
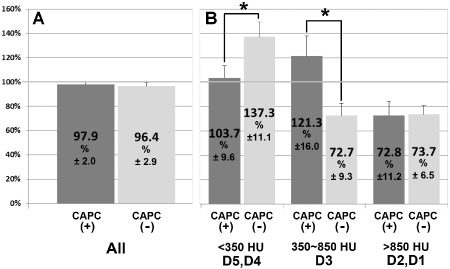
Figure 3.
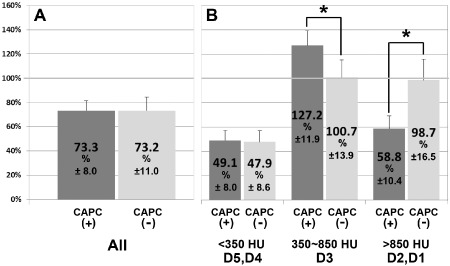
High‐resolution three‐dimensional CT analysis of augmented bones in the maxillary sinus floor.
The volume (average % ± SD) of augmented bone at 1 year after SL (1Y after SL) relative to those at 4 months after SL (4M after SL) were compared between the CAPC(+) (n = 25) and CAPC(−) (n = 15) groups. The comparison was performed (A) using entire augmented bones or (B) after stratification by CT number (HU) in accordance with Misch's classification9: D1–2 represent cortical bone, D3 represents cancellous bone, and D4–5 represent soft tissue. (A) The volume of the entire augmented bones at 1 year after SL showed no difference in both groups. (B) Stratification based on CT numbers revealed an increase in D3 representing cancellous bone, and a decrease in D1–2 representing cortical bone in the CAPC(+) group. *p < .05; Bar: standard deviation (SD).
SL causes changes in the metabolic processes in the maxillary sinus floor that serves as the graft bed and in the maxillary alveolar ridge. Although no change in the exterior of the maxillary alveolar ridge was observed at 4 months after SL, the three‐dimensional CT images indicate bone resorption and an increase in soft tissue and cancellous bone in the sinus floor adjacent to the graft (Figure 4). Bone resorption appears to have been promoted in the maxillary bone in the CAPC(−) SL group (Figure 4B, asterisk), and a decrease in cancellous bone (D3) and an increase in soft tissue (D4–5) were observed even in the alveolar bone. Changes due to SL in the volumes of maxillary sinus floor and alveolar ridge were compared between 15 CAPC(+) maxillary sinuses and seven CAPC(−) maxillary sinuses (Figure 5). When the entire maxillary alveolar ridge was analyzed, no changes in the volume were observed at 4 months after SL in either group (Figure 5A). However, in agreement with the macroscopic findings, stratification based on CT numbers for soft tissue and cancellous and cortical bone revealed an almost 40% increase in soft tissue (<350 HU corresponding to D4–5 in Misch's classification) but almost a 30% decrease in cancellous bone (350–850 HU corresponding to D3) in the CAPC(−) SL group (Figure 5B).14 In the CAPC(+) SL group, although no change was observed in soft tissue (D4–5), a 20% increase in cancellous bone (D3) was observed at 4 months after SL. There was an almost 30% decrease in cortical bone (D1–2) in both groups. These results indicate the progression of cortical bone remodeling and trabecular bone formation in the CAPC(+) SL group and progression of osteolysis of cortical and trabecular bone in the CAPC(−) SL group.
Figure 4.
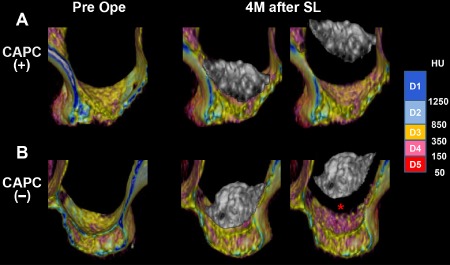
High‐resolution three‐dimensional CT imaging of maxillary sinus floor and alveolar ridge.
The maxillary sinus floor and alveolar ridge in CAPC(+) (A) and CAPC(−) (B) patients were stratified based on the CT numbers (HU) in accordance with Misch's (2008) classification: D1–2 represent cortical bone, D3 represents cancellous bone, and D4–5 represent soft tissue.9 Images were taken before SL (Pre ope) and at 4 months after SL (4M after SL). (B) In the CAPC(−) group, a significant increase in the CT numbers corresponding to soft tissue was observed in the maxillary sinus floor (asterisk) in contact with augmented bone at 4 months after SL.
Figure 5.
High‐resolution three‐dimensional CT analysis of maxillary sinus floor and alveolar ridge.
The volume (average % ± SD) of maxillary sinus floor and alveolar ridge at 4 months after SL (4M after SL) relative to those before SL (Pre ope) were compared between the CAPC(+) (n = 15) and CAPC(−) (n = 7) groups. The comparison was performed (A) using entire augmented bones or (B) after stratification by CT number (HU) in accordance with Misch's classification9: D1–2 represent cortical bone, D3 represents cancellous bone, and D4–5 represent soft tissue. (A) No difference in the volumes of entire augmented bones was observed between the CAPC(+) and CAPC(−) groups at 4 months after SL. (B) Stratification by CT number reveals an increase in D4–5 representing soft tissue and in D3 representing cancellous bone in the CAPC(−) group and an increase in D3 representing cancellous bone in the CAPC(+) group. *p < .05; Bar: standard deviation.
Insertion torque values obtained during implant placement reflected the state of bone formation in the augmented bone. A comparison between the insertion torque values of CAPC(+) SL and CAPC(−) SL groups measured at the sites where the initial bone height of the maxillary sinus floor was ≤3 mm revealed that insertion torque was significantly higher in the CAPC(+) SL group (Figure 6). These clinical findings reflect the findings of rapid formation of new bone observed on high‐resolution three‐dimensional CT resulting from the addition of CAPCs.
Figure 6.
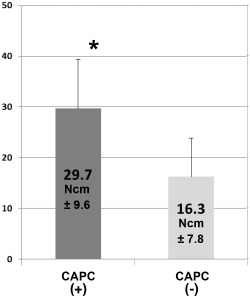
Comparison of insertion torque.
During implant placement following SL, insertion torque was measured at the sites where preoperative initial bone height of the maxillary sinus floor was ≤3 mm, and data were compared between the CAPC(+) (n = 30) and CAPC(−) (n = 8) groups. Insertion torque was significantly high in the CAPC(+) group. *p < .05; Bar: standard deviation.
Discussion
Based on the findings of our preliminary study, we proposed that CAPCs promote bone regeneration through the activation of bone formation and resorption in a coordinated manner.7 In the present study, we aimed to verify this hypothesis by increasing the number of patients and using high‐resolution three‐dimensional CT for analysis. Due to the dual source scanning capabilities, dual energy CT used in this study enables accurate imaging of the morphology of the bone surrounding dental implants, which is difficult to perform using conventional CT. Qualitative analysis of bone by CT number is conventionally thought to be difficult; however, with the use of chronological changes in CT numbers and accurate superimposition of three‐dimensional images, it is possible to qualitatively analyze bone formation and resorption at the site of bone augmentation to reveal the metabolic activity of bone regeneration.7, 15 This feature differentiates the current study from previous studies on bone regeneration treatment.
The results of the prior study suggested that CAPCs promote bone formation and resorption in a coordinated manner.7 Thus, it was hypothesized that the bone anabolic effect of CAPCs is due to the activation of both osteoblastic bone formation and osteoclastic bone resorption pathway. In agreement with this, the results of the current study showed an increase in CT numbers corresponding to cancellous bone and decrease in CT numbers corresponding to cortical bone at the site of bone augmentation 1 year after SL in patients treated with CAPC(+)SL. This demonstrated that, together with the histological findings in the prior study that exhibited increased number of alkaline phosphatase‐immunopositive cells and tartrate‐resistant acid phosphatase activity‐positive cells in augmented bone of CAPC(+) grafts,7 CAPCs induce bone augmentation through the coordinated activation of the bone formation and resorption pathways (Figure 7).
Figure 7.
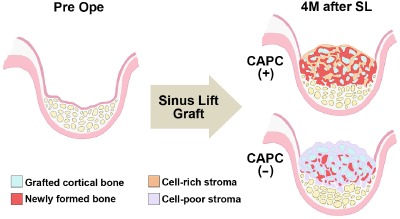
Illustration based on the three‐dimensional CT analysis results of changes in the augmented bone and the graft bed of maxillary sinus floor.
In the CAPC(+) group, both bone formation and resorption are activated, causing new bone formation as well as remodeling of the cortical bone particles in the augmented bone. In contrast, the induction of cells is sparse in the CAPC(−) group, showing that either bone formation or resorption is not fully activated in the augmented bone. Furthermore, in the maxillary sinus floor and maxillary alveolar bone, destruction of trabecular bones advances. 4M after SL = 4 months after SL; CAPC(+) = SL with cultured autogenous periosteal cells; CAPC(−) = SL without cultured autogenous periosteal cells; Pre ope = before SL.
We also conducted high‐resolution three‐dimensional CT imaging of the graft bed, maxillary sinus floor, and posterior maxillary alveolar ridge to reveal changes induced by SL. With no nutrient vessels running inside, the maxilla is supplied by the blood vessels running below the periosteum or mucosa of the maxillary sinus. Therefore, it is possible that the procedure of SL triggers a critical situation in the maxilla. As the three‐dimensional images show, the transition to soft tissue in the maxillary sinus floor was significant in the CAPC(−)SL group (Figure 4), and this tendency toward bone destruction was also consistently observed in the comparisons of CT numbers after stratification (Figure 5). On the other hand, not only was bone destruction inhibited in the maxillary sinus floor of the CAPC(+)SL group, the level of cancellous bone was also increased. These findings indicate that CAPCs also benefit post‐SL maintenance of the maxillary sinus floor and alveolar ridge.
Implant insertion torque clinically reflects the density and thickness of trabecular network and supportive bone height at the implant placement site. Thus, the proposal that CAPCs promote ossification of the graft as well as maintenance of the graft bed in an integrated fashion (Figure 7) was thought to be supported by the finding of improved insertion torque at the time of implant placement (Figure 6). The beneficial effect of cell administration on insertion torque at implant placement has also been shown in a study of SL with mesenchymal stem cells in experimental animals.16 Good primary fixation is an important factor in the osseointegration of implants,17 and the waiting time after the bone graft for implant placement is generally dependent on the bone integrity of the augmented site. Although the optimal timing of implant placement is traditionally considered to be 4 to 8 months after SL with an autogenous bone graft,18 implant placement in the present study was performed provisionally 5 to 7 months after maxillary augmentation in SL. Due to the promotion of bone assimilation by CAPCs, it is possible to shorten the waiting period after bone augmentation. Early placement and early loading of dental implants are also beneficial for the morphological maintenance of regenerated bones.19 Although this study employed autogenous bone as graft material that provided the most stable result, morbidity caused by bone harvesting is a serious burden for patients. Combined use of CAPCs with a fully synthetic bone substitute that exerts osteoinductive activity would be required to reduce treatment duration and morbidity, as well as a good treatment outcome in the future.20
The biological mechanism of the osteogenesis‐promoting effect of CAPCs was not fully investigated. The osteogenic property of CAPCs is characterized by expression of bone tissue‐related molecules such as BMP2, RUNX2, RANKL, and VEGF, and CAPCs also exhibit the properties of peripheral stem cells.4, 6 Therefore, it is possible that CAPCs promote bone formation by mobilizing both osteoblastic and osteoclastic cells as well as facilitating angiogenesis at the graft site. Bone biopsy of the augmented bone that had received CAPC‐combined graft revealed abundant growth of CAPC‐like cells.7 It is necessary to conduct a detailed study to determine whether grafted CAPCs induce bone tissue formation by releasing bone‐related cytokines or whether CAPCs directly grow and differentiate into various type of cells in the grafted site.
Conclusion
A clinical study of cell‐based bone regeneration should be conducted only after careful consideration of its potential and practical applications because of the costs of environmental and quality management as well as technological obstacles. However, studies investigating the efficacy of cell‐based bone regeneration therapy and research of its practical use should be continued as future technological innovations in cell therapy and improvement of social infrastructure are achieved. Because of the multidimensional efficacy in bone healing, further studies are needed to investigate the significance of bone regeneration therapy in the regeneration of alveolar bone with severe atrophy in implant therapy.7, 8, 21 In addition, its use as a novel treatment for refractory bone‐related diseases such as excessive jaw bone loss due to tumor or injury,22 and for osteonecrosis and abnormal bone metabolism – for example, osteonecrosis and radiation osteomyelitis associated with drugs regulating bone metabolism – should be investigated.
Conflict of Interest and Source of Funding Statement
We declare that there is no actual or potential conflict of interest including any financial, personal, or other relationships with other people or organizations within 3 years of beginning the submitted work that could inappropriately bias this work.
This study was funded by the Japan Society for the Promotion of Science (Project Nos. 23592985 and 26462967).
Acknowledgments
The authors would like to thank the staff of the Cell Processing Center of Niigata University Medical and Dental Hospital for their support in cultivating periosteal samples.
The copyright line in this article was changed on 12 June 2015 after online publication.
Conflict of interest statement
There are no conflicts of interests to declare.
References
- 1. Egusa H, Sonoyama W, Nishimura M, Atsuta I, Akiyama K. Stem cells in dentistry – part II: clinical applications. J Prosthodont Res 2012; 56:229–248. [DOI] [PubMed] [Google Scholar]
- 2. Roberts SJ, van Gastel N, Carmeliet G, Luyten FP. Uncovering the periosteum for skeletal regeneration: the stem cell that lies beneath. Bone 2015; 70:10–18. [DOI] [PubMed] [Google Scholar]
- 3. Zhu SJ, Choi BH, Huh JY, Jung JH, Kim BY, Lee SH. A comparative qualitative histological analysis of tissue‐engineered bone using bone marrow mesenchymal stem cells, alveolar bone cells, and periosteal cells. Oral Surg Oral Med Oral Pathol Oral Radiol Endod 2006; 101:164–169. [DOI] [PubMed] [Google Scholar]
- 4. Kawase T, Okuda K, Kogami H, et al. Characterization of human cultured periosteal sheets expressing bone‐forming potential: in vitro and in vivo animal studies. J Tissue Eng Regen Med 2009; 3:218–229. [DOI] [PubMed] [Google Scholar]
- 5. Uematsu K, Kawase T, Nagata M, et al. Tissue culture of human alveolar periosteal sheets using a stem‐cell culture medium (MesenPRO‐RSTM): in vitro expansion of CD146‐positive cells and concomitant upregulation of osteogenic potential in vivo. Stem Cell Res 2013; 10:1–19. [DOI] [PubMed] [Google Scholar]
- 6. Uematsu K, Nagata M, Kawase T, Suzuki K, Takagi R. Application of stem‐cell media to explant culture of human periosteum: an optimal approach for preparing osteogenic cell material. J Tissue Eng 2013; 4:2041731413509646. [DOI] [PMC free article] [PubMed] [Google Scholar]
- 7. Nagata M, Hoshina H, Li M, et al. A clinical study of alveolar bone tissue engineering with cultured autogenous periosteal cells: coordinated activation of bone formation and resorption. Bone 2012; 50:1123–1129. [DOI] [PubMed] [Google Scholar]
- 8. Shayesteh YS, Khojasteh A, Soleimani M, Alikhasi M, Khoshzaban A, Ahmadbeigi N. Sinus augmentation using human mesenchymal stem cells loaded into a beta‐tricalcium phosphate/hydroxyapatite scaffold. Oral Surg Oral Med Oral Pathol Oral Radiol Endod 2008; 106:203–209. [DOI] [PubMed] [Google Scholar]
- 9. Kim YK, Yun PY, Kim SG, Kim BS, Ong JL. Evaluation of sinus bone resorption and marginal bone loss after sinus bone grafting and implant placement. Oral Surg Oral Med Oral Pathol Oral Radiol Endod 2009; 107:e21–e28. [DOI] [PubMed] [Google Scholar]
- 10. Zijderveld SA, Schulten EA, Aartman IH, ten Bruggenkate CM. Long‐term changes in graft height after maxillary sinus floor elevation with different grafting materials: radiographic evaluation with a minimum follow‐up of 4.5 years. Clin Oral Implants Res 2009; 20:691–700. [DOI] [PubMed] [Google Scholar]
- 11. Buyukkurt MC, Tozoglu S, Yavuz MS, Aras MH. Simulation of sinus floor augmentation with symphysis bone graft using three‐dimensional computerized tomography. Int J Oral Maxillofac Surg 2010; 39:788–792. [DOI] [PubMed] [Google Scholar]
- 12. Arias‐Irimia O, Barona‐Dorado C, Martinez‐Rodriguez N, Ortega‐Aranegui R, Martinez‐Gonzalez JM. Pre‐operative evaluation of the volume of bone graft in sinus lifts by means of CompuDent. Med Oral Patol Oral Cir Bucal 2010; 15:e512–e516. [DOI] [PubMed] [Google Scholar]
- 13. Cosso MG, de Brito RB, Piattelli A Jr, Shibli JA, Zenóbio EG. Volumetric dimensional changes of autogenous bone and the mixture of hydroxyapatite and autogenous bone graft in humans maxillary sinus augmentation. A multislice tomographic study. Clin Oral Implants Res 2014; 25:1251–1256. [DOI] [PubMed] [Google Scholar]
- 14. Misch CE. Bone density: a key determinant for treatment planning In: Misch CE, ed. Contemporary implant dentistry. 3rd ed St Louis, MO: Elsevier Mosby, 2008:130–146. [Google Scholar]
- 15. Arasawa M, Oda Y, Kobayashi T, et al. Evaluation of bone volume changes after sinus floor augmentation with autogenous bone grafts. Int J Oral Maxillofac Surg 2012; 41:853–857. [DOI] [PubMed] [Google Scholar]
- 16. Riecke B, Heiland M, Hothan A, Morlock M, Amling M, Blake FAS. Primary implant stability after maxillary sinus augmentation with autogenous mesenchymal stem cells: a biomechanical evaluation in rabbits. Clin Oral Implants Res 2011; 22:1242–1246. [DOI] [PubMed] [Google Scholar]
- 17. Javed F, Ahmed HB, Crespi R, Romanos GE. Role of primary stability for successful osseointegration of dental implants: factors of influence and evaluation. Interv Med Appl Sci 2013; 5:162–167. [DOI] [PMC free article] [PubMed] [Google Scholar]
- 18. Jensen S, Katsuyama H. ITI treatment guide In: Chen S, Buser D, Wismeijer D, eds. Sinus floor elevation procedures. Vol. 5 Tokyo: Quintessence Publishing Co Ltd., 2011. [Google Scholar]
- 19. Zambon R, Mardas N, Horvath A, Petrie A, Dard M, Donos N. The effect of loading in regenerated bone in dehiscence defects following a combined approach of bone grafting and GBR. Clin Oral Implants Res 2012; 23:591–601. [DOI] [PubMed] [Google Scholar]
- 20. Ghanaati S, Barbeck M, Willershausen I, et al. Nanocrystalline hydroxyapatite bone substitute leads to sufficient bone tissue formation already after 3 months: histological and histomorphometrical analysis 3 and 6 months following human sinus cavity augmentation. Clin Implant Dent Relat Res 2013; 15:883–892. [DOI] [PubMed] [Google Scholar]
- 21. Yamada Y, Nakamura S, Ito K, et al. Injectable tissue‐engineered bone using autogenous bone marrow‐derived stromal cells for maxillary sinus augmentation: clinical application report from a 2–6‐year follow‐up. Tissue Eng Part A 2008; 4:1699–1707. [DOI] [PubMed] [Google Scholar]
- 22. Wolff J, Sándor GK, Miettinen A, et al. GMP‐level adipose stem cells combined with computer‐aided manufacturing to reconstruct mandibular ameloblastoma resection defects: experience with three cases. Ann Maxillofac Surg 2013; 3:114–125. [DOI] [PMC free article] [PubMed] [Google Scholar]