

Summary
Background
Vedolizumab, an anti‐α4β7 integrin monoclonal antibody (mAb), is indicated for treating patients with moderately to severely active ulcerative colitis (UC) and Crohn's disease (CD). As higher therapeutic mAb concentrations have been associated with greater efficacy in inflammatory bowel disease, understanding determinants of vedolizumab clearance may help to optimise dosing.
Aims
To characterise vedolizumab pharmacokinetics in patients with UC and CD, to identify clinically relevant determinants of vedolizumab clearance, and to describe the pharmacokinetic–pharmacodynamic relationship using population modelling.
Methods
Data from a phase 1 healthy volunteer study, a phase 2 UC study, and 3 phase 3 UC/CD studies were included. Population pharmacokinetic analysis for repeated measures was conducted using nonlinear mixed effects modelling. Results from the base model, developed using extensive phase 1 and 2 data, were used to develop the full covariate model, which was fit to sparse phase 3 data.
Results
Vedolizumab pharmacokinetics was described by a 2‐compartment model with parallel linear and nonlinear elimination. Using reference covariate values, linear elimination half‐life of vedolizumab was 25.5 days; linear clearance (CLL) was 0.159 L/day for UC and 0.155 L/day for CD; central compartment volume of distribution (V c) was 3.19 L; and peripheral compartment volume of distribution was 1.66 L. Interindividual variabilities (%CV) were 35% for CLL and 19% for V c; residual variance was 24%. Only extreme albumin and body weight values were identified as potential clinically important predictors of CLL.
Conclusions
Population pharmacokinetic parameters were similar in patients with moderately to severely active UC and CD. This analysis supports use of vedolizumab fixed dosing in these patients. Clinicaltrials.gov Identifiers: NCT01177228; NCT00783718 (GEMINI 1); NCT00783692 (GEMINI 2); NCT01224171 (GEMINI 3).
Introduction
Vedolizumab, a humanised monoclonal antibody that binds specifically to the α 4 β 7 integrin, is indicated for the treatment of patients with moderately to severely active ulcerative colitis (UC) and Crohn's disease (CD).1 By binding to cell surface‐expressed α4β7, vedolizumab blocks the interaction of a subset of memory gut‐homing T lymphocytes with mucosal addressin cell adhesion molecule‐1 (MAdCAM–1) expressed on endothelial cells. Consequently, migration of these cells into inflamed intestinal tissue is inhibited.1 The specificity of vedolizumab results in a novel gut‐selective mechanism of action that differs from that of other currently marketed biologic agents for the treatment for UC and CD, including natalizumab and tumour necrosis factor‐α (TNF‐α) antagonists.
The pharmacokinetics of other therapeutic monoclonal antibodies used for the treatment of UC and CD have been reported previously.2 Several factors are associated with accelerated clearance of these antibodies, including the presence of anti‐drug antibodies (ADAs), sex, body size, concomitant immunosuppressant use, inflammatory bowel disease (IBD) type, albumin concentration and degree of systemic inflammation.3 Furthermore, a consistent relationship between efficacy and exposure, in distinction to drug dose, has been observed for many of these agents; that is, higher trough drug concentrations are associated with greater efficacy.4 Differences in drug clearance may be an important explanation for this observation. Therefore, a better understanding of the determinants of clearance for therapeutic antibodies may result in optimization of drug dosing regimens.
The single‐dose pharmacokinetics, pharmacodynamics (α4β7 receptor saturation), safety and tolerability of vedolizumab have been investigated over a dose range of 0.2–10 mg/kg in healthy volunteers (intravenous [IV] infusion) (Takeda Pharmaceuticals International, Inc., data on file). After reaching peak concentrations, vedolizumab serum concentrations fell in a generally biexponential fashion until concentrations reached approximately 1–10 ng/mL. Thereafter, concentrations appeared to fall in a nonlinear fashion. The multiple‐dose pharmacokinetics and pharmacodynamics of vedolizumab have been investigated following IV infusions of 0.5 and 2 mg/kg in patients with CD5 and patients with UC6 and following IV infusions of 2, 6, and 10 mg/kg in patients with UC.7 Vedolizumab pharmacokinetics was generally linear following IV infusion over the dose range of 2–10 mg/kg in patients with UC.7 After multiple‐dose administration, rapid and near complete α4β7 receptor saturation was achieved following the first dose of vedolizumab in patients with UC.7
The efficacy and safety of vedolizumab 300 mg IV induction therapy and vedolizumab 300 mg IV maintenance therapy administered every 8 weeks (Q8W) or every 4 weeks (Q4W) were demonstrated in patients with moderately to severely active UC in the GEMINI 1 trial and in patients with moderately to severely active CD in the GEMINI 2 and 3 trials.8, 9, 10 The exposure‐response (efficacy) relationships of vedolizumab induction and maintenance therapy in these patients have been presented elsewhere.8, 9, 11, 12
Here, we report a comprehensive population pharmacokinetic and pharmacodynamic analysis of vedolizumab therapy in patients with UC and CD. Our objectives were to (i) characterise the pharmacokinetics of vedolizumab in patients who received repeated IV infusions of vedolizumab 300 mg for up to 52 weeks; (ii) identify clinically relevant determinants of vedolizumab clearance in patients; and (iii) describe the pharmacokinetic–pharmacodynamic relationship of vedolizumab in patients using MAdCAM‐1 as the pharmacodynamic endpoint.
Materials and methods
Study design and sample collection
Analyses were conducted using vedolizumab serum concentrations obtained from 5 randomised, placebo‐controlled clinical studies: a phase 1 study in healthy volunteers, a phase 2 study in patients with active UC (NCT01177228), a phase 3 study in patients with moderately to severely active UC [GEMINI 1 (NCT00783718)], and 2 phase 3 studies in patients with moderately to severely active CD [GEMINI 2 (NCT00783692) and GEMINI 3 (NCT01224171)] (Table S1). The study designs and clinical data for the phase 2 and 3 studies have been previously reported.7, 8, 9, 10 All study protocols and consent forms were approved by institutional review boards or ethics committees at the study sites, and studies were conducted in accordance with the principles of good clinical practice and the Declaration of Helsinki. All patients provided written informed consent before study participation.
Details of the blood sampling times for pharmacokinetic, pharmacodynamic (MAdCAM‐1), and ADA analyses are provided in Table S1. Extensive pharmacokinetic and pharmacodynamic sampling was used in the phase 1 and 2 studies, whereas sparse sampling was used in the phase 3 studies. Pharmacodynamic samples were not collected in GEMINI 3.
Assays
Vedolizumab serum concentrations were determined using a sandwich enzyme‐linked immunosorbent assay (ELISA), with a lower limit of quantification of 1.25 ng/mL at a 1:100 dilution (125 ng/mL in undiluted serum). The upper limit of quantification was 8 μg/mL; serum samples with vedolizumab concentrations greater than 8 μg/mL were diluted to within the assay range. The assay was validated at Quest Pharmaceutical Services (Newark, DE, USA). The accuracy of the assay ranged from −2.5% to 10.1% difference, intra‐sample precision ranged from 1.8% to 3.1% CV, and inter‐sample precision ranged from 4.0% to 16.2% CV.
To quantitate α4β7 integrin saturation by vedolizumab in peripheral blood, a MAdCAM–1–Fc binding interference flow cytometry assay was developed. In this pharmacodynamic assay, inhibition of MAdCAM‐1‐Fc binding to α4β7‐expressing peripheral blood cells by vedolizumab in the blood is used as a measure of the extent of α4β7 saturation by vedolizumab.1 The assay, which was developed by Millennium Pharmaceuticals, Inc. (d/b/a Takeda Pharmaceuticals International, Co.) and validated at Esoterix Center for Clinical Trial Research (Brentwood, TN, USA), demonstrated an overall intra‐sample variability of 6% CV and an intra‐subject variability of 20% CV.
The presence of ADAs was determined using a validated, biotinylated, bridging ELISA and 2 dilutions of serum (1:5 and 1:50). All samples that screened positive were further diluted to determine the final ADA titre using standard techniques. If both screening dilutions were negative, the sample was considered negative. Patients were classified as positive for ADAs if antibodies were detected at any visit; otherwise, they were classified as negative.
Data assembly
The dosing, covariate and pharmacokinetic‐pharmacodynamic data were merged and formatted for the population analysis using R, Version 2.10.1 or higher (http://www.r-project.org/). Vedolizumab serum concentration measurements that were missing, or any values with unknown or missing associated observation times, dose times, dose amounts or dosing intervals, were excluded from the analysis. MAdCAM‐1 measurements were treated similarly. All samples with vedolizumab concentrations below the limit of quantification (BLQ) (n = 3189) were not evaluated during the population pharmacokinetic model development. More than half of the BLQ observations (n = 1722) were samples obtained prior to the first vedolizumab dose.
Covariates present in the population pharmacokinetic data set were serum C‐reactive protein (CRP), serum albumin, faecal calprotectin, body weight, disease activity [Crohn's Disease Activity Index (CDAI), complete Mayo score, partial Mayo score], Mayo endoscopic subscore, age, sex, ADA status (positive or negative), prior TNF‐α antagonist therapy status (naïve or failed), body mass index (BMI), serum globulin, IBD diagnosis (CD or UC), lymphocyte count and concomitant therapy use (methotrexate, azathioprine, mercaptopurine or aminosalicylates). The start date and end date of concomitant therapy were populated in the data set to evaluate the time‐dependent effects of concomitant treatments. Covariates with missing data were imputed using different imputation methods, based on the remaining available data (e.g. median of the remaining values). No covariates present in the data set were missing more than 10% of values.
Population pharmacokinetic model development
The population pharmacokinetic analysis for repeated measures was conducted using a nonlinear mixed effects modelling approach (NONMEM 7, Version 7.2; ICON Development Solutions, Hanover, MD, USA).13 The base population pharmacokinetic model was developed using the first‐order conditional estimation with η‐ε interaction (FOCEI) method and extensively sampled phase 1 and 2 data. Results from the base model were subsequently used as prior information to selectively inform a subset of population pharmacokinetic model parameters in the full covariate model, which was fit to sparse phase 3 data from GEMINI 1, 2 and 3 using the full Bayesian Markov Chain Monte Carlo (MCMC) method. All parameter estimates were reported with Bayesian 95% credible intervals (CDIs) as a measure of estimation uncertainty.
A covariate modelling approach emphasising parameter estimation rather than stepwise hypothesis testing was implemented for the population pharmacokinetic analysis.14 First, predefined covariate‐parameter relationships were identified based on exploratory graphics, scientific interest, and mechanistic plausibility. Then a full covariate model was constructed with care to avoid correlation or collinearity in predictors; covariates with correlation coefficients greater than approximately 0.35 were not simultaneously included as potential predictors. Construction of the full model was also guided by evaluating the adequacy of the study design and covariate data to support quantification of the covariate effects of interest.
During development of the covariate model, strong correlations were identified between the following covariates: body weight–BMI, sex–body weight, CRP–albumin, CRP–faecal calprotectin, CRP–globulin, albumin–globulin, complete Mayo score–partial Mayo score, Mayo endoscopic subscore–complete Mayo score, and Mayo endoscopic subscore–partial Mayo score. Therefore, sex, CRP, complete Mayo score, Mayo endoscopic subscore, globulin, and BMI were excluded from the full covariate model. As the effects of sex, CRP, and Mayo endoscopic subscore on the pharmacokinetics of vedolizumab could not be uniquely estimated in the full model given their correlation with other covariates, any remaining effects of these covariates were independently evaluated in an exploratory post hoc fashion once the population pharmacokinetic model was finalised.
Body weight was chosen to represent changes in vedolizumab pharmacokinetics as a function of body size and was described using an allometric model with a reference weight of 70 kg. The other continuous covariates of albumin, faecal calprotectin, partial Mayo score, age, and CDAI score entered the model as power functions normalised by a reference value. The categorical covariates of prior TNF‐α antagonist therapy status, ADA status, concomitant therapy use, and IBD diagnosis entered the model as power functions, with a separate dichotomous (0, 1) covariate serving as an on‐off switch for each effect. Time‐dependent covariates were body weight, albumin, faecal calprotectin, and concomitant therapy use. The effect of IBD diagnosis on linear clearance (CL L) was investigated by modelling separate CL L parameters for patients with UC and those with CD, while the effect of IBD diagnosis on central compartment volume of distribution (V c) was evaluated by including diagnosis as a predictor of V c in the covariate model.
Inferences about the clinical relevance of parameters were based on the resulting parameter estimates and measures of estimation precision (Bayesian 95% CDIs) from the full model. In the absence of an exposure‐response relationship for efficacy‐related clinical endpoints to provide a context for interpretation of pharmacokinetic variability, covariate effect sizes on CL L greater than ± 25% of the normalised reference value were proposed as clinically meaningful changes.
Further details regarding the population pharmacokinetic and pharmacodynamic analysis methods, including modelling assumptions and model evaluation, are provided in Appendix S1.
Population pharmacokinetic‐pharmacodynamic model development
The population pharmacokinetic‐pharmacodynamic analysis for repeated measures was conducted using a nonlinear mixed effects modelling approach (NONMEM, Version 7.2).13 The pharmacokinetic‐pharmacodynamic data were modelled using a sequential approach, where individual predicted vedolizumab serum concentrations from the population pharmacokinetic model were used to drive the pharmacodynamic response. The pharmacodynamic evaluations were based on percentage of MAdCAM‐1 binding by lymphocytes expressing high levels of α4β7 integrin (CD4+ CD45ROhigh).
A direct effect sigmoid E max model was chosen as the structural model to describe the pharmacokinetic‐pharmacodynamic relationship of vedolizumab as follows:
where E 0 is the baseline MAdCAM‐1 percent binding, E max is the maximum effect, Conc is the vedolizumab serum concentration, EC 50 is the vedolizumab serum concentration at half‐maximum effect, and γ is the Hill‐coefficient or slope factor. No formal covariate modelling or model evaluation was conducted.
Results
Pharmacokinetic analysis data set
The pharmacokinetic analysis data set consisted of 2554 individuals who contributed 18 427 evaluable vedolizumab serum samples, including 87 healthy volunteers from the phase 1 study, 46 patients from the phase 2 study (UC), and 891, 1115, and 415 patients from the phase 3 GEMINI 1 (UC), GEMINI 2 (CD), and GEMINI 3 (CD) studies, respectively.
Demographics and other characteristics of the pharmacokinetic analysis data set are summarised in Table 1. The data set consisted of 1290 men and 1264 women with ages ranging from 18 to 78 years and baseline body weights ranging from 28 to 170 kg. A total of 1530 individuals had CD and 937 had UC; 87 were healthy volunteers.
Table 1.
Summary of demographics and other characteristics of the pharmacokinetic analysis data set (N = 2554)
| Categorical covariate | n (%) |
|---|---|
| Sex | |
| Women | 1264 (50) |
| Men | 1290 (50) |
| Disease diagnosis | |
| Crohn's disease | 1530 (60) |
| Ulcerative colitis | 937 (37) |
| Healthy volunteers | 87 (3) |
| Mayo Endoscopic Subscore | |
| 1 | 1 (0.039) |
| 2 | 408 (16) |
| 3 | 482 (19) |
| Missinga | 1663 (65) |
| Prior TNF‐α antagonist therapy status | |
| Failed | 1321 (52) |
| Naïve | 1100 (43) |
| Missingb | 133 (5) |
| ADA status | |
| Positive (≥1 positive titre) | 124 (5) |
| Negative (no positive titres) | 2430 (95) |
| Continuous covariate | n | Median (range) |
|---|---|---|
| Age, years | 2554 | 36 (18–78) |
| Body weight, kg | 2554 | 68 (28–170) |
| Albumin, g/L | 2467 | 37 (11–53) |
| C‐reactive protein, mg/L | 1576 | 11 (0.2–200) |
| Faecal calprotectin, mg/kg | 2421 | 720 (23.75–20 000) |
| CDAI score | 1530 | 320 (93–580) |
| Mayo Score | 891 | 9 (3–12) |
| Partial Mayo Score | 937 | 6 (1–9) |
ADA, anti‐drug antibody; CDAI, Crohn's Disease Activity Index; TNF‐α, tumour necrosis factor‐α.
Data not collected in phase 1 and 2 studies or in GEMINI 2 and 3 studies.
Data not collected in phase 1 and 2 studies.
The median (interquartile range) vedolizumab trough serum concentration‐time profiles for patients with UC from GEMINI 1 and patients with CD from GEMINI 2 are shown in Figure 1.
Figure 1.
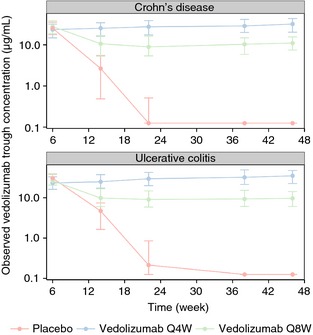
Median (interquartile range) of observed vedolizumab trough serum concentration vs. nominal sampling time in patients with UC (GEMINI 1) and patients with CD (GEMINI 2) during maintenance treatment with placebo or vedolizumab 300 mg every 4 weeks (Q4W) or every 8 weeks (Q8W). All patients (including those in the placebo group) received 2 doses of vedolizumab 300 mg during induction (at weeks 0 and 2). The median value is shown as a point and the interquartile range is represented by a vertical bar.
Population pharmacokinetic modelling results
Base pharmacokinetic model
Vedolizumab pharmacokinetics was described by a 2–compartment model with parallel linear and nonlinear elimination. A 2‐compartment model resulted in a significant improvement in goodness‐of‐fit criteria over a 1–compartment model, as did a parallel linear and nonlinear elimination model over a linear model. The population pharmacokinetic model of vedolizumab is represented diagrammatically in Figure 2.
Figure 2.

Diagrammatic representation of the population pharmacokinetic model of vedolizumab. Conc, vedolizumab concentration; K m, concentration at half‐maximum elimination rate; V max, maximum elimination rate.
Final pharmacokinetic model
Pharmacokinetic parameter estimates and 95% CDIs from the final population pharmacokinetic model are shown in Table 2, and their interindividual variability estimates are shown in Table S2. The parameter estimates and overlapping 95% CDIs indicated that vedolizumab CL L was the same in patients with UC (0.159 L/day) and those with CD (0.155 L/day). Individual CL L estimates were distributed over a wide range as represented in Figure 3. The half‐life of vedolizumab for the linear elimination phase was 25.5 days; individual estimates ranged from 14.6 to 36.0 days (5th and 95th percentiles, respectively). Interindividual variability estimates (% CV) from the model were 34.6% for CL L and 19.1% for V c, indicative of moderate to large unexplained variability (Table S2).
Table 2.
Parameter estimates from the final population pharmacokinetic model for vedolizumab
| Parameter | Estimatea | Bayesian 95% CDI |
|---|---|---|
| Ulcerative colitis: CL L | 0.159 L/day | 0.153–0.165 |
| Crohn's Disease: CL L | 0.155 L/day | 0.149–0.161 |
| Central compartment volume of distribution (V c) | 3.19 L | 3.14–3.25 |
| Peripheral compartment volume of distribution (V p) | 1.65 L | 1.59–1.71 |
| Intercompartmental clearance (Q) | 0.12 L/day | 0.112–0.129 |
| Maximum elimination rate (V max) | 0.265 mg/day | 0.219–0.318 |
| Concentration at half‐maximum elimination rate (K m) | 0.964 μg/mL | 0.706–1.27 |
| Proportional residual error variance (σ2 prop) | 0.0554 (% CV = 23.5) | 0.0539–0.0568 |
CDI, credible interval; CL L, clearance of linear elimination pathway; CV, coefficient of variation.
Parameter estimate and 95% credible interval were derived from the median and 2.5th and 97.5th percentiles, respectively, of the Bayesian posterior probability distributions from 4 Markov Chain Monte Carlo chains. Separate values of CL L were modelled for patients with UC and those with CD with a shared interindividual variance term and shared covariate effects except for partial Mayo score and CDAI score. The reference individual weighs 70 kg; is 40 years old; has an albumin level of 4 g/dL, a fecal calprotectin level of 700 mg/kg, a CDAI score of 300 (for patient with CD), a partial Mayo score of 6 (for patient with UC), a diagnosis of UC (for V c parameter), and no concomitant therapy use; and is anti‐drug antibody negative and tumour necrosis factor‐α antagonist therapy naïve.
Figure 3.

Distribution of individual vedolizumab linear clearance (CLL) estimates from the final population pharmacokinetic model in patients with UC and patients with CD.
The residual error (unexplained random residual variability in the model) was 23.5% (% CV), which is considered relatively small (Table 2). Standard deviations and shrinkage estimates of interindividual random effects are presented in Table S3. Goodness‐of‐fit plots from the final population pharmacokinetic model are presented in Figures 4 and S1. These plots indicate that the full covariate pharmacokinetic model was consistent with the observed data and no systematic bias was evident.
Figure 4.

Goodness‐of‐fit plots: observed vedolizumab serum concentration vs. population and individual predicted vedolizumab concentration from the final population pharmacokinetic model. Values are shown as points with a dashed pink loess trend line through the data. A line of identity (solid black) is shown for reference.
The relative changes in CL L for a reference patient with various covariate values are illustrated in Figure 5. The impact of these covariates on CL L was evaluated univariately. The point estimates and 95% CDIs for the effects of covariates on CL L are presented in Table S4. In general, the 95% CDIs were narrow indicating that the effect of each covariate on vedolizumab CL L was well defined. Only the effects of albumin and body weight at extreme values had the potential to be clinically meaningful (effect sizes greater than ±25%). The CL L values for patients with albumin levels of 4.7 and 3.2 g/dL were approximately 0.8 and 1.3 times, respectively, that of the reference patient (albumin, 4 g/dL) (Figure 5). The CL L values for patients of 40 and 120 kg were approximately 0.8 and 1.2 times, respectively, that of the reference patient (weight, 70 kg) (Figure 5). A patient of 120 kg with a serum albumin concentration of 4.0 g/dL had a 19% probability of having a CL L value greater than the pre‐specified criterion for clinical significance. When evaluated across a representative range of covariate values and categories, the effects of faecal calprotectin, CDAI score, partial Mayo score, age, prior TNF–α antagonist therapy status, ADA status, and concomitant therapy use on vedolizumab CL L were not considered clinically relevant as the covariate effect sizes were less than ±25% from the reference values (Figure 5 and Table S4). In addition, the 95% CDIs for these covariate effects contained the null effect value.
Figure 5.

Effect of covariates on vedolizumab linear clearance (CLL). Each point and line represent the median and 95% credible interval, respectively, of the Bayesian posterior distribution of normalised samples of vedolizumab CLL adjusted for the covariate. The reference individual weighs 70 kg; is 40 years old; has an albumin level of 4 g/dL, a faecal calprotectin level of 700 mg/kg, a CDAI score of 300 (for patient with CD), a partial Mayo score of 6 (for patient with UC), and no concomitant therapy use; and is ADA negative and TNF‐α antagonist therapy naïve. Albumin: 2.7, 3.2, 3.7, 4.2 and 4.7 g/dL represent the 6th, 18th, 70th, 85th, and 98.5th percentiles, respectively, of baseline albumin levels for patients in GEMINI 1, 2, and 3. Weight: 40, 60, 80, 100, and 120 kg represent the 1.5th, 30th, 71st, 92nd and 98th percentiles, respectively, of baseline weight values for patients in GEMINI 1, 2, and 3. The vertical black line is drawn at the reference point estimate, and the shaded region is ± 25% of the reference point estimate chosen to represent an uncertainty range of clinical unimportance.
The final population pharmacokinetic model was rerun with all covariate effects and pharmacokinetic parameters fixed to estimates from the final model (interindividual variances were re‐estimated), and any remaining effects of sex on CL L and V c were quantified. The results of this analysis suggest that, after adjustment for other predictors of vedolizumab CL L, the CL L and V c values were approximately 10% lower and 6% lower, respectively, for a female patient compared with a male patient. However, these effects were not considered clinically relevant as the covariate effect sizes were less than ± 25% from the reference values (male patient). Addition of the sex effect explained approximately 4.2% and 6.0% of the unexplained interindividual variability in CL L and V c, respectively.
The final population pharmacokinetic model also was re‐run to estimate any remaining effect of CRP on CL L. The results suggest that, after adjustment for other predictors of vedolizumab CL L (such as albumin), the effect of CRP on CL L was not clinically relevant as the covariate effect size was less than ± 25% from the reference value (CRP, 11 mg/dL). The addition of the CRP effect explained <1% of the unexplained interindividual variability in CL L.
For patients with UC, the effect of Mayo endoscopic subscore was evaluated graphically by plotting individual CL L estimates from the final population pharmacokinetic model by endoscopic subscore at week 6 (Figure 6). From this analysis, at week 6 (end of induction treatment), patients with an endoscopic subscore of 3 had on average 25% higher CL L than patients with an endoscopic subscore of 0.
Figure 6.

Individual vedolizumab linear clearance (CLL) estimates by Mayo endoscopic subscore at the end of induction (week 6) for patients with UC (GEMINI 1). Midlines represent medians. Box limits represent 25th and 75th percentiles. Whiskers (error bars) represent highest and lowest points within 1.5 × interquartile range. Individual points represent outliers.
Pharmacokinetic model evaluation
The final population pharmacokinetic model and parameter estimates were evaluated with a predictive check method and Bayesian 95% CDIs derived from the posterior probability distributions. The basic premise of a predictive check is that a model and parameters derived from an observed data set should produce simulated data that are similar to the original observed data. The predictive check plots demonstrated overall good agreement between the observed and simulated data (Figures S2–S4). The precision of the parameter estimates was assessed by evaluating the Bayesian 95% CDIs (Tables 2, S2, and S4). Overall, the structural pharmacokinetic model parameters, covariate effects and variance parameters were estimated with good precision.
Pharmacokinetic‐pharmacodynamic data set
The vedolizumab population pharmacokinetic‐pharmacodynamic data set was composed of 593 individuals contributing a total of 2442 evaluable MAdCAM‐1 observations. The data set consisted of 297 patients with UC and 296 patients with CD (from the phase 2 study and phase 3 GEMINI 1 and 2 studies).
During the analysis, the log‐transformed values of MAdCAM‐1 (free α4β7 receptors not blocked by vedolizumab) were modelled. A plot of observed MAdCAM‐1 measurements (percentage of free α4β7 receptors) vs. observed vedolizumab serum concentrations for patients with UC and CD from GEMINI 1 and 2, respectively, is presented in Figure 7. Plots of observed MAdCAM‐1 measurements vs. time by treatment regimen for patients with UC and CD in GEMINI 1 and 2, respectively, are presented in Figure 8. The percentage of free α4β7 receptors declined rapidly after the first dose and this reduction was maintained during repeated IV infusions of vedolizumab 300 mg.
Figure 7.

Receptor (α4β7) saturation plot: observed MAdCAM‐1 vs. observed vedolizumab serum concentration in patients with UC (GEMINI 1) and patients with CD (GEMINI 2). Baseline data are included.
Figure 8.

Observed MAdCAM‐1 vs. time for patients with UC (GEMINI 1) and patients with CD (GEMINI 2). Upper left panel: patients received placebo during induction and maintenance; upper right panel: patients received 2 doses of vedolizumab 300 mg during induction and vedolizumab 300 mg every 4 weeks (Q4W) during maintenance; lower left panel: patients received 2 doses of vedolizumab 300 mg during induction and vedolizumab 300 mg every 8 weeks (Q8W) during maintenance; lower right panel: patients received 2 doses of vedolizumab 300 mg during induction and placebo during maintenance.
Population pharmacokinetic‐pharmacodynamic modelling results
Structural parameter estimates from the population pharmacokinetic‐pharmacodynamic model are presented in Table 3; parameters were estimated with adequate precision. An attempt was made to model a placebo effect, but the estimated effect was negligible. The lack of an apparent placebo effect was consistent with the observed MAdCAM‐1 data in placebo–treated patients.
Table 3.
Parameter estimates from base MAdCAM‐1 population pharmacokinetic–pharmacodynamic model for vedolizumab
| Parameter | Estimate | Percent relative S.E. |
|---|---|---|
| Baseline MAdCAM‐1 percent binding (E 0) | 12.1% | 3.49 |
| Vedolizumab serum concentration at half‐maximum effect (EC 50) | 0.093 μg/mL | 25.8 |
| Maximum effect (E max) | 0.959 | 0.503 |
| Hill‐coefficient or slope factor (γ) | 0.801 | 11.1 |
| Exponential residual error variance (σ2 exp) | 0.613 (% CV = 78.3) | 10.4 |
CV, coefficient of variation; S.E., standard error.
The base model provided a reasonable description of the data as judged by visual inspection of diagnostic plots (Figure S5), but some deficiencies in the model were noted. Variance parameter estimates were indicative of moderate to large unexplained interindividual and residual variability, with estimates of 41.8% CV for E 0, 0.551 (SD logistic distribution) for E max, and 78.3% CV for the exponential residual error variance (σ2 exp) (Table 3).
Discussion
We developed a population pharmacokinetic model for vedolizumab administered IV to healthy volunteers and patients with moderately to severely active UC and CD, using data collected in clinical trials with identical designs and sampling schedules. These design features allowed the direct comparison of the disposition and pharmacokinetic variability in vedolizumab in patients with UC and patients with CD. The estimated half‐life of vedolizumab was not different between the 2 diseases and was 25.5 days for the reference patient [individual estimates ranged from 14.6 to 36.0 days (5th and 95th percentiles respectively)], which is typical of human IgG1 (25 days) and of monoclonal antibodies of the IgG1 subclass. This half‐life is longer than values for other currently marketed biologic treatments for UC and CD. Clinicians should be aware of the relatively long half‐life of vedolizumab in circumstances when it is desirable to minimise exposure to the drug.
A 2‐compartment pharmacokinetic model consisting of parallel clearance via a nonlinear pathway (CL NL) and a linear pathway (CL L) from the central compartment was selected as the base model for vedolizumab. The nonlinear elimination was best described by Michaelis–Menten elimination.15 Physiologically, the nonlinear pathway is thought to be due to clearance by saturable, target‐mediated mechanisms such as receptor‐mediated endocytosis. In contrast, the linear pathway represents components that are nonsaturable at therapeutic concentrations, such as Fc‐mediated elimination. Parallel elimination is typical of monoclonal antibodies with disposition that is affected by binding to the target, in the case of vedolizumab, the α4β7 integrin on circulating T lymphocytes.16 Similar target‐mediated drug disposition properties have been reported for efalizumab, tocilizumab and cetuximab.17, 18, 19 In contrast, the elimination of TNF‐α antagonists, such as infliximab and golimumab, was best described by a single linear elimination pathway.20, 21, 22 TNF‐α exists in both soluble and membrane‐bound forms and is present in abnormally high concentrations in serum and gut mucosa in patients with IBD. The localization of TNF‐α in inflammatory tissues may make it difficult to rapidly achieve target saturation at therapeutic concentrations because of slow redistribution of the drug from plasma to the target sites.23 Furthermore, variability in TNF‐α concentrations in different compartments results in drug redistribution, with possible effects on pharmacokinetic‐efficacy/safety relationships of TNF‐α antagonists.24 The clinical implications of these differences in elimination pathways are not currently understood.
The vedolizumab CL L values estimated from the pharmacokinetic model are consistent with those of other monoclonal antibodies that are administered intravenously.18, 20, 22 Although some authors have reported that the clearance of monoclonal antibodies could be affected by IBD type,3 no apparent differences were observed in the CL L of vedolizumab in patients with UC and those with CD. Vedolizumab CL L for a 40‐year‐old, 70‐kg patient with a serum albumin concentration of 4 g/dL was 0.159 L/day for a patient with UC and 0.155 L/day for a patient with CD.
We evaluated the potential effects of intrinsic and extrinsic covariates (body weight, age, albumin, faecal calprotectin, CDAI score, partial Mayo score, concomitant therapy use, ADA status, and prior TNF‐α antagonist therapy status) on vedolizumab CL L. Extreme values of albumin had important effects on vedolizumab CL L. Specifically, CL L increased as albumin concentrations decreased. Albumin concentrations below 3.2 g/dL, for a patient of 70 kg, were associated with increased vedolizumab CL L that was greater than the pre‐specified criterion for clinical significance. Similar association of low albumin concentrations with increased clearance has been reported in population pharmacokinetic analyses of other monoclonal antibodies.21, 25 Although the mechanism of this interaction is incompletely understood, the neonatal Fc receptor (FcRn)–which is expressed in a wide variety of cells and tissues throughout the body, including the vascular endothelium, monocytes, macrophages, dendritic cells, hepatocytes and epithelial cells of the intestine, renal proximal convoluted tubules, and upper airways–facilitates IgG and albumin homeostasis by salvaging these molecules from proteolysis and recycling them into the central circulatory system. It has been postulated that decreased expression and/or activity of FcRn in patients with IBD results in low albumin and IgG concentrations due to less efficient salvage of these proteins; the net result is increased antibody clearance.26 However, this hypothesis has not been proven. Another possible explanation is that inflammation of the gastrointestinal tract in patients with IBD can result in an unconventional route of elimination. Specifically, in the setting of severe colitis, patients may develop a protein‐losing colopathy in which large amounts of protein are lost from the luminal surface. Albumin may therefore serve as a surrogate marker for loss of endogenous IgG and monoclonal antibodies via this pathway. This hypothesis is in part supported by observations in patients with severe colitis treated with infliximab, in whom concentrations of the monoclonal antibody were high in the stool and low in serum; successful treatment was associated with resolution of this phenomenon.27 Vedolizumab concentrations in faeces were not measured during the GEMINI trials, precluding us from evaluating this hypothesis.
The second important covariate identified was body weight, which was positively correlated with vedolizumab CL L. A patient of 120 kg with a serum albumin concentration of 4.0 g/dL had a 19% probability of having CL L greater than the pre‐specified criterion for clinical significance. Measures of body size are the most commonly identified covariates influencing the pharmacokinetics of therapeutic monoclonal antibodies.25 The impact of body weight on vedolizumab CL L is consistent with that reported in population pharmacokinetic analyses of other therapeutic monoclonal antibodies.25
Other potential covariates had lesser effects on vedolizumab CL L than weight and albumin in the current analysis. Patients with UC who had lower Mayo endoscopic subscores had, on average, lower vedolizumab CL L and, therefore, higher serum concentrations than patients who had higher endoscopic subscores. This finding is consistent with what has been reported for TNF‐α antagonists.4, 28, 29, 30 However, these results should be interpreted with caution as it is possible that the relationship between vedolizumab CL L and endoscopic subscore is not causal but merely reflects the association between drug‐losing enteropathy and mucosal healing.
Intensity of inflammation has been reported as a positive predictor of clearance for other monoclonal antibodies.3 A post hoc exploratory analysis revealed that, after accounting for the effects of other covariates (such as albumin) in the existing pharmacokinetic model, the remaining effect of CRP on vedolizumab CL L is not clinically relevant and explained less than 1% of the unexplained interindividual variability in CL L. Therefore, as albumin and CRP were strongly correlated, any potential effect of CRP on vedolizumab CL L was already accounted for in the model by incorporating albumin. Similar results have been reported recently by Wade at al. for certolizumab pegol in patients with CD.31 In contrast, high CRP concentrations were strongly associated with increased clearance of anti‐TNF‐α monoclonal antibodies in the literature; however, effects of covariates such as albumin that appear to be correlated with inflammatory markers in patients with IBD were not investigated in these analyses.3
The development of ADAs has been reported to increase infliximab clearance.21 In the current analysis, the presence of ADAs was estimated to increase vedolizumab CL L by only 12%. Inferences regarding this impact are limited by the low incidence of ADAs observed in the GEMINI trials.8, 9, 10 In the few patients who were persistently positive for ADAs in these studies, vedolizumab trough concentrations were below the limit of quantification. We believe that sensitization of patients to monoclonal antibodies is an important cause of treatment failure and that vedolizumab is not unique in this regard.
The current analysis showed no clinically meaningful impact of prior TNF‐α antagonist therapy status, concomitant medication use, age (from 18 to 78 years old), and disease activity on vedolizumab CL L. The lack of association between prior TNF‐α antagonist therapy status and vedolizumab CL L is interesting, especially given that lack of prior TNF‐α antagonist therapy use was associated with a higher probability of clinical remission or response in vedolizumab‐treated patients with UC and those with CD.11, 12 Taken together, these observations suggest that the impact of prior TNF‐α antagonist therapy use on vedolizumab efficacy is not related to any effect on vedolizumab CL L.
The lack of an effect of thiopurines and methotrexate on vedolizumab CL L differs from effects seen on TNF‐α antagonists in patients with UC and CD and in patients with rheumatoid arthritis, where co‐administration of these agents is associated with higher trough concentrations and lower clearance of TNF‐α antagonists.32 The mechanism by which antimetabolites increase concentrations of biologic drugs is not well understood; however, modulation of Fcγ receptor expression is one possible explanation. For example, methotrexate is known to down‐regulate Fcγ receptors on monocytes and other Fc‐receptor subtypes. Another possible explanation is that the prevention of ADA development could increase drug exposure by reducing immune‐mediated drug clearance. The reason behind the lack of effect of concomitant medications on vedolizumab CL L is not currently understood. A sensitivity analysis was performed to determine whether the rate of concomitant medication use in the vedolizumab population pharmacokinetic data set was sufficient to achieve at least 80% power to detect no drug interaction, as recommended by the Population Pharmacokinetic Therapeutic Protein–Drug Interaction (PK TPDI) Working Group.33 This analysis revealed that the data set met the sample size requirements to ensure at least 80% power and confirmed that vedolizumab CL L was not impacted by concomitant use of azathioprine, mercaptopurine, methotrexate or aminosalicylates.34
Interestingly, α4β7 receptor saturation, as measured in the MAdCAM‐1 assay, was maintained at vedolizumab concentrations considered subtherapeutic, raising the question of whether receptor saturation is necessary but not sufficient for clinical efficacy. The EC 50 estimate from the population pharmacokinetic‐pharmacodynamic model was 0.093 μg/mL, suggesting that full saturation is reached at a vedolizumab serum concentration of approximately 1 μg/mL. Exposure‐efficacy data indicated that vedolizumab concentrations below 17 and 15 μg/mL at induction were associated with efficacy similar to placebo in patients with UC and those with CD, respectively.8, 9 This discrepancy might be explained by the fact that the MAdCAM‐1 assay measures α4β7 saturation in circulating T‐cells, or may be due to a slow onset of action of the drug. The MAdCAM‐1 assay is insensitive to dose and should not be used for dose selection. Further studies to evaluate the relative pharmacodynamic contributions of α4β7 receptor blockade in the peripheral blood vs. in the tissue compartment are a research priority.
In conclusion, a population model characterising the pharmacokinetic properties of vedolizumab was successfully developed for patients with UC and CD. The modelling results suggested that vedolizumab CL L was similar in patients with UC and those with CD. Albumin and body weight were identified as predictors of vedolizumab CL L, but the effects of these covariates were only considered clinically meaningful at extreme values. Surprisingly, concomitant use of immunosuppressants had no clinically relevant impact on vedolizumab CL L, a finding that contrasts with the well–established relationship between immunogenicity and TNF‐α antagonist concentrations. This analysis supports use of fixed dosing with vedolizumab in patients with UC and those with CD.
Authorship
Guarantor of the article: Maria Rosario.
Author contributions: Irving Fox, Asit Parikh, Ade A. Fasanmade, Brian G. Feagan, and William J. Sandborn contributed to the design of the vedolizumab clinical trials. Timothy Wyant assisted with the pharmacokinetic, pharmacodynamic and biomarker assays. Maria Rosario, Nathanael L. Dirks, Irving Fox, Brian G. Feagan, William J. Sandborn and Walter Reinisch provided input into the pharmacokinetic/pharmacodynamic analysis plan. Nathanael L. Dirks and Marc R. Gastonguay performed the pharmacokinetic/pharmacodynamic analyses. Maria Rosario and Nathanael L. Dirks assisted with the drafting of the manuscript.
All authors reviewed and revised the manuscript for important intellectual content and approved the final version of the manuscript prior to submission.
Supporting information
Figure S1. Goodness‐of‐fit plots for the vedolizumab final population pharmacokinetic model: residual and conditional weighted residual with interaction (CWRESI) vs. time and population predicted vedolizumab concentration.
Figure S2. Predictive check for the vedolizumab final population pharmacokinetic model: induction therapy.
Figure S3. Predictive check for the vedolizumab final population pharmacokinetic model: maintenance therapy every 4 weeks.
Figure S4. Predictive check for the vedolizumab final population pharmacokinetic model: maintenance therapy every 8 weeks.
Figure S5. Goodness‐of‐fit plots for the population pharmacodynamic MAdCAM‐1 model.
Table S1. Clinical studies included in vedolizumab population pharmacokinetic–pharmacodynamic analyses.
Table S2. Estimates of interindividual variability (%CV) and correlations from the vedolizumab final population pharmacokinetic model.
Table S3. Standard deviations and shrinkage estimates of interindividual random effects from the vedolizumab final population pharmacokinetic model.
Table S4. Covariate parameter estimates from the vedolizumab final population pharmacokinetic model.
Appendix S1. Population pharmacokinetic and pharmacodynamic analysis methods, including modelling assumptions and model evaluation.
Acknowledgements
Declaration of personal interests: Maria Rosario, Adedigbo A. Fasanmade, Timothy Wyant and Irving Fox are employees of Takeda Pharmaceuticals International Co. and hold equity stake in Takeda. Asit Parikh is an employee of Takeda Pharmaceuticals International, Inc. and holds equity stake in Takeda. Nathanael L. Dirks and Marc R. Gastonguay are employees of Metrum Research Group, LLC, and were paid consultants to Takeda for this research. William J. Sandborn has received consulting fees from Abbott, ActoGeniX NV, AGI Therapeutics Inc., Alba Therapeutics Corp, Albireo, Alfa Wasserman, Amgen, AM–Pharma BV, Anaphore, Astellas, Athersys Inc., Atlantic Healthcare Ltd, Aptalis, BioBalance Corp, Boehringer‐Ingelheim, Bristol‐Myers Squibb, Celgene, Celek Pharmaceuticals, Cellerix SL, Cerimon Pharmaceuticals, ChemoCentryx, CoMentis, Cosmo Technologies, Coronado Biosciences, Cytokine Pharmasciences, Eagle Pharmaceuticals, EnGene Inc., Eli Lilly, Enteromedics, Exagen Diagnostics Inc., Ferring Pharmaceuticals, Flexio Therapeutics Inc., Funxional Therapeutics Ltd, Genzyme Corp, Gilead Sciences, Given Imaging, GlaxoSmithKline, Human Genome Sciences, Ironwood Pharmaceuticals, KaloBios Pharmaceuticals, Lexicon Pharmaceuticals, Lycera Corp, Meda Pharmaceuticals, Merck Research Laboratories, Merck Serono, Millenium Pharmaceuticals, Nisshin Kyorin Pharmaceuticals, Novo Nordisk, NPS Pharmaceuticals, Optimer Pharmaceuticals, Orexigen Therapeutics Inc., PDL Biopharma, Pfizer, Procter and Gamble, Prometheus Laboratories, ProtAb Ltd, Purgenesis Technologies Inc., Relypsa Inc., Roche, Salient Pharmaceuticals, Salix Pharmaceuticals, Santarus, Schering Plough, Shire Pharmaceuticals, Sigmoid Pharma Ltd, Sirtris Pharmaceuticals, SLA Pharma UK Ltd, Targacept, Teva Pharmaceuticals, Therakos, Tillotts Pharma AG, TxCell SA, UCB Pharma, Viamet Pharmaceuticals, Vascular Biogenics Ltd, Warner Chilcott UK Ltd, and Wyeth; research grants from Abbott, Bristol–Myers Squibb, Genentech, GlaxoSmithKline, Janssen, Milennium Pharmaceuticals, Novartis, Pfizer, Procter and Gamble, Shire Pharmaceuticals, and UCB Pharma; payments for lectures/speakers bureaux from Abbott, Bristol‐Myers Squibb, and Janssen; and holds stock/stock options in Enteromedics. Brian G. Feagan has served as a speaker, a consultant, and/or an advisory board member for Abbott/AbbVie, Actogenix, Albireo Pharma, Amgen, Astra Zeneca, Avaxia Biologics Inc., Avir Pharma, Axcan, Baxter Healthcare Corp., Biogen Idec, Boehringer‐Ingelheim, Bristol‐Myers Squibb, Calypso Biotech, Celgene, Centocor Inc., Elan/Biogen, EnGene, Ferring Pharma, Roche/Genentech, GiCare Pharma, Gilead, Given Imaging Inc., GlaxoSmithKline, Ironwood Pharma, Janssen Biotech (Centocor), JnJ/Janssen, Kyowa Kakko Kirin Co Ltd, Lexicon, Lilly, Merck, Millennium, Nektar, Novartis Novonordisk, Pfizer, Prometheus Therapeutics and Diagnostics, Protagonist, Receptos, Salix Pharma, Serono, Shire, Sigmoid Pharma, Synergy Pharma Inc., Takeda, Teva Pharma, TiGenix, Tillotts, UCB Pharma, Vertex Pharma, VHsquared Ltd, Warner‐Chilcott, Wyeth, Zealand, and Zyngenia; has received research funding from Abbott/AbbVie, Amgen, Astra Zeneca, Bristol‐Myers Squibb, Janssen Biotech (Centocor), JnJ/Janssen, Roche/Genentech, Millennium, Pfizer, Receptos, Santarus, Sanofi, Tillotts, and UCB Pharma; and is an employee of Robarts Research Institute, University of Western Ontario. Walter Reinisch has served as a speaker, a consultant and/or an advisory board member for Abbott Laboratories, Abbvie, Aesca, Amgen, AM Pharma, Aptalis, Astellas, Astra Zeneca, Avaxia, Bioclinica, Biogen IDEC, Bristol‐Myers Squibb, Cellerix, Chemocentryx, Celgene, Centocor, Celltrion, Danone Austria, Elan, Falk Pharma GmbH, Ferring, Galapagos, Genentech, Grünenthal, Inova, Janssen, Johnson & Johnson, Kyowa Hakko Kirin Pharma, Lipid Therapeutics, MedImmune, Millenium, Mitsubishi Tanabe Pharma Corporation, MSD, Novartis, Ocera, Otsuka, PDL, Pharmacosmos, Pfizer, Procter & Gamble, Prometheus, Robarts Clinical Trials, Schering‐Plough, Setpointmedical, Shire, Takeda, Therakos, Tigenix, UCB, Vifor, Yakult, Zyngenia, and 4SC; and is an employee of McMaster University and Medical University of Vienna.
Declaration of funding interests: Clinical studies and population pharmacokinetic and pharmacodynamic analyses were funded by Millennium Pharmaceuticals, Inc. (d/b/a Takeda Pharmaceuticals International, Co.), Cambridge, MA, USA. The population pharmacokinetic and pharmacodynamic analyses were performed by Nathanael L. Dirks and Marc R. Gastonguay, Metrum Research Group LLC, Tariffville, CT, USA. Editing assistance was provided by Elisabeth R. Wann, PhD, Wann Medical Communications, LLC, Wilmette, IL, USA, and was supported by Takeda Pharmaceuticals International, Inc., Deerfield, IL, USA. The results of these analyses were previously presented at the 9th Congress of European Crohn's and Colitis Organisation – Inflammatory Bowel Diseases 2014 and at the Digestive Disease Week 2014 Annual Scientific Meeting. The authors thank Michael Bargfrede, BS, and Sanhita Abrol, MS, for their assistance with generating the data sets and figures, and Dennis Noe, MD, for his technical guidance during development of the analysis plan.
This article was accepted for publication after full peer‐review.
References
- 1. Soler D, Chapman T, Yang LL, Wyant T, Egan R, Fedyk ER. The binding specificity and selective antagonism of vedolizumab, an anti‐alpha4beta7 integrin therapeutic antibody in development for inflammatory bowel diseases. J Pharmacol Exp Ther 2009; 330: 864–75. [DOI] [PubMed] [Google Scholar]
- 2. Paul S, Moreau AC, Del Tedesco E, et al Pharmacokinetics of adalimumab in inflammatory bowel diseases: a systematic review and meta‐analysis. Inflamm Bowel Dis 2014; 20: 1288–95. [DOI] [PubMed] [Google Scholar]
- 3. Ordas I, Mould DR, Feagan BG, Sandborn WJ. Anti‐TNF Monoclonal Antibodies in Inflammatory Bowel Disease: Pharmacokinetics‐Based Dosing Paradigms. Clin Pharmacol Ther 2012; 91: 635–46. [DOI] [PubMed] [Google Scholar]
- 4. Colombel JF, Feagan BG, Sandborn WJ, Van Assche G, Robinson AM. Therapeutic drug monitoring of biologics for inflammatory bowel disease. Inflamm Bowel Dis 2012a; 18: 349–58. [DOI] [PubMed] [Google Scholar]
- 5. Feagan BG, Greenberg GR, Wild G, et al Treatment of active Crohn's disease with MLN0002, a humanized antibody to the alpha4beta7 integrin. Clin Gastroenterol Hepatol 2008; 6: 1370–7. [DOI] [PubMed] [Google Scholar]
- 6. Feagan BG, Greenberg GR, Wild G, et al Treatment of ulcerative colitis with a humanized antibody to the alpha4beta7 integrin. N Engl J Med 2005; 352: 2499–507. [DOI] [PubMed] [Google Scholar]
- 7. Parikh A, Leach T, Wyant T, et al Vedolizumab for the treatment of active ulcerative colitis: a randomized controlled phase 2 dose‐ranging study. Inflamm Bowel Dis 2012; 18: 1470–9. [DOI] [PubMed] [Google Scholar]
- 8. Feagan BG, Rutgeerts P, Sands BE, et al Vedolizumab as induction and maintenance therapy for ulcerative colitis. N Engl J Med 2013; 369: 699–710. [DOI] [PubMed] [Google Scholar]
- 9. Sandborn WJ, Feagan BG, Rutgeerts P, et al Vedolizumab as induction and maintenance therapy for Crohn's disease. N Engl J Med. 2013; 369: 711–21. [DOI] [PubMed] [Google Scholar]
- 10. Sands BE, Feagan BG, Rutgeerts P, et al Effects of vedolizumab induction therapy for patients with Crohn's disease in whom tumor necrosis factor antagonist treatment failed. Gastroenterology 2014; 147: 618–27. [DOI] [PubMed] [Google Scholar]
- 11. Rosario M, French J, Dirks N, Milton A, Fox I, Gastonguay M, eds. Exposure‐response relationship during vedolizumab induction therapy in adults with ulcerative colitis. 9th Congress of the European Crohn's and Colitis Organisation; 20–22 February 2014; Copenhagen, Denmark: J Crohns Colitis, 2014a.
- 12. Rosario M, French J, Dirks N, Milton A, Fox I, Gastonguay M, eds. Exposure‐response relationship of vedolizumab after 6 weeks of treatment in adults with Crohn's disease. 9th Congress of the European Crohn's and Colitis Organisation; 20–22 February 2014; Copenhagen, Denmark: J Crohns Colitis, 2014b.
- 13. Beal SL, Sheiner LB, Boeckmann AJ, Bauer RJ, eds. NONMEM Users Guide Part I‐VIII. Hanover, MD: ICON Development Solutions, 1989–2012. [Google Scholar]
- 14. Gastonguay M, ed. A full model estimation approach for covariate effects: Inference based on clinical importance and estimation precision. American Association of Pharmaceutical Scientists Annual Meeting and Exposition; 7–11 November 2004; Baltimore, MD: AAPS Journal, 2004.
- 15. Gibiansky L, Gibiansky E. Target‐mediated drug disposition model: relationships with indirect response models and application to population PK‐PD analysis. J Pharmacokinet Pharmacodyn 2009; 36: 341–51. [DOI] [PubMed] [Google Scholar]
- 16. Tabrizi MA, Tseng CM, Roskos LK. Elimination mechanisms of therapeutic monoclonal antibodies. Drug Discov Today 2006; 11: 81–8. [DOI] [PubMed] [Google Scholar]
- 17. Dirks NL, Nolting A, Kovar A, Meibohm B. Population pharmacokinetics of cetuximab in patients with squamous cell carcinoma of the head and neck. J Clin Pharmacol 2008; 48: 267–78. [DOI] [PubMed] [Google Scholar]
- 18. Frey N, Grange S, Woodworth T. Population pharmacokinetic analysis of tocilizumab in patients with rheumatoid arthritis. J Clin Pharmacol 2010; 50: 754–66. [DOI] [PubMed] [Google Scholar]
- 19. Ng CM, Joshi A, Dedrick RL, Garovoy MR, Bauer RJ. Pharmacokinetic‐pharmacodynamic‐efficacy analysis of efalizumab in patients with moderate to severe psoriasis. Pharm Res 2005; 22: 1088–100. [DOI] [PubMed] [Google Scholar]
- 20. Xu Z, Seitz K, Fasanmade A, et al Population pharmacokinetics of infliximab in patients with ankylosing spondylitis. J Clin Pharmacol 2008; 48: 681–95. [DOI] [PubMed] [Google Scholar]
- 21. Fasanmade AA, Adedokun OJ, Ford J, et al Population pharmacokinetic analysis of infliximab in patients with ulcerative colitis. Eur J Clin Pharmacol 2009; 65: 1211–28. [DOI] [PMC free article] [PubMed] [Google Scholar]
- 22. Zhou H, Jang H, Fleischmann RM, et al Pharmacokinetics and safety of golimumab, a fully human anti‐TNF‐alpha monoclonal antibody, in subjects with rheumatoid arthritis. J Clin Pharmacol 2007; 47: 383–96. [DOI] [PubMed] [Google Scholar]
- 23. Colombel JF, Feagan B, Sandborn W, Assche Gv, Robinson A. Therapeutic drug monitoring of biologics for inflammatory bowel disease. Inflamm Bowel Dis 2012; 18: 349–58. [DOI] [PubMed] [Google Scholar]
- 24. Nestorov I. Clinical pharmacokinetics of TNF antagonists: how do they differ? Semin Arthritis Rheum 2005; 5(Suppl. 1): 12–8. [DOI] [PubMed] [Google Scholar]
- 25. Dirks NL, Meibohm B. Population pharmacokinetics of therapeutic monoclonal antibodies. Clin Pharmacokinet 2010; 49: 633–59. [DOI] [PubMed] [Google Scholar]
- 26. Fasanmade AA, Adedokun OJ, Olson A, Strauss R, Davis HM. Serum albumin concentration: a predictive factor of infliximab pharmacokinetics and clinical response in patients with ulcerative colitis. Int J Clin Pharmacol Ther 2010; 48: 297–308. [DOI] [PubMed] [Google Scholar]
- 27. Brandse JF, van der Kleij D, Wolbink GJ, et al The pharmacokinetics of infliximab induction therapy in patients with moderate to severe ulcerative colitis. Gastroenterology 2014; 146(5 Suppl. 1): S134. [Google Scholar]
- 28. Van Moerkercke W, Ackaert C, Compernolle G, et al High infliximab levels are associated with mucosal healing in Crohn's disease. Gastroenterology 2010; 138(Suppl. 1): S60. [Google Scholar]
- 29. Roblin X, Marotte H, Rinaudo M, et al Association between pharmacokinetics of adalimumab and mucosal healing in patients with inflammatory bowel diseases. Clin Gastroenterol Hepatol 2014; 12: 80–4. [DOI] [PubMed] [Google Scholar]
- 30. Colombel JF, Sandborn WJ, Allez M, et al Association between plasma concentrations of certolizumab pegol and endoscopic outcomes of patients with Crohn's disease. Clin Gastroenterol Hepatol 2014; 12: 423–31. [DOI] [PubMed] [Google Scholar]
- 31. Wade JR, Parker G, Kosutic G, et al Population pharmacokinetic analysis of certolizumab pegol in patients with Crohn's disease. J Clin Pharmacol 2015. [Epub ahead of print]. [DOI] [PMC free article] [PubMed] [Google Scholar]
- 32. Velagapudi RB, Noertersheuser P, Awni W, et al , eds. Effect of methotrexate (MTX) coadministration on the pharmacokinetics (PK) of adalimumab (HUMIRA (TM), Abbott) following a single intravenous (iv) injection. American College of Rheumatology 67th Annual Meeting; 23–28 October 2003; Orlando, FL: Arthritis Rheum, 2003.
- 33. Chow A, Earp J, Gupta M, et al Utility of population pharmacokinetic modeling in the assessment of therapeutic protein‐drug interactions. J Clin Pharmacol 2014; 54: 593–601. [DOI] [PubMed] [Google Scholar]
- 34. Earp J, Fang L, Ma L, et al Assessing labeling claims for drug interactions using a population PK approach: Vedolizumab. J Pharmacokinet Pharmacodyn 2014; 41: S39. [Google Scholar]
Associated Data
This section collects any data citations, data availability statements, or supplementary materials included in this article.
Supplementary Materials
Figure S1. Goodness‐of‐fit plots for the vedolizumab final population pharmacokinetic model: residual and conditional weighted residual with interaction (CWRESI) vs. time and population predicted vedolizumab concentration.
Figure S2. Predictive check for the vedolizumab final population pharmacokinetic model: induction therapy.
Figure S3. Predictive check for the vedolizumab final population pharmacokinetic model: maintenance therapy every 4 weeks.
Figure S4. Predictive check for the vedolizumab final population pharmacokinetic model: maintenance therapy every 8 weeks.
Figure S5. Goodness‐of‐fit plots for the population pharmacodynamic MAdCAM‐1 model.
Table S1. Clinical studies included in vedolizumab population pharmacokinetic–pharmacodynamic analyses.
Table S2. Estimates of interindividual variability (%CV) and correlations from the vedolizumab final population pharmacokinetic model.
Table S3. Standard deviations and shrinkage estimates of interindividual random effects from the vedolizumab final population pharmacokinetic model.
Table S4. Covariate parameter estimates from the vedolizumab final population pharmacokinetic model.
Appendix S1. Population pharmacokinetic and pharmacodynamic analysis methods, including modelling assumptions and model evaluation.